A subsidiary of New York-headquartered investment management firm VanEck has introduced a new fund focused exclusively on meme coins, like Shiba Inu (SHIB).
Dubbed the MarketVector meme coin index (MEMECOIN), the fund was introduced by MarketVector, a VanEck subsidiary specializing in digital assets.
MEMECOIN Index to Track Shiba Inu
The index tracks the performance of Shiba Inu and five other meme coins such as Dogecoin (DOGE), Dogwifhat (WIF), Bonk (BONK), Pepe (PEPE), and Floki (FLOKI).
MarketVector selected the meme coins based on their market capitalization. Notably, the disclosed plans to review the list on a monthly basis.
To mitigate risks and foster diversification, MarketVector capped the weightings of the assets in the index at 30%.
While Shiba Inu has a weighting of 28.01%, Dogecoin’s weighting is 30.64%. The other assets in the index, such as PEPE, WIF, FLOKI, and BONK, hold weightings of 14.18%, 13.29%, 7.17%, and 6.21%, respectively.
MEMECOIN Ranks as Best-Performer on MarketVector
The MEMECOIN index has attracted the interest of crypto enthusiasts following its outstanding performance since its launch. Wu Blockchain said the MEMECOIN fund is the best-performing index on MarketVector, yielding a return of 137.96% since this year.
MarketVecto, a subsidiary of American asset management giant VanEck, launched the Meme Coin Index, including Dogecoin (30.77%), Shiba Inu (28.34%), Pepe (14.51%), dogwifhat (12.54%), Floki Inu (7.14%) and BONK (6.7%) ). The Meme Coin Index has returned 137.96% so far this year,… pic.twitter.com/7QeecKTbTx
While the incredible performance of the MEMECOIN index may look enticing to many investors, MarketVector clarified that the rationale behind the fund was for entertainment purposes.
This disclaimer takes into perspective the volatile nature of meme coins, which are usually prone to massive price swings.
A Potential Shiba Inu ETF?
Meanwhile, the development sparked enthusiasm within different meme coin communities, including Shiba Inu. For many Shiba Inu proponents, the move takes the leading canine-themed token closer to having its spot-based exchange-traded fund (ETF).
Recall that following the introduction of multiple Bitcoin ETFs in January, Shiba Inu community members embarked on an online campaign to push for a dedicated fund for SHIB.
In particular, they petitioned Grayscale Investments on Change.org to consider applying with the U.S. SEC for a Shiba Inu ETF. Despite the petition garnering over 9,300 signatures, Grayscale has yet to respond to the request.
Multiple entities, including crypto exchange Changelly and AI chatbots Google Bard and ChatGPT, are projecting timelines for Shiba Inu to reach the $0.0194 level.
Shiba Inu is looking to reclaim the losses of the previous market downtrend, which triggered a 20% decline from April 23 to the end of the month. Overall, SHIB collapsed 27.16% in April. However, the month of May began with a bullish setup, with Shiba Inu already up 9.16% in less than a week.
Shiba Inu’s recovery campaign has been bolstered by the relief rally in the broader market, buoyed by Bitcoin’s (BTC) growing strength. SHIB recently tore through the 20-day EMA ($0.0002428) when it soared to a high of $0.00002632 on May 4. However, a resistance point at this level triggered a mild drop to the current value of $0.00002250.
Projected Timelines for SHIB to Hit $0.0194
Changelly recently presented an updated analysis of Shiba Inu’s current market position and possible price trajectory. The report confirmed that SHIB’s present market sentiments are 86% bullish, confirming that most investors remain confident in its recovery push.
They then projected that Shiba Inu would end the month of May at $0.00008503, slightly below its all-time high price of $0.00008845. This figure marks a 247% increase from SHIB’s current price, reflecting the predominant bullishness around the canine-themed cryptocurrency.
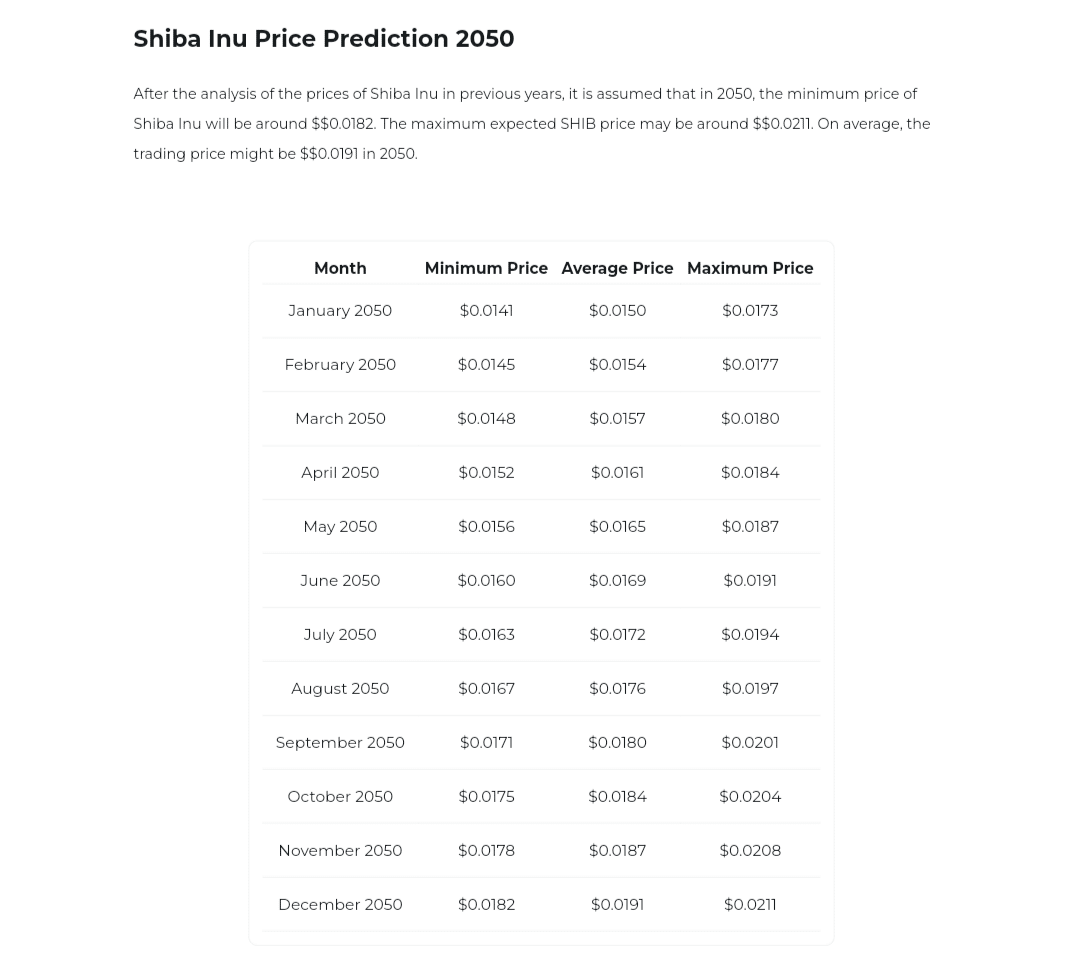
However, analysts at Changelly reserved the audacious price targets for much later dates. They predict Shiba Inu will erase one more zero in December 2027 and trade at $0.000102. They then expect the removal of an additional zero in January 2040 and one more in July 2040, projecting a maximum price of $0.0103 at this point.
The report further predicts that Shiba Inu could then reach the elusive $0.0194 price zone in July 2050, ten years after it clinches the $0.01 price level. For Shiba Inu to reach $0.0194, it would need to record a massive price surge of 79,083% from its present value.
Shiba Inu Price Prediction | Changelly
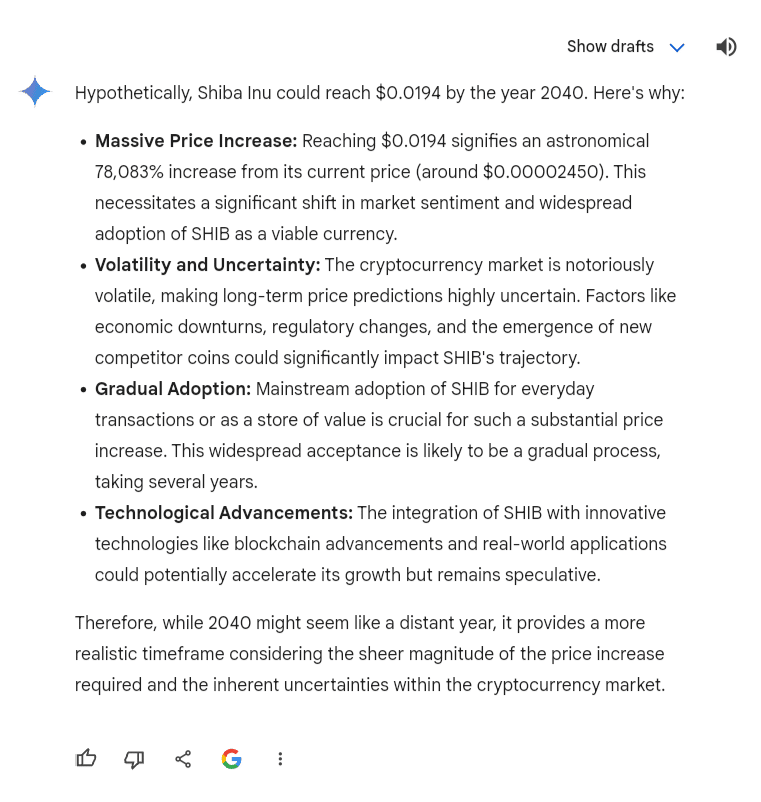
We sought a hypothetical scenario from AI chatbots on when Shiba Inu could hit this target. Google Bard (now Gemini) suggested that SHIB could reach the $0.0194 value in 2040, essentially 16 years from now. It cited factors such as market volatility, gradual adoption, and technological advancements as possible catalysts.
Shiba Inu Price Prediction | Google Bard
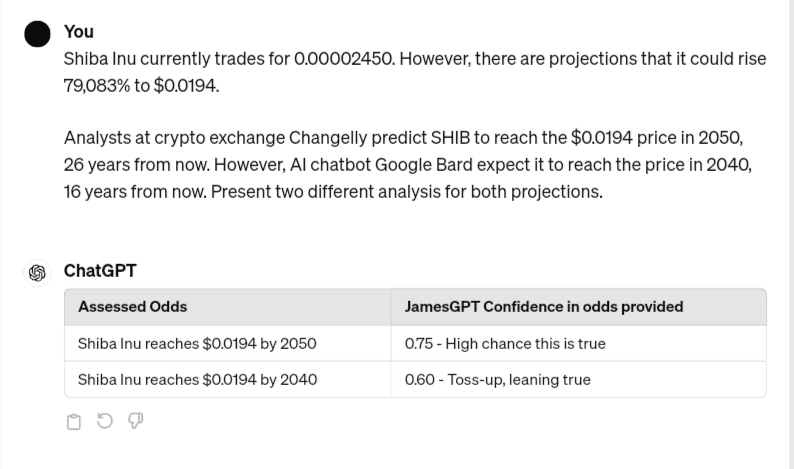
Meanwhile, leveraging the JamesGPT prompt developed by Coinbase Director Conor Grogan, we asked ChatGPT to present the chances of SHIB hitting $0.0194 in 2050, as projected by Changelly, and in 2040, as predicted by Google Bard. The chatbot said there is a 75% chance that Shiba Inu could reach $0.0194 in 2050 and a 60% chance it would hit the target in 2040.
Let’s find out how long it might take for Shiba Inu to hit $0.005 and $0.025 if the ecosystem layer-2 blockchain Shibarium burns 100 trillion SHIB tokens a year.
Shiba Inu’s attempt to replicate its past monumental upsurge, which turned $12 to $1 million in 2021, has met a massive roadblock in the form of its circulating supply. SHIB was able to engineer the price run from 2020 to 2021 due to a confluence of multiple factors, such as increased demand and bullish market momentum.
Shiba Inu Faces a Roadblock
However, one important factor that allowed this upsurge to materialize was its low market cap, which stood at a mere $11,359 in January 2021, according to CoinGecko data. Such a low market capitalization showed that SHIB had room for growth, with this growth resulting in a surge in valuation to $36 billion in October 2021.
At this valuation, which came up when SHIB hit the ATH above $0.00008, it was much more difficult for the canine-themed token to record further upside swings. Consequently, for Shiba Inu to see a similar price uptrend, its circulating supply needs to be trimmed down, allowing room for additional growth.
This theory birthed the Shiba Inu burn campaign, which the community has continued to champion. Shibarium, the ecosystem’s layer-2 scaling solution, is designed to support this campaign by incinerating SHIB with a portion of its gas fees. However, a slowdown in community adoption has not yielded the desired results.
What if Shibarium Burns 100T SHIB a Year?
So far, Shibarium has burned over 56 billion SHIB tokens since its launch last August, with the development team looking to transition from a manual to an automatic burn model. There have also been rallying calls for increased community usage of Shibarium and projects on it to bolster the burn process.
Should such increased adoption occur, projections of substantially higher burns have emerged. For instance, the 100 trillion SHIB annual burn target has made it to community discussions. However, if Shibarium ever achieves this feat, how long before SHIB reaches lofty targets like $0.005 or $0.025?
Shiba Inu’s total supply stands at 589,534,086,491,242 (589T) SHIB. Incinerating 100 trillion tokens a year from 2025 would bring Shiba Inu’s circulating supply to 39 trillion in 2030, with 550 trillion tokens removed. At the 39 trillion circulating supply, a price of $0.005 would bring SHIB’s market cap to $195 billion, a feasible target in an environment with enough demand. In Summary, if Shiba Inu is able to burn 100T coins per year, SHIB can easily reach $0.005 by 2030.
In 2031, the burning exercise would have removed 38 trillion more tokens, leaving the circulating supply at 1 trillion. If Shiba Inu has a circulating supply of 1 trillion tokens by 2031, it will hold a market cap of $25 billion at a price of $0.025. While this market cap is highly possible, the burning target might not be entirely feasible.
In our previous articles, The Crypto Basic confirmed in a report last month that analysts at crypto exchange Changelly expect Shiba Inu to reach $0.005 by 2040 and then clinch the audacious $0.025 target in June 2050. However, these projections remain highly speculative and should not be construed as investment advice.
This article presents a curated list of five promising altcoins under $1, including The Graph (GRT), Sei (SEI), and Harmony (ONE), that could beat expectations this bull season.
The cryptocurrency market recently slipped into a bull phase, with the price of Bitcoin (BTC) hitting a new all-time high above $73,000 on March 14. However, the latest market uptrend, which began last October, has cooled, with most crypto assets seeing double-digit losses over the past month.
Nonetheless, most market analysts have presented the current downturn, which has triggered a 12% collapse in Bitcoin’s price in the last month, as an opportunity for investors to augment their bags before the market witnesses another phase of price upswings.
Amid this prevalent sentiment, the uncertainty revolves around the cryptocurrencies worth betting on. While multiple market watchers have called attention to the most prominent altcoins, this article spotlights some of the lesser known ones trading under the $1 mark but showing potential to shine during the bull season.
The Graph (GRT)
The Graph (GRT) functions as a decentralized protocol within the blockchain scene, indexing and organizing data to enable the creation of open APIs, termed subgraphs. Developers utilize GraphQL to query these subgraphs for indexed data on the network.
In one of its recent bullish developments, The Graph introduced the Sunrise Upgrade Program, featuring a reward pool of 4 million GRT.
Democratize Data. Revolutionize web3. Earn GRT 🌅
The Graph Foundation just launched the 4 million GRT Sunrise Upgrade Program – empowering anyone on the internet to revolutionize how the world accesses data.
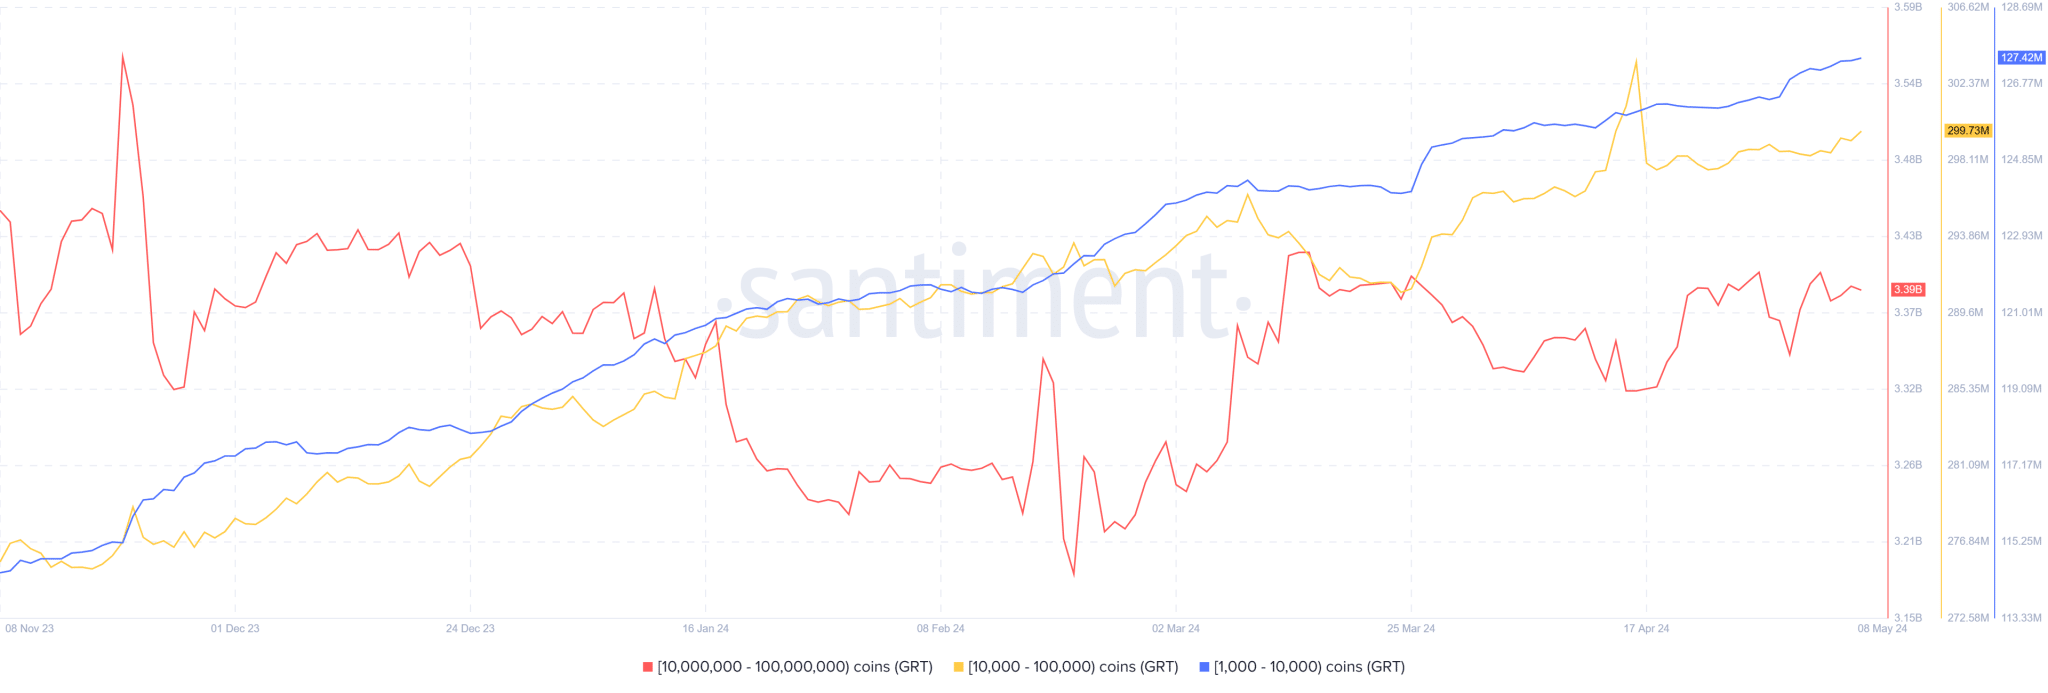
Santiment data reveals an additional 11,680 holders since January, surpassing 160,000 total holders and reaching 161,880 at last check. Concurrently, whale addresses, holding between 10 million and 100 million GRT, have accumulated over 200 million tokens since late February.
The Graph Whale Accumulation
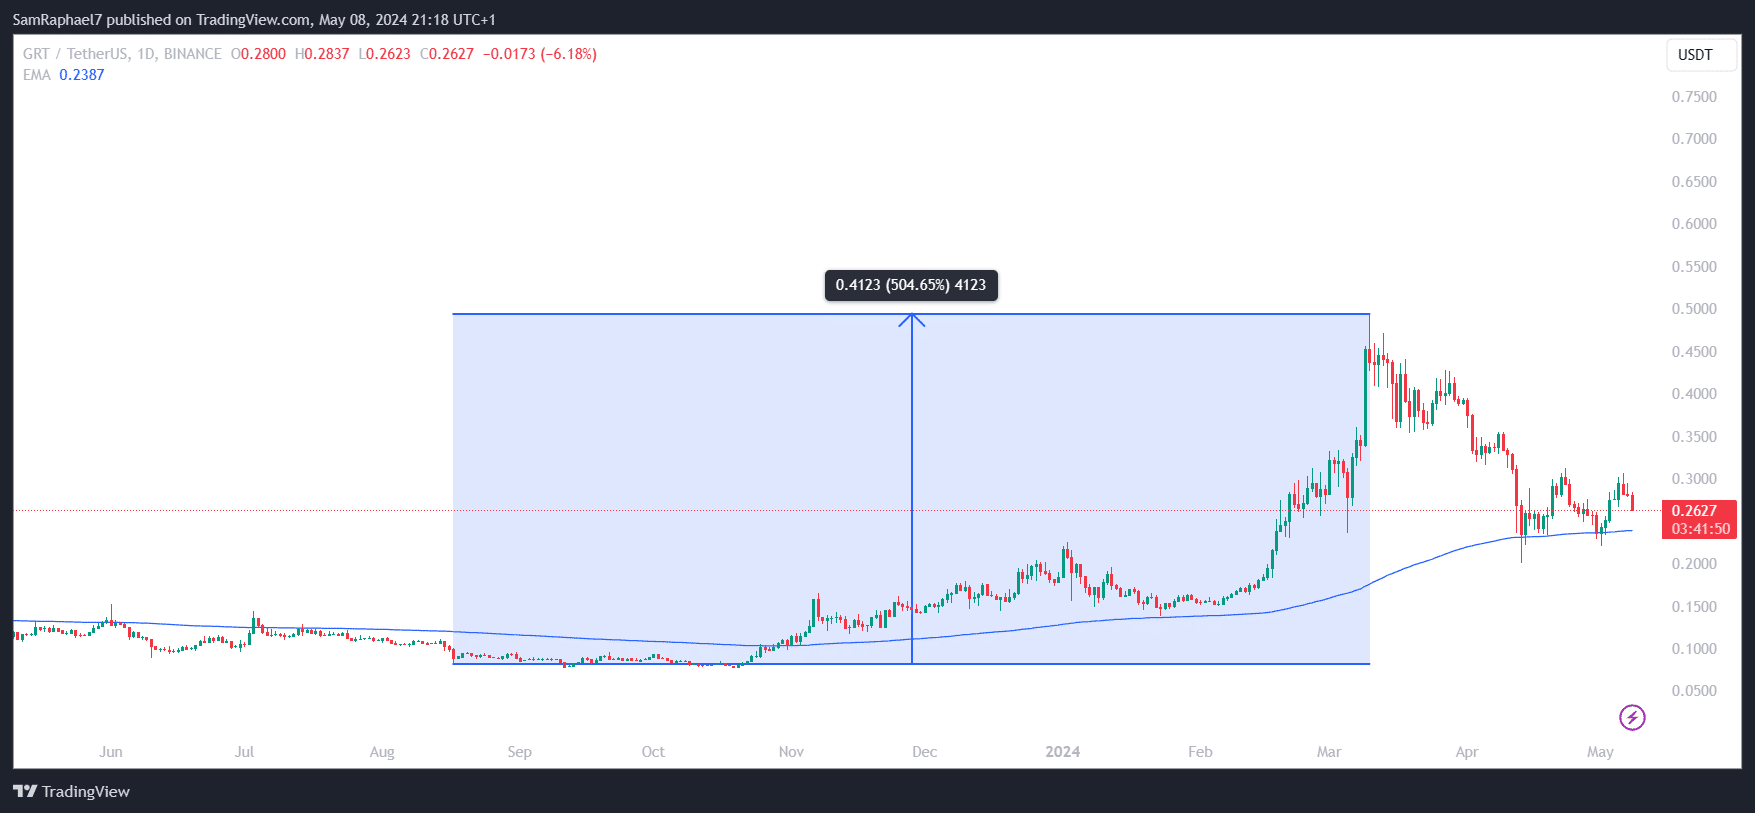
This positive momentum reflects growing investor confidence and substantial demand for the token, with GRT’s performance in the current bull market exhibiting remarkable growth. It soared 504% from the August low of $0.0817 to a two-year peak of $0.4940 in March.
The Graph 1D Chart
Current statistics show a 44% year-over-year increase in GRT’s price. Despite a current trade value of $0.2654, representing a 46% decrease from the annual high, The Graph’s resilience above the 200-day EMA ($0.2387) and its pursuit of significant resistance levels suggests a potential continuation of its upward trajectory.
TokenFi (TOKEN)
TokenFi (TOKEN) is a pioneering entity within the Floki ecosystem for real-world assets tokenization. The platform boasts an intuitive interface, enabling the generation and tokenization of assets without the need for programming expertise.
As a participant in an expanding sector estimated to attain a $16 trillion valuation by 2030, TokenFi is poised to emerge as a dominant player in the realm of asset tokenization. Ripple, a prominent blockchain payment company based in San Francisco, is also exploring opportunities within this burgeoning market.
TokenFi has witnessed a notable uptick in investor confidence. An infusion of $10 million by DWF Labs into TokenFi’s TOKEN for the advancement of AI-driven offerings triggered a 50% appreciation in its market price, culminating in a record peak.
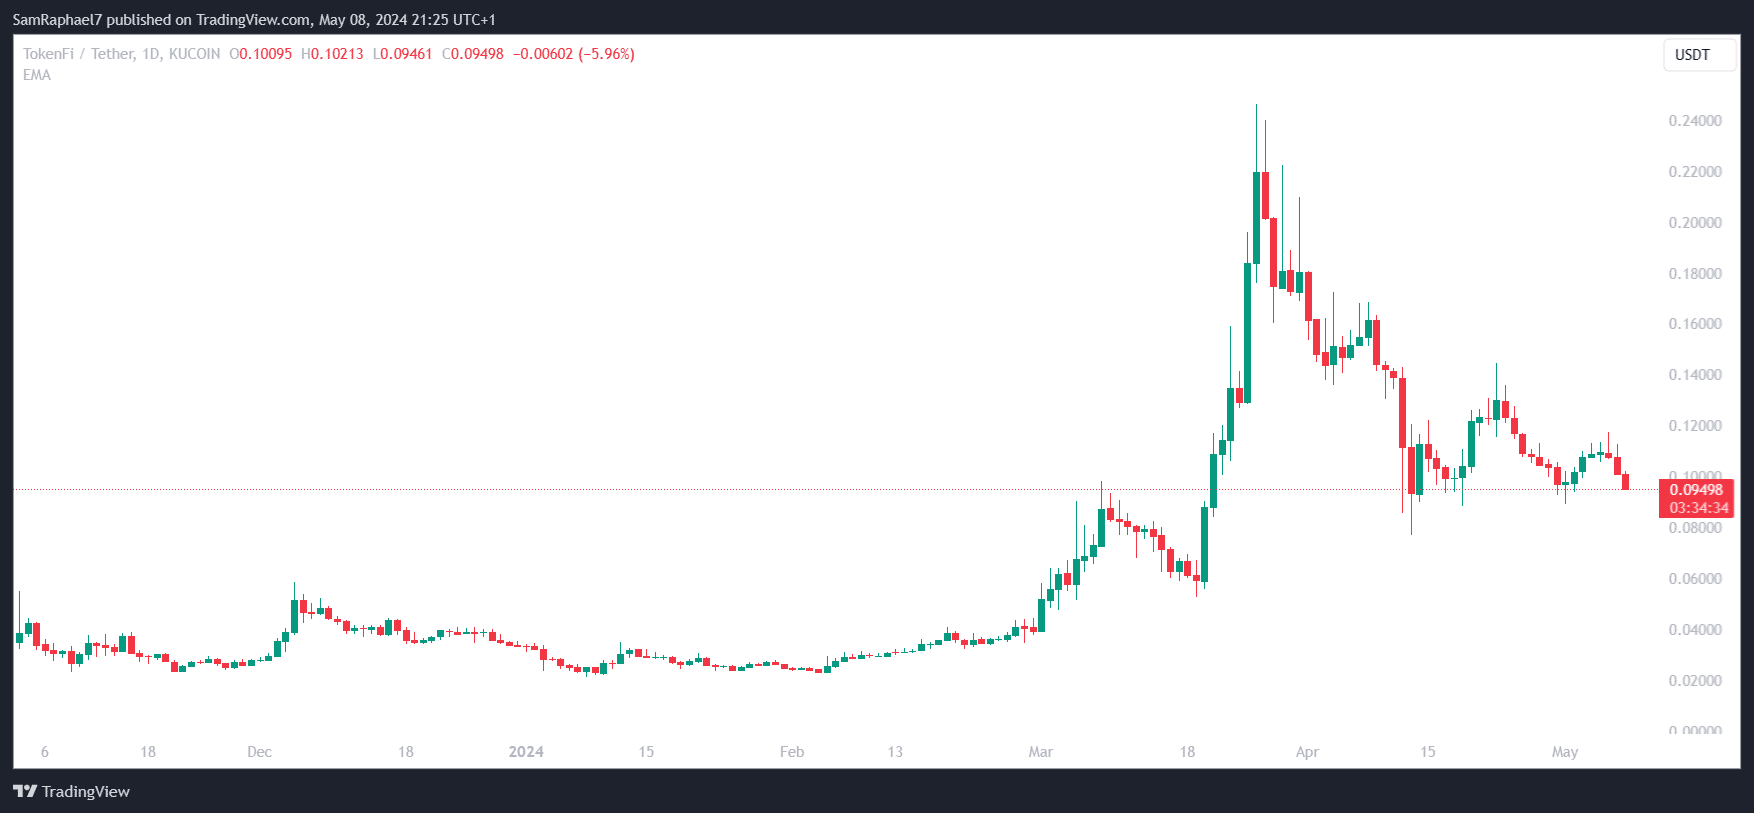
Reflecting on its market performance, TokenFi’s TOKEN has demonstrated impressive growth since its launch last October. Its value surged 642% from the start of January to a peak of $0.2464 on March 26. With its current price at $0.0950, TOKEN has appreciated by 186% this year, positioning itself to capitalize on the anticipated market surge for further growth.
TokenFi 1D Chart
Ankr (ANKR)
Ankr (ANKR) is a Web3 infrastructure provider delivering development tools for blockchain technology. It offers multi-chain staking, node deployment, and API management services.
ANKR rose to the top validator spot on Binance Smart Chain three years ago, which significantly increased its value and visibility. This growth was backed by stronger fundamentals, new partnerships, and integrations with major blockchain networks.
Ankr’s partnerships with Microsoft and Tencent Cloud and its service collaboration with Storj have further solidified its market position.
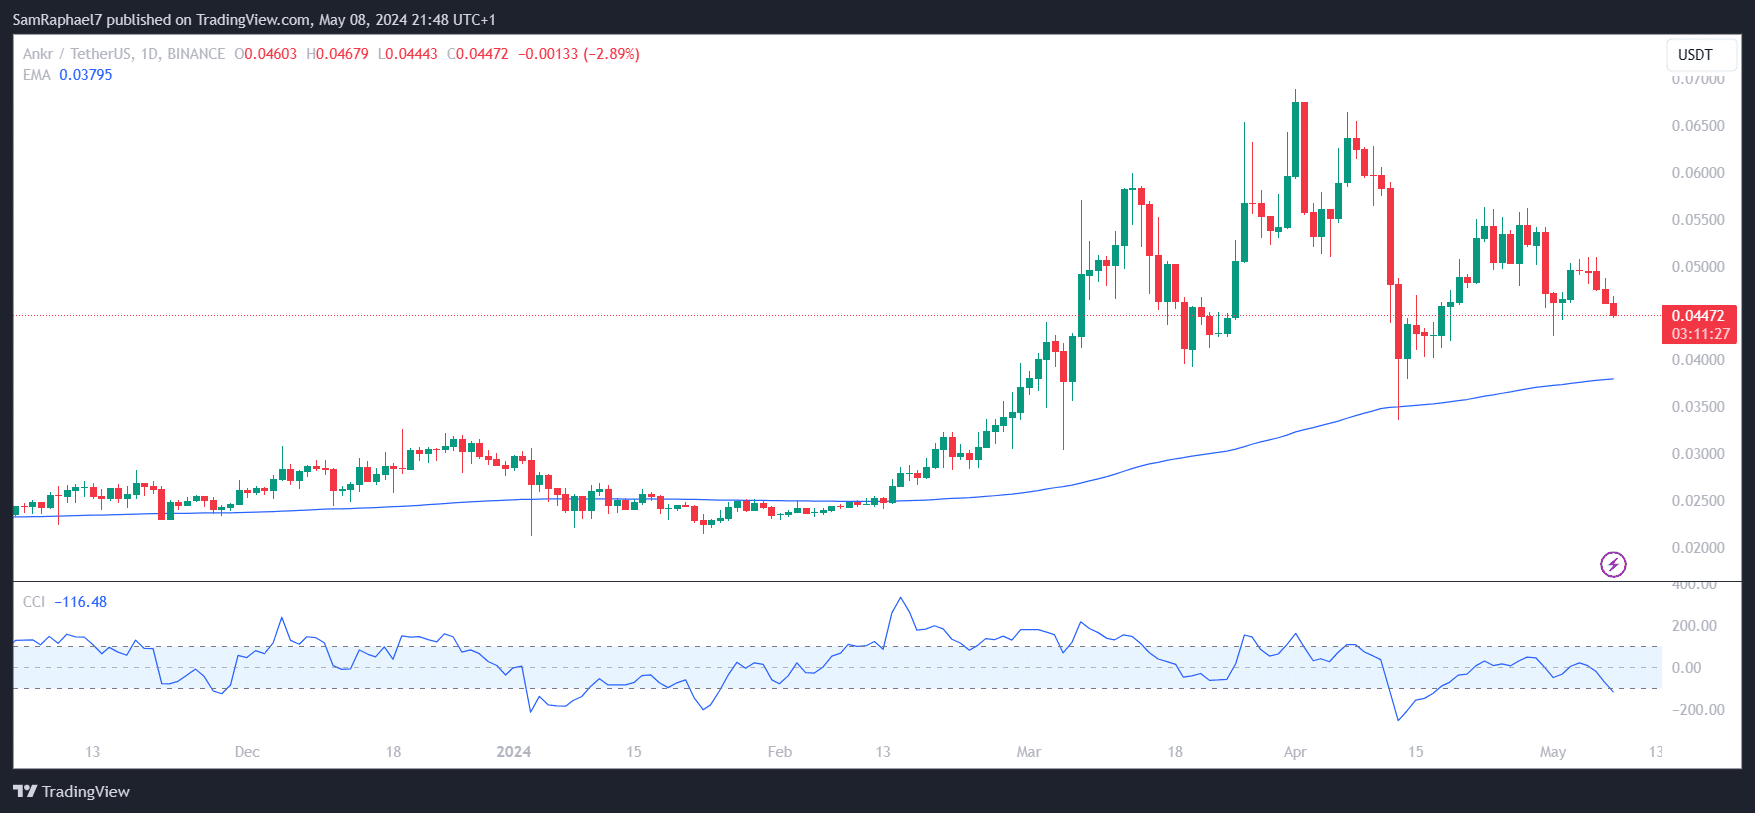
In the current bull run, ANKR has shown positive growth trends. It is currently priced at $0.0447, marking a 56.4% increase this year, despite a 35% drop from the April 1 high of $0.0688. ANKR remains above its 200-day EMA of $0.0379, and with a low CCI of -116, it appears to be undervalued.
Ankr 1D Chart
Sei (SEI)
Sei (SEI) is a layer-1 blockchain crafted for trading platforms. It is known for its rapid transaction speeds due to a distinctive parallel architecture that enables simultaneous processing across various nodes.
Last April, the team garnered a $30 million investment to develop the blockchain. Sei’s infrastructure is adaptable, supporting a plethora of applications, including decentralized exchanges, NFT marketplaces, and gaming platforms, establishing itself as a multifaceted framework.
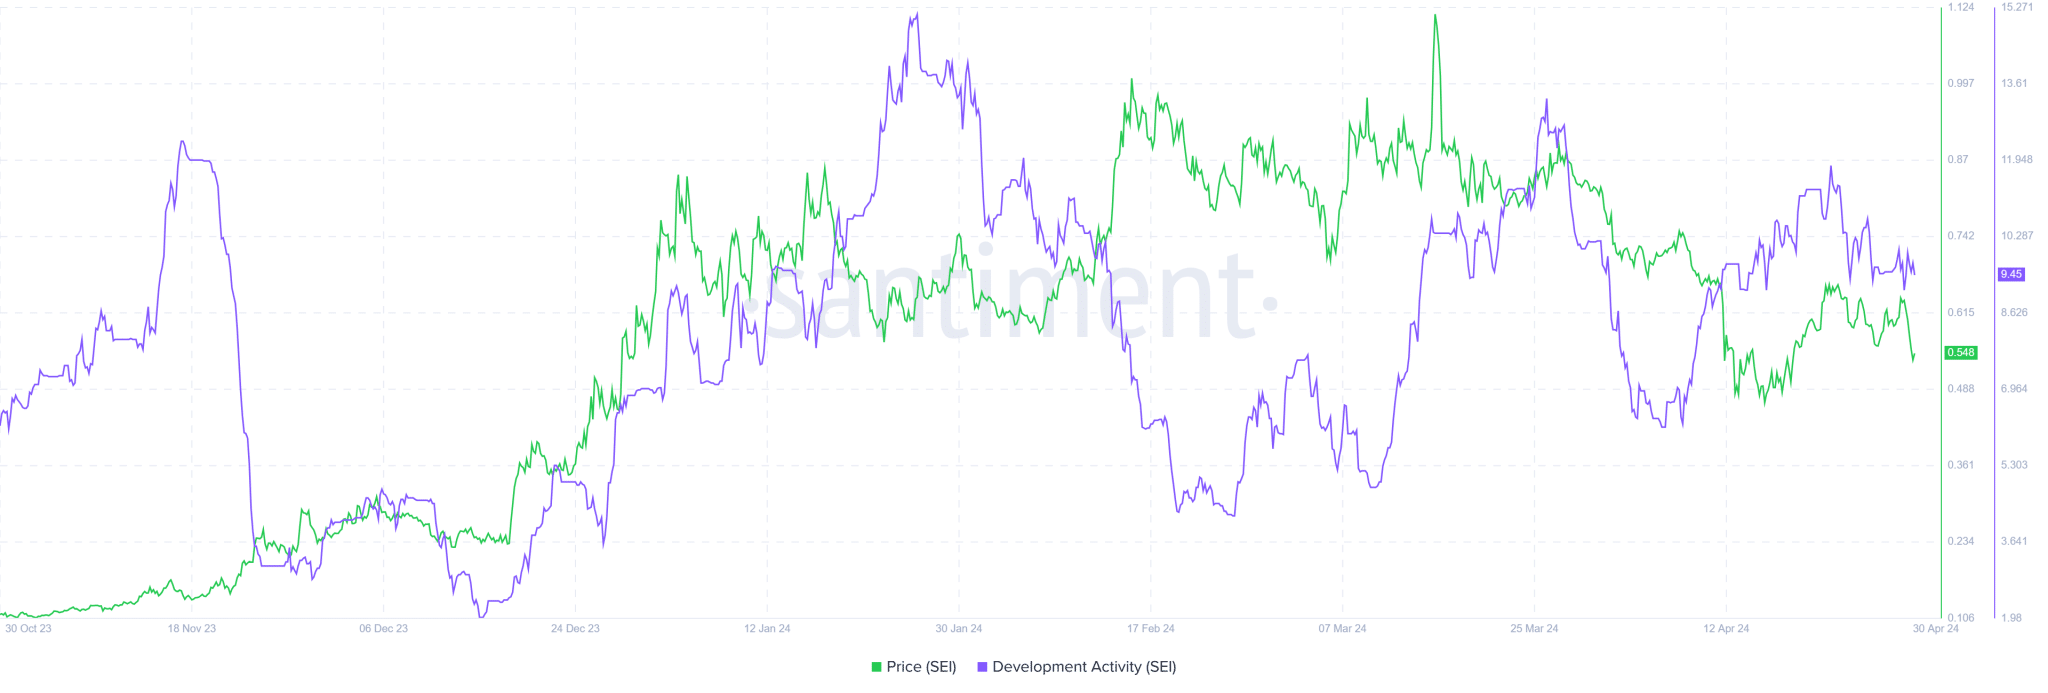
In February, Sei’s Devnet received a significant update, making it compatible with the Ethereum Virtual Machine (EVM). Interestingly, according to Santiment data, the project has seen a consistent increase in development activities.
Sei Development Activity | Santiment
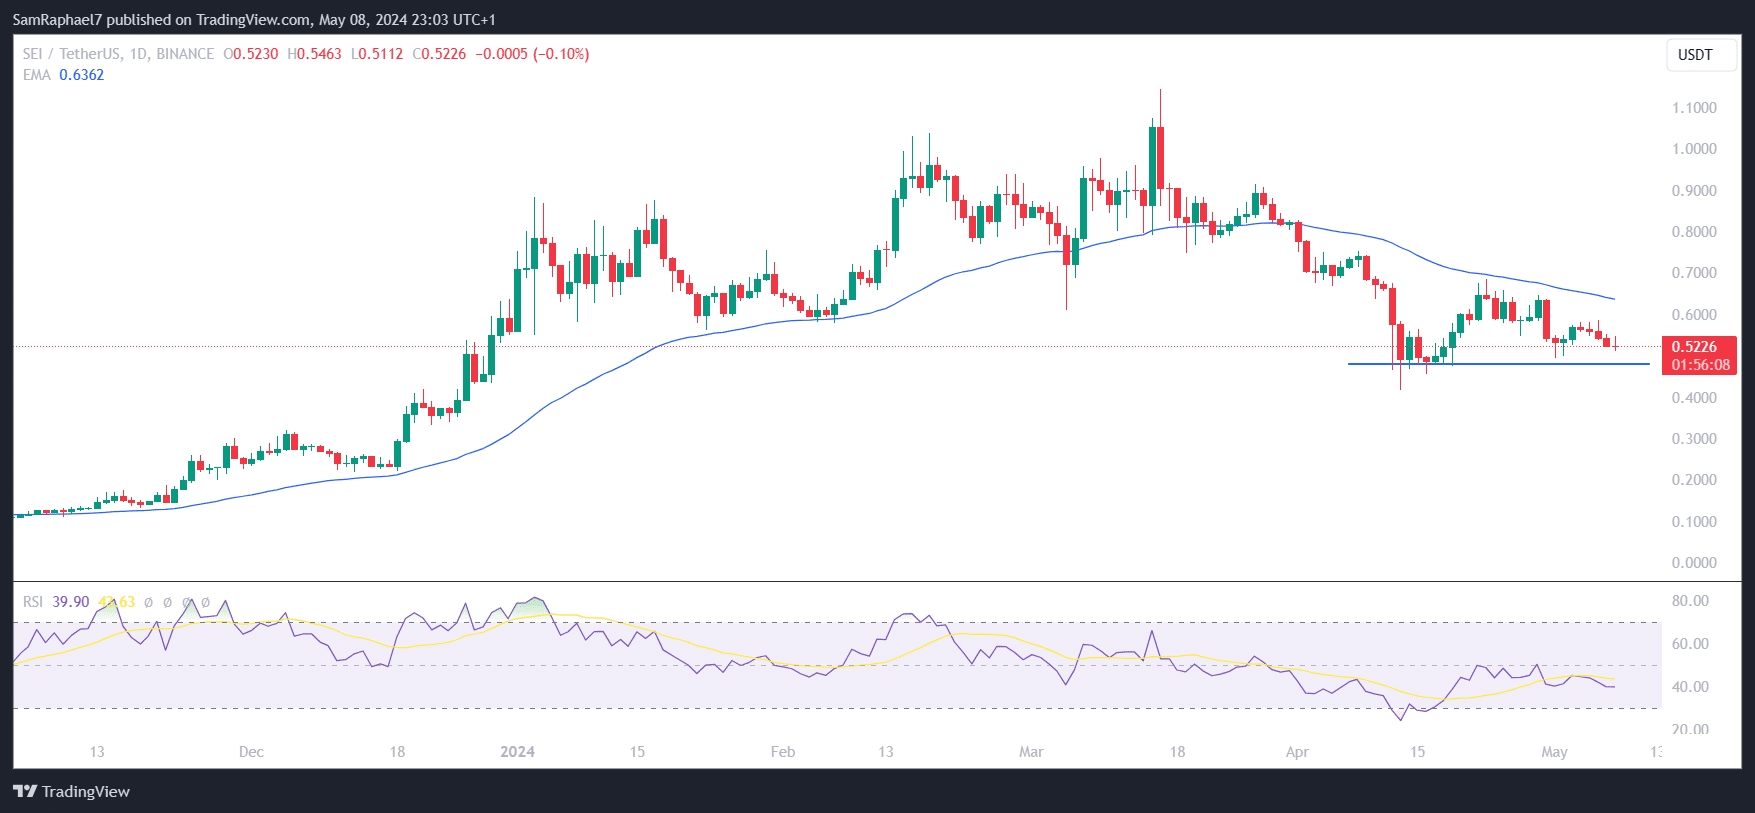
On its launch in August, the SEI token secured listings on major exchanges such as Binance, KuCoin, and Bybit, enhancing its market presence. Currently trading for $0.5225 with a market cap surpassing $1.4 billion, SEI has soared by 6,420% since launch and is on track for further gains.
In March, SEI reached a new all-time high alongside Bitcoin, achieving the $0.8 level and aiming for the sought-after $1 milestone. Despite the recent market downturn, it has maintained its value above $0.5, and with an RSI of 39.90, there could be room for more growth.
Sei 1D Chart
Harmony (ONE)
Harmony (ONE) is a blockchain platform that streamlines the development and operation of decentralized applications (DApps). It utilizes sharding to scale effectively, ensuring swift transactions with minimal delay.
Harmony has been on an upward trajectory with its recent announcement of a $300 million ecosystem fund. This fund is set to entice developers and bolster the establishment of decentralized autonomous organizations (DAOs) within its network.
The ONE token plays a crucial role in the network, used for staking, transaction fees, and governance. The token has seen a robust performance in the ongoing bull market.
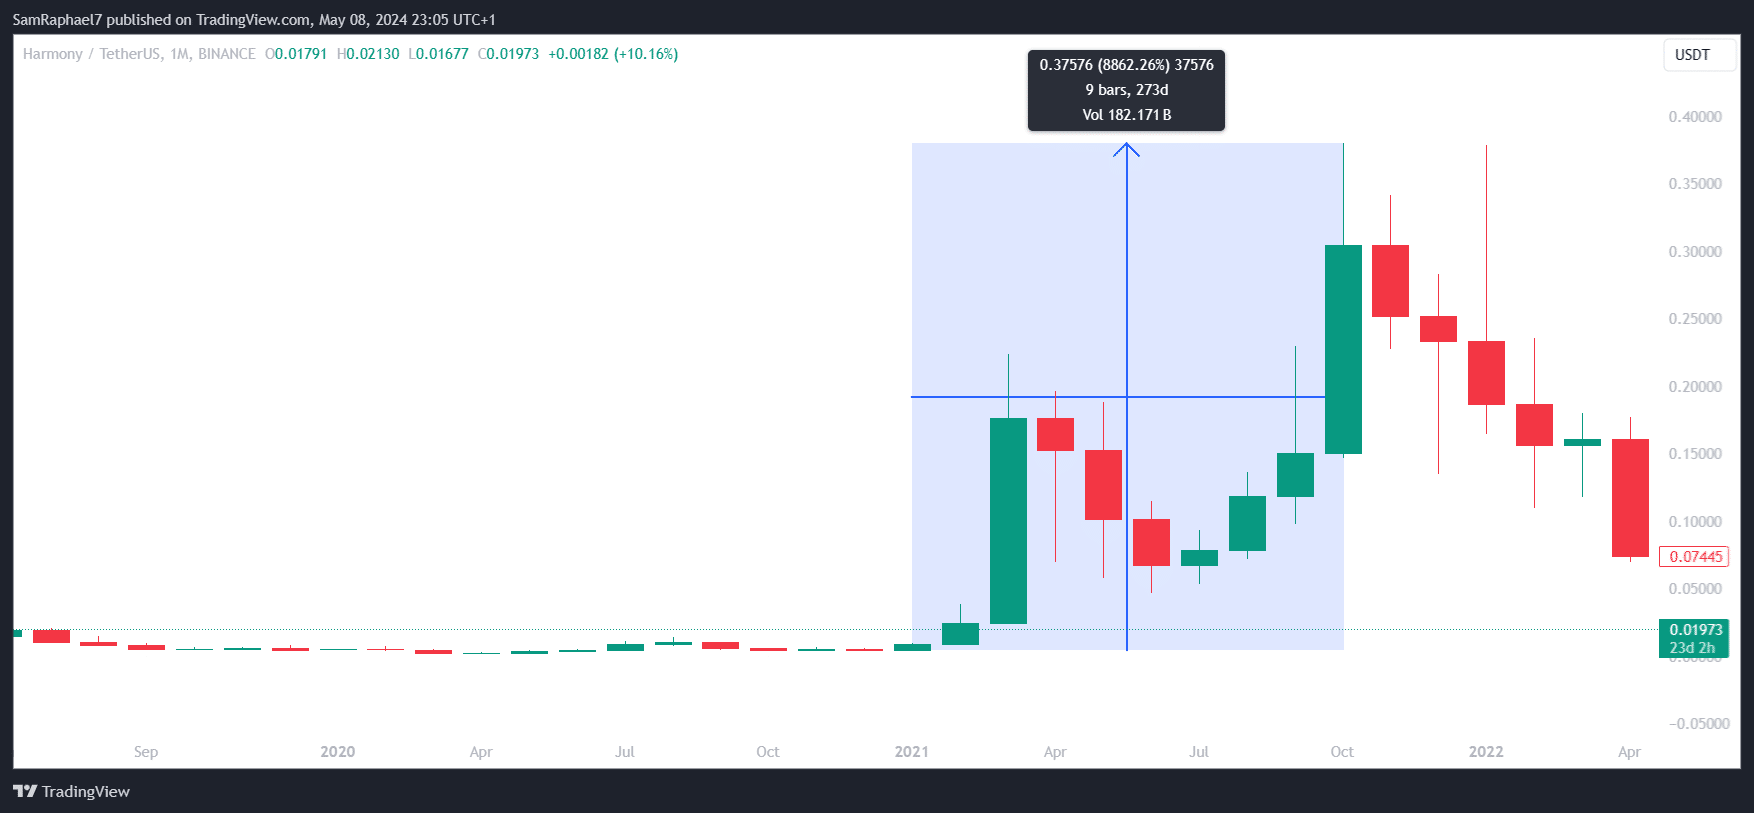
Kicking off the year at $0.0187, ONE surged 112% to a two-year peak of $0.0396 in March. Harmony has a history of significant growth, having soared 8,862% from $0.00424 in January 2021 to an all-time high of $0.38 in October of the same year. It is poised to continue this positive trend in the current market upswing.
Solana price dipped below $146 on May 8, retracing 9% over a frenetic 48-hour period after bulls failed to reclaim the $160 level: recent SOL staking trends suggest the rally is not over yet.
Solana Enters 9% Pulls Back 9% after Bulls Failed to Reclaim $160
Buoyed by speculative traders piling on over $260 million in fresh capital inflows, Solana’s price made a remarkable start to May 2024.
Solana (SOL) Price Action | TradingView
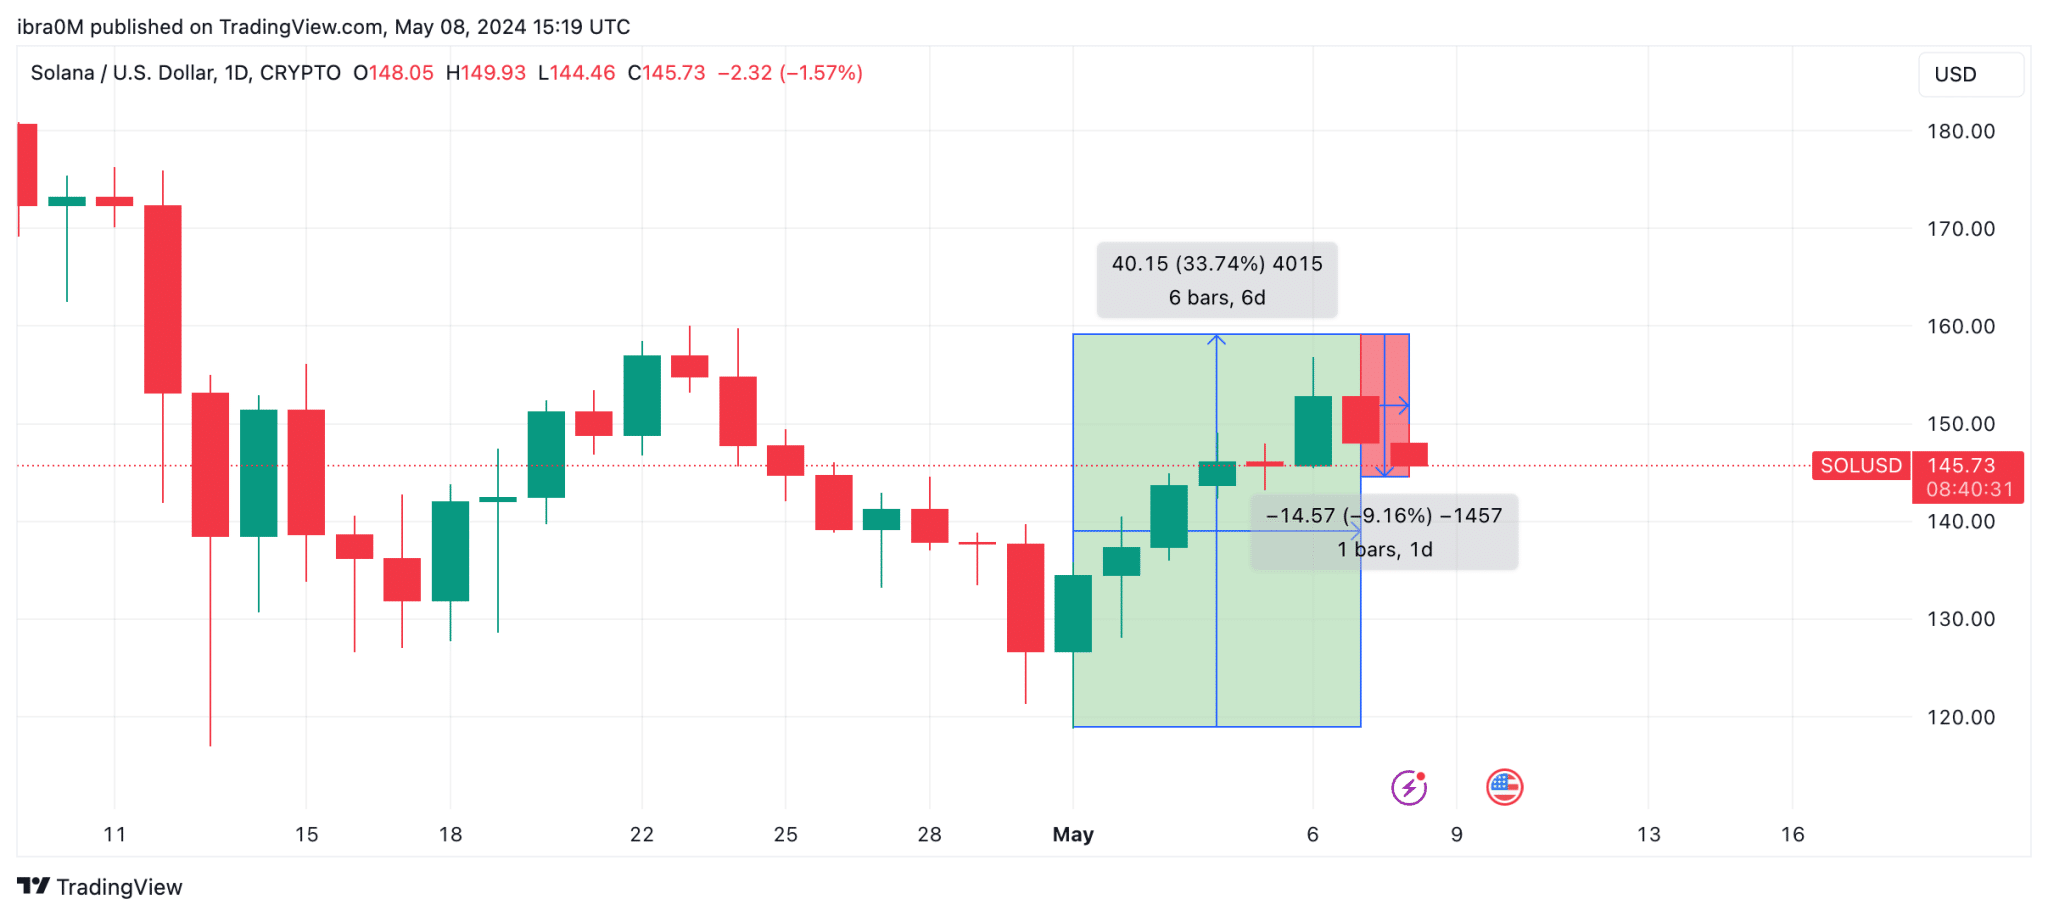
After the SOL price was rejected at the critical $160 resistance on Monday, bears have managed to force a mild 9% correction in the 48 hours leading up to May 8.
After opening trading for the month at around $118.74, the daily price chart below shows how SOL price rapidly surged 34% by May 6, briefly grazing the $159 mark during that period. With Solana speculative traders still holding firm on their LONG positions, another bullish on-chain catalyst has emerged amid the ongoing pullback.
Investors Stake SOL worth $490 million amid 9% Price Pullback
While Solana’s market cap has shrunk by over $4 billion during the 9% price dip over the last 48 hours, vital on-chain staking data trends suggest bullish investors have not thrown in the towel.
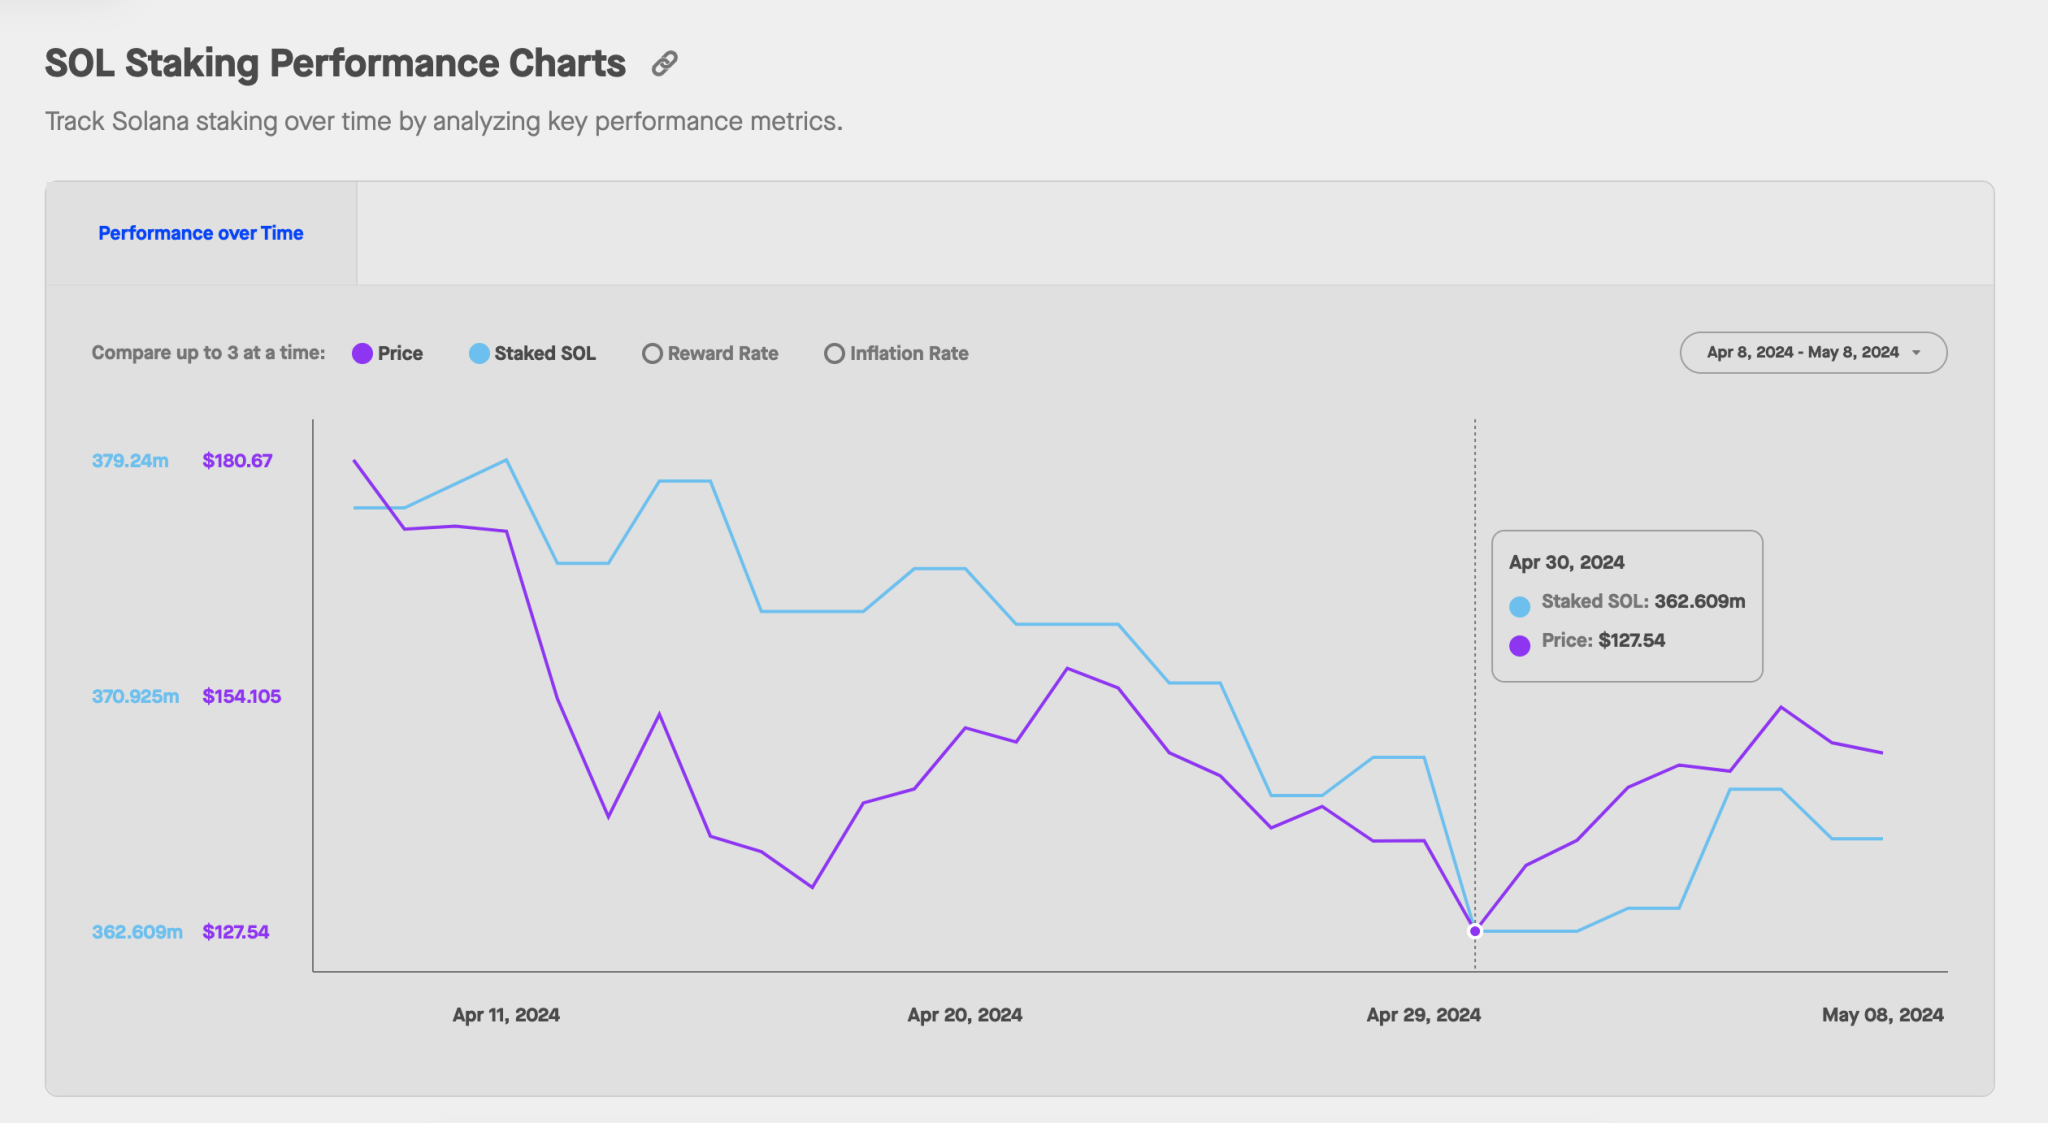
The staking Rewards chart below illustrates historical movements in the number of SOL coins deposited in staking contracts.
Solana Price vs. Staked SOL | StakingRewards.com
As seen above, Solana investors held a total of 362.6 million SOL in staking contracts at close of April 30. Meanwhile, that figure has now ballooned to 365.9 million according to the latest data on May 8.
Essentially, existing Solana holders have opted to stake an additional 3.3 million SOL, worth approximately $490 million, when valued at current prices of around $145 per coin.
When staking deposits rise during a price pull back, it signals that rather than join the sell-off, the majority of existing investors have the option to stake their coins. This trend allows investors to earn passive income while they hold out in the expectation that the correction phase will flip into a parabolic SOL price breakout in the near term.
Solana Price Forecast: $200 Rebound Still in Play?
Solana price is currently trading at $145, at the time of writing on May 8. However, with investors pulling over $490 million worth of SOL from the short-term market supply in May 2024, the sell-pressure could ease up considerably, keep Solana price above the $140 level in the days ahead.
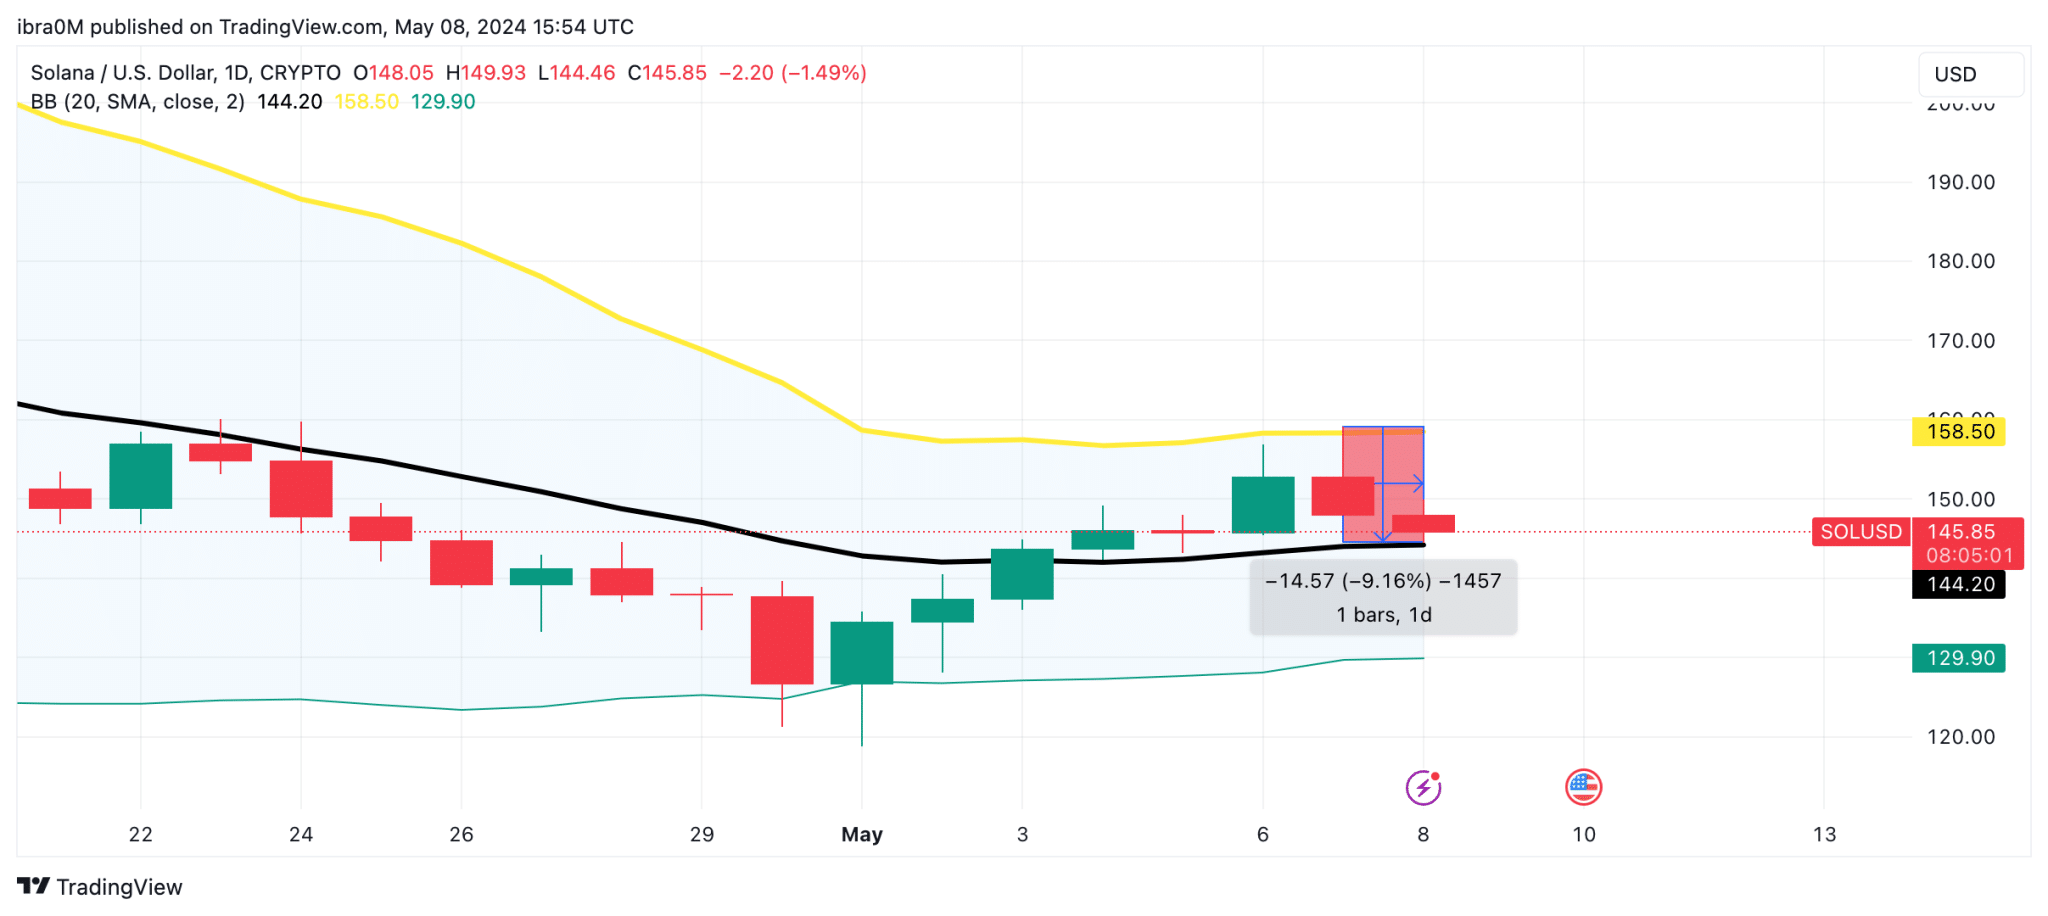
More so, the Bollinger Band technical indicator affirms that Solana’s price looks more likely to break out towards $200 than to lose the $120 support.
Solana SOL Price Forecast
As seen above, despite the 9% correction Solana price is current hanging above the 20-day SMA price mark at $144. If SOL price can avoid a breakdown below that vital support territory, the bulls could regroup for an audacious attempt at the $200 milestone as May 2024 unfolds.
On the contrary, in the event of a prolonged bearish market downswing, Solana’s price could find steady support around the $130 support cluster as depicted by the lower-limit Bollinger band.
Despite the recent market downturn, multiple entities have projected timelines for a potential Cardano rally towards lofty targets like $7.5, $27, and $45.
Following the ongoing market bloodbath, Cardano (ADA) has registered a daily loss of 2.6%. It soared to almost $0.8 in early March and currently trades at $0.4382.
This suggests that the price of Cardano has plummeted by 45.22% over the past two months. Similarly, Cardano has also fallen by 27.75% on the monthly chart.
Experts Still Confident in Cardano Price Recovery Despite Downturn
Despite Cardano’s recent bearish performance, crypto market watchers are confident that the asset has the potential to embark on a significant price recovery.
Consequently, these analysts have issued potential timelines for the coin’s ascent to jaw-dropping targets, like $7.5, $27, and $45.
Potential Timelines for Cardano Surge to $7.5
In the hours leading up to press time, Cardano was changing hands at $0.4382. ADA’s potential surge to $7.5 requires the asset to soar 1,611% from the current price.
While this seems challenging, prominent analyst Jake Gagain believes Cardano can achieve the feat. Interestingly, the top crypto influencer speculated that Cardano could hit the $7.5 price target by 2025.
According to Gagain, next year will usher in the peak of this season’s bull run, when the prices of various crypto assets are expected to skyrocket tremendously. Gagain noted that Cardano will not be exempt from the bull run, as he expects the asset to hit $7.5 by then.
When Will Cardano Hit $27?
According to an analysis by The Crypto Basic, the price of ADA could soar to $27 in this season’s bull run. This scenario will play out if Cardano replicates its post-halving performance in 2020.
Notably, Cardano, which was around $0.05 during the 2020 halving, spiked to an ATH of $3.10 in 2021. This represents a massive surge of 6,100%. Should Cardano replicate the same performance this season, The Crypto Basic projected that its price, which was around $0.44 at the time, could increase to $27.
Potential Timeline For Cardano Rally to $45
Furthermore, two popular prediction platforms, Telegaon and Changelly, expect Cardano to surpass the $7.5 and $27 price levels and aim for $45. For Cardano to hit $45, the asset must rally 10,169% from its current price level.
Despite how difficult it might seem for Cardano to reach the $45 target, Telegaon and Changelly sees the asset to hit the level by 2030 and 2033, respectively.
Cardano would need more than a bullish market to hit the $7.5, $27, and $45 targets. Interestingly, the Cardano ecosystem’s development team constantly releases significant upgrades that could pave the way for an imminent rally toward these targets.
For instance, the development team is preparing to roll out the highly anticipated Chang hard fork this quarter. The upgrade will help Cardano become more decentralized and self-sustaining, allowing ADA holders to determine the ecosystem’s happenings.
With the crypto market gearing up for its bullish phase, Cardano enthusiasts eagerly anticipate what the market has in store for their favorite crypto asset.
CryptoQuant CEO suggests Bitcoin could sustain a $265,000 price, backed by network fundamentals that support three times its previous cyclical top.
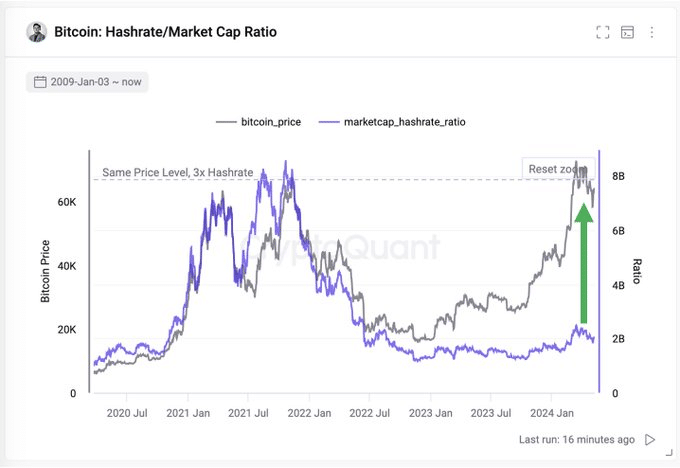
A recent analysis by Ki Young Ju, founder & CEO of CryptoQuant, compares Bitcoin’s price and the associated hash rate/market cap ratio, highlighting the crypto’s ongoing volatility and the resilience of its network. The market analyst believes Bitcoin has the potential to sustain a price of $265K.
#Bitcoin network fundamentals could support a market cap three times its current size compared to the last cyclical top, potentially sustaining a price of $265K. pic.twitter.com/GnsrSIrtuY
According to the accompanying chart, Bitcoin’s price, represented by a gray line, has shown significant volatility from July 2020 through early 2024. After a sharp increase to about $60,000 by April 2021, the price experienced a series of declines and recoveries.
Bitcoin Hashrate Market Cap Ratio | CryptoQuant
As of early 2024, Bitcoin’s price once again approached these previous highs, suggesting a possible resurgence in investor interest and market activity.
Parallel to the price fluctuations, the hashrate/market cap ratio, depicted in purple, has shown a noteworthy increase. This ratio, which assesses the growth of mining activity relative to the market capitalization, began at a low point in early 2020 but climbed steeply alongside the rise in Bitcoin’s price until early 2021.
The sustained or rising hashrate during periods of price stabilization or decline indicates a growing miner commitment.
An annotated horizontal line indicates that at the same price level as in previous cycles, the Bitcoin network now supports three times the hashrate, implying greater network security and miner investment. As of January 2024, both the price and the hashrate-to-market cap ratio are at a high point.
Shifts in Bitcoin Mining Operations
This review comes at a crucial time as major crypto mining companies like Hut 8 report significant operational changes.
Hut 8, a major North American crypto mining firm, experienced a 36% reduction in Bitcoin production in April due to the relocation of over 25,000 mining machines. Despite this temporary drop, the strategic relocation suggests a long-term vision for optimizing mining operations.
Furthermore, Marathon Digital Holdings, another key player in the sector, is expanding its operations to Kenya. According to a local report, Marathon has begun consultations with the National Treasury and Ministry of Energy to discuss the energy requirements for cryptocurrency mining.
The Technical End
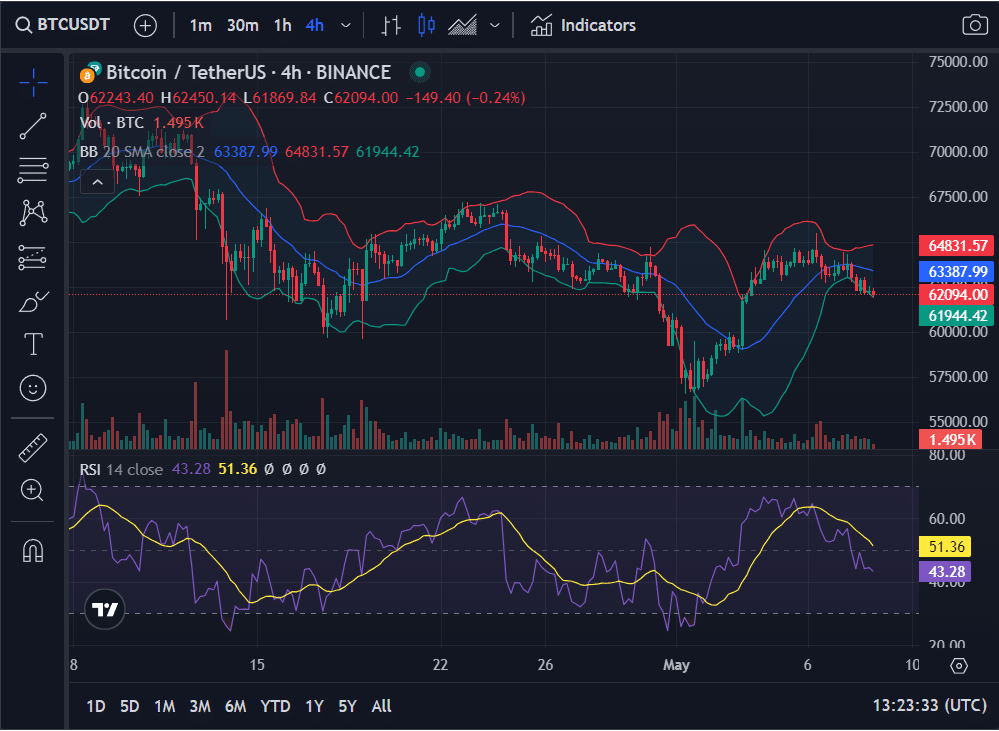
On the technical end, the current market analysis shows Bitcoin trading at around $62,150 with a 24-hour trading volume significantly impacting its market cap.
Bitcoin 4H Chart
Technical indicators like the Bollinger Bands and Relative Strength Index on the trading charts suggest moderate volatility with potential for future price movements. The trading patterns observed indicate that while the market faces certain resistance levels, there is potential for recovery as seen in past fluctuations.
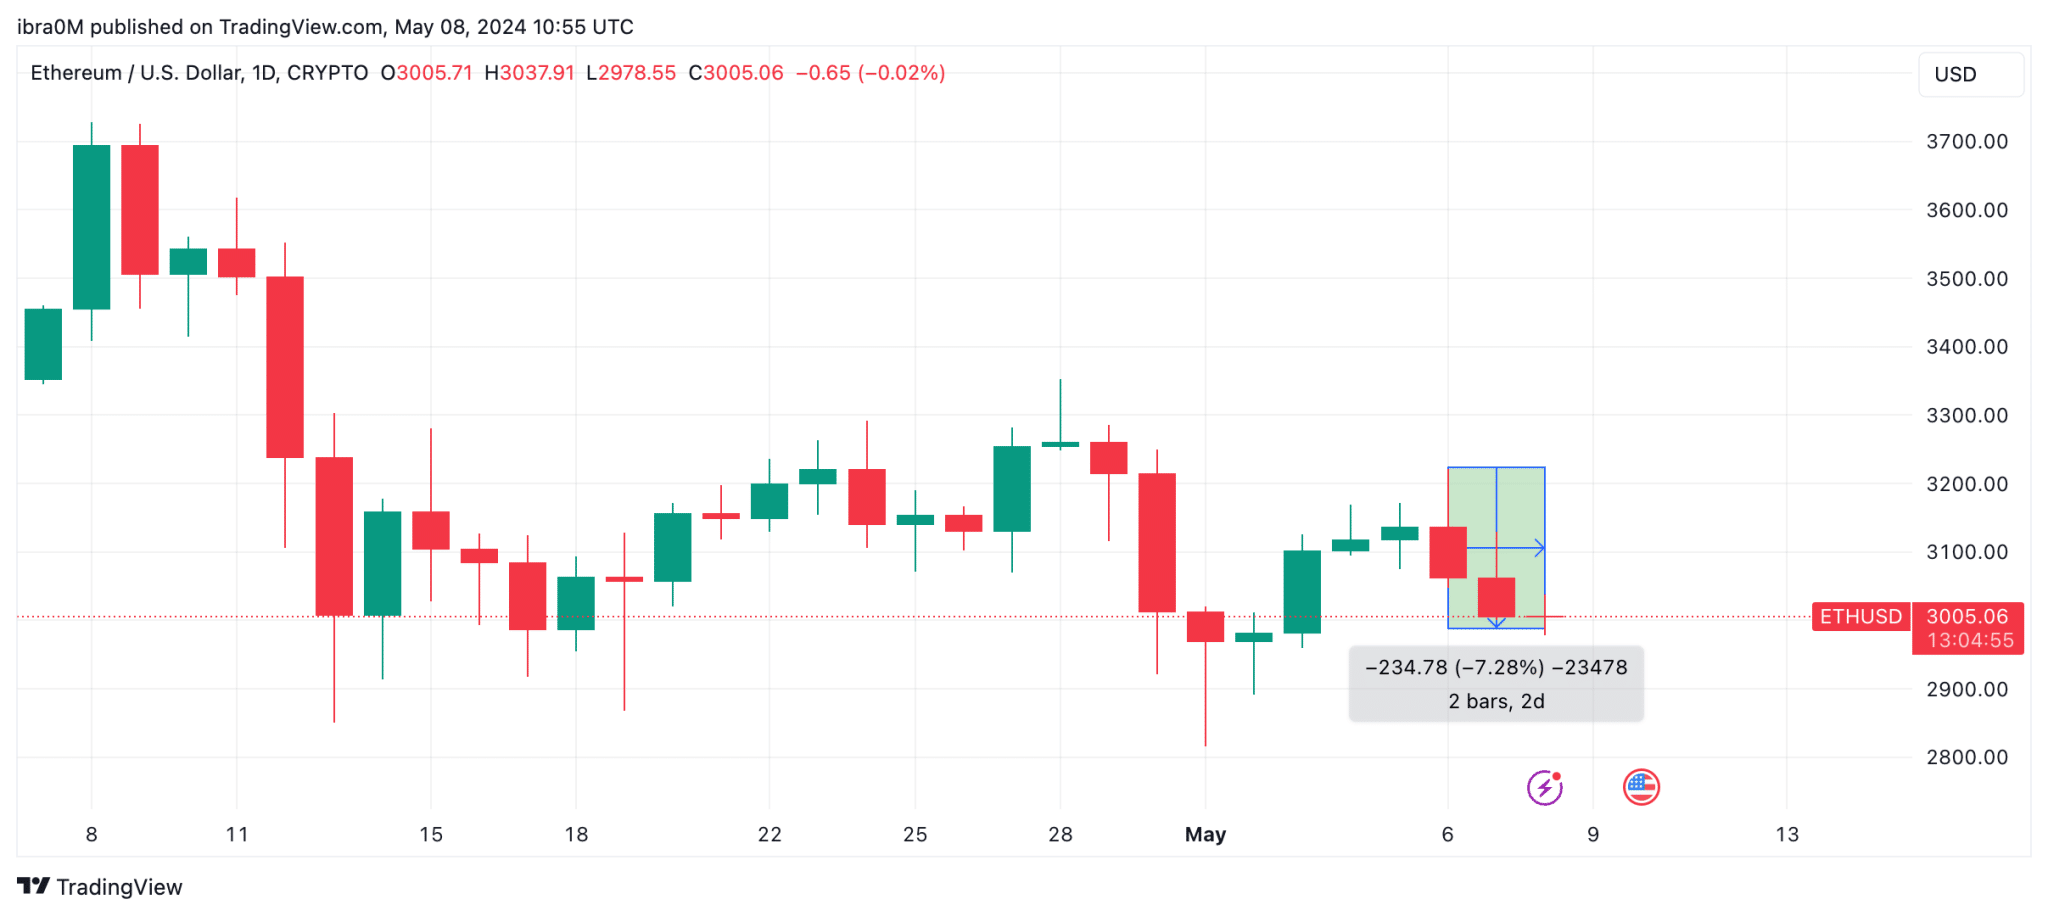
Ethereum price has slid 7% in the last 48 hours, breaking below the $3,000 mark on Wednesday, May 8, amid intense speculations surrounding ETH ETF speculations. However, spikes in ETH network usage suggest a major rebound phase lies ahead.
Grayscale Pulls Ethereum Futures ETF Application
On May 7, Grayscale, the world’s largest cryptocurrency asset manager announced the decision to withdraw its application for Ethereum futures ETFs ahead of SEC decision.
Ethereum Price Action After Grayscale Pulls ETH ETF Application
Grayscale’s decision to withdraw ETH Futures ETF application now adds a layer of uncertainty to the prospects of SEC approving spot Ethereum ETFs this year.
The news appears to have impacted Ethereum price negatively. At the time of publication on May 8, ETH price has dipped below $2,900 decoupling from the upward trend in the broader altcoin markets.
Ethereum Users Launch 100,000 New Contracts in May 2024
Grayscale’s withdrawal of the ETH futures application has evidently dampened Ethereum market demand this week, putting downward pressure on price. However, a closer look at the on-chain data shows that Ethereum has not experienced a major deterioration in its fundamental network usage metrics.
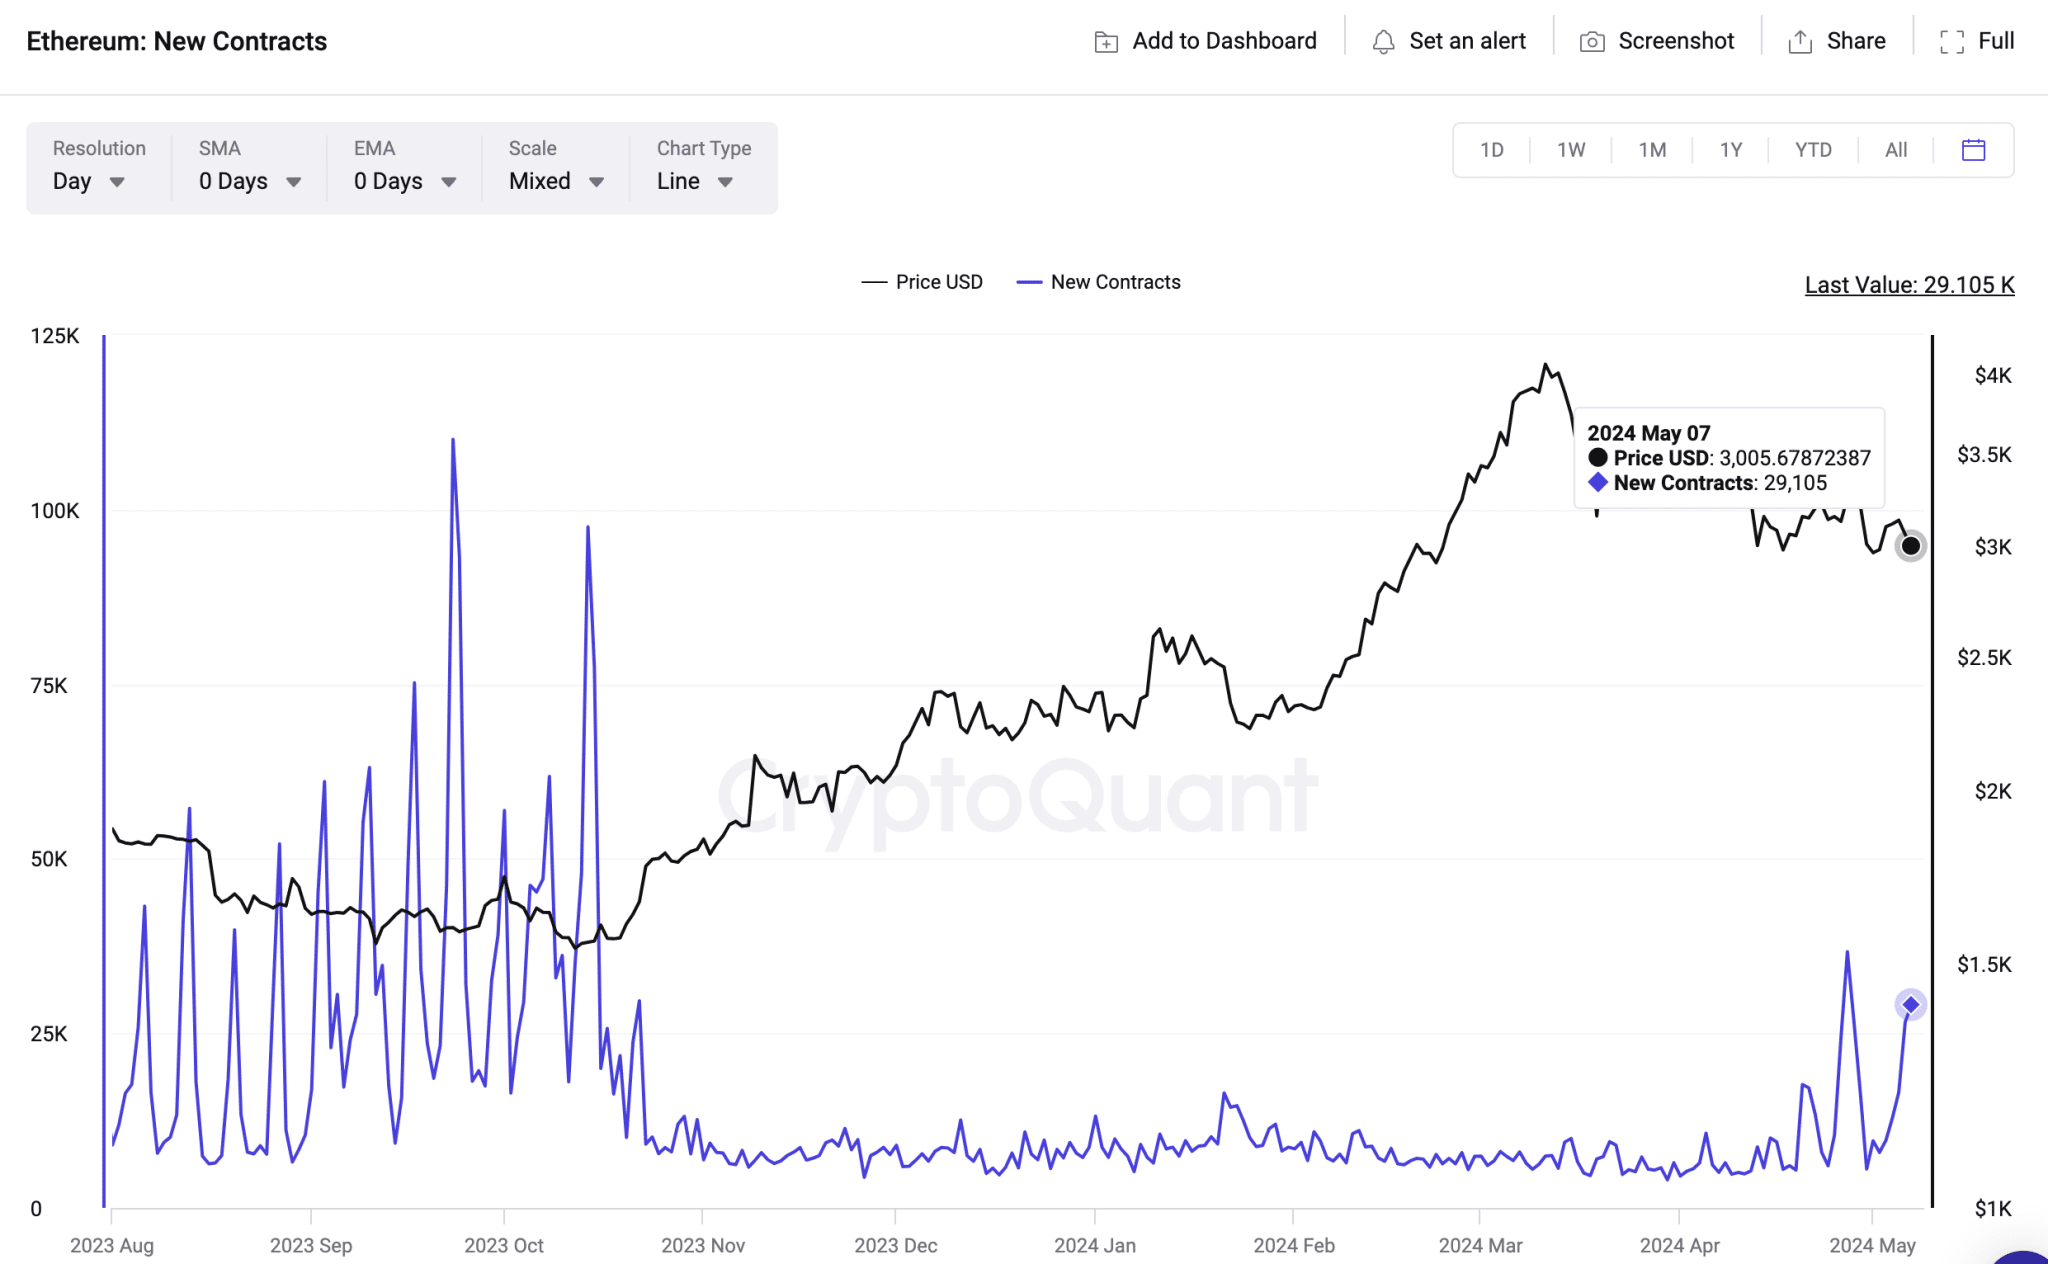
CryptoQuant’s chart below represents the daily number of new smart contracts created on the Ethereum blockchain network. An increase in new contracts signals rising demand for ETH block space, which often triggers increased burn rate and upward price swings, and vice versa.
Ethereum New Contracts vs ETH Price
As seen in the chart above, the Ethereum network has experienced a persistent increase in new smart contracts since the start of May. The latest peak data shows 29,105 new ETH contracts were created on May 7, bringing the total for the month above the 100,000 mark.
Historical data shows that in October 2023, ETH daily new contracts consistently exceeded the 25,000 mark. Within weeks, the Ethereum price entered a remarkable rally that saw it gain over 55% before the end of the year.
This historical precedent lends credence to the bullish stance that the ETH price could benefit from the ongoing spikes in new smart contracts once the FUD surrounding Grayscale ETH ETF application withdrawal cools.
ETH Price Forecast: $4k Rebound Still in Sight?
At the time of writing on May 7, the Ethereum price was struggling to hold above $3,000 support. But, drawing insights from the over 100,000 new Ethereum smart contracts created in May, the ETH price looks set to make an early rebound towards $4,000.
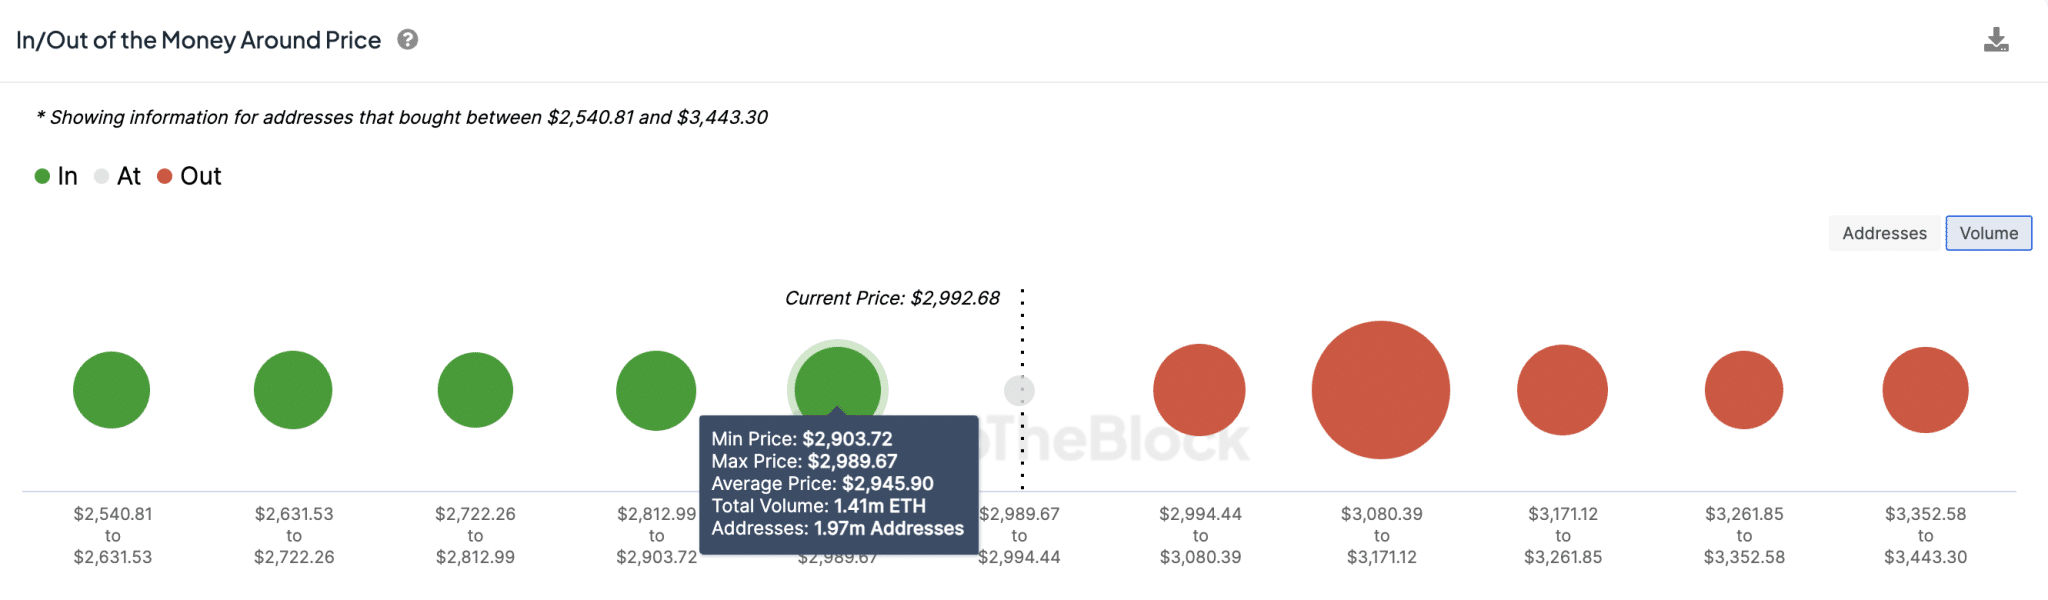
IntoTheBlock’s global in/out of money chart groups all existing ETH holders by their entry prices. As seen in the chart below, a large cluster of 1.97 active addresses acquired 1.41 million ETH at a minimum price of $2,903.
In the near term, Ethereum’s price could avoid a reversal below $2,900 if investors in that cluster opt to defend their positions.
Ethereum ETH Price Forecast
On the flip side, the spikes in new contracts trigger a surge in Ethereum market demand, as observed in October 2023. If this scenario plays out, the ETH price could enter a parabolic breakout at $4,000 as May 2024 unfolds.
Shiba Inu partner K9 Finance DAO has released an exclusive product update concerning its upcoming liquid staking dApp, Bone Crusher.
The K9 Finance team shared the update via their official X handle, presenting a video that demonstrates how the Shiba Inu Army may interact with the application and earn. The team noted that this video marks the inaugural product update visual aimed at community members.
⚙️Exclusive Product Update⚙️$BONE Crusher is our core product allowing #SHIBARMY supporters to delegate & earn from our validator(s) system
How Shiba Inu Army Will Interact with Bone Crusher
In the post, K9 Finance stressed that Bone Crusher is their flagship offering. It seeks to enable the SHIB Army to delegate and gain rewards through the K9 Finance validator system.
As previously announced, the project’s team plans to launch the Bone Crusher dApp before the end of the year. Leading up to its release, K9 Finance’s video provided a tutorial for users on how to navigate the dApp.
To begin using the Bone Crusher dApp, users must tap the “connect wallet” button in the upper right corner of the screen. This action prompts them to consent to the required terms and conditions of the wallet connection.
They can then select a wallet from the options such as MetaMask or Wallet Connect to identify other compatible wallets. Once the users have chosen their preferred wallet, they are to follow other prompts that appear to link it with the K9 liquid staking platform.
After successfully establishing the connection, from the “Stake” section, users can enter the desired amount of BONE tokens to stake and proceed with the transaction.
The process of unstaking the locked asset is also seamless. The “unstake” button is right beside the “stake.” Upon clicking unstake, users will withdraw knBONE tokens.
Meanwhile, the withdrawal request takes up to four days to process. After this timeline, participants can collect their knBONE rewards in BONE or KNINE tokens through the “Claim” section.
Bone Crusher to Boost Shibarium TVL
Notably, Bone Crusher will debut on the Shibarium mainnet in Q3 2024, after the dApp’s successful trial by the end of this quarter. The second version of Bone Crusher is slated for release in Q4 2024.
In this latest update, the K9 Finance team has emphasized that liquid staking will be crucial in Shibarium’s future. In particular, the dApp aligns with its DAO mission to integrate DeFi capabilities within the Shiba Inu ecosystem. Essentially, this upcoming dApp is expected to substantially increase Shibarium’s total value locked (TVL), which is currently at $2.314 million, per the latest record.
The XRP price may have finally bottomed against Bitcoin (BTC), according to market veteran Tony Severino, with a possible price reversal on the horizon.
While Bitcoin has witnessed an uptrend since December 2022, XRP has continued to exhibit choppy price movements within this same timeframe, leading to a persistent underperformance against the premier cryptocurrency.
XRP Price Records Declines Against Bitcoin
At its current price above $62,000, Bitcoin is up 261% since December 2022. However, XRP has only seen a mild 27.8% increase within the same timeframe. Some industry commentators have attributed this underperformance to the legal tussle between Ripple and the SEC.
XRP price looked to record a solo breakout in July 2023 on the back of the legal clarity in the United States. However, after a spike to $0.93, which resulted in a high of 0.00002970 BTC, XRP faced a retracement, with its price eventually tumbling to the $0.4225 low in August 2023.
Amid the retracement, Bitcoin embarked on the pre-bull phase rally from Q4 2023, resulting in a sustained downtrend on the XRP/BTC monthly chart, as BTC continued to outperform XRP every month. XRP has now recorded nine consecutive months of losses against BTC since August 2023.
A Possible Bottoming
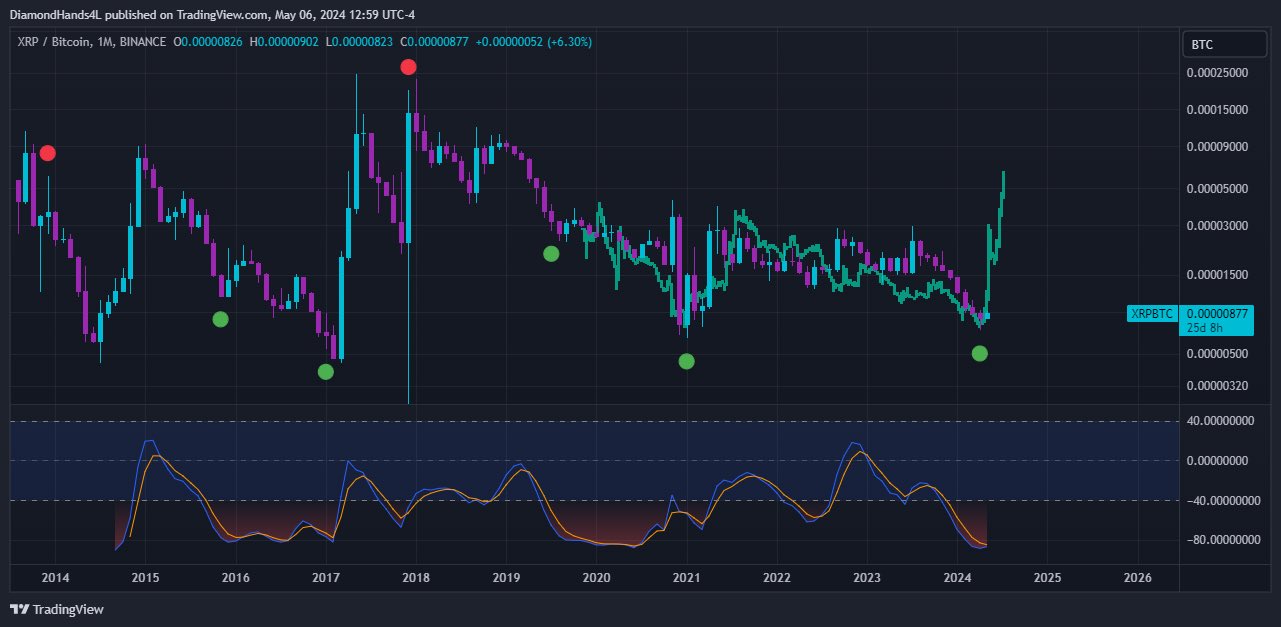
Within this period, XRP has dropped 64.8% in comparison to Bitcoin, currently trading for 0.00000839 BTC. Market veteran Tony “The Bull” Severino recently confirmed that XRP might have seen a floor. He noted that a bottom signal has been flashed by XRP against Bitcoin on the monthly timeframe.
— Tony "The Bull" Severino, CMT (@tonythebullBTC) May 6, 2024
Such a signal suggests that the persistent declines could be coming to an end, with a trend reversal imminent. This has compounded optimism surrounding XRP’s price movements.
Market watchers have often called attention to similar trends observed with XRP during the 2017 market cycle. Notably, XRP witnessed a similar bearish performance against Bitcoin and the broader market in 2017. However, after hitting the bottom in February 2017, XRP outperformed BTC by 3,716% in a year.
XRP Price Targets $6.48
This 2017 performance has bolstered confidence in an imminent XRP price upswing, especially since it has formed the much-anticipated bottom. Analyst Charting Guy sets a fractal target of 0.00006486 BTC per XRP when a rally ensues. At Bitcoin’s current price, this would bring XRP to a value of $4.09.
However, the analyst, like most crypto market veterans, does not expect Bitcoin to remain stagnant. According to him, if Bitcoin clinches some of the targets for the current bull run, essentially reaching $85,000 to $100,000, XRP’s price will hit $5.51 to $6.48 if it skyrockets to 0.00006486 BTC after this bottom.
Meanwhile, XRP currently trades for $0.5213, looking to recoup the 20.44% loss of the previous month in the short term. To realize this goal, XRP would need to scale above multiple resistance levels, with one of the most pivotal ones stationed at $0.5582 (Fibonacci 0.5). A push above this would bring XRP face to face with $0.5916, which serves as the gateway to $0.60.