Home Blog Page 156

Legendary Investor Turns $31K Bet on Asteroid Shiba into $301K: Details

0

An unidentified crypto trader has transformed a modest bet on Asteroid Shiba (ASTEROID) into a substantial gain after enduring more than a year of losses.

In the fast-paced cryptocurrency market, where participants often pursue quick profits, the activity of wallet ‘0x2aff’ presents a stark contrast.

According to Lookonchain, the trader made a high-risk move in late 2024 by accumulating billions of ASTEROID tokens. Although the position initially deteriorated, it has since surged sharply following an extended holding period.

Key Points

  • An unidentified trader transformed a $31,000 ASTEROID investment into over $300,000 after enduring a prolonged drawdown.
  • The trader initially deployed 12 Ethereum to acquire 4.61 billion ASTEROID tokens in September 2024.
  • The position stayed underwater for more than 570 days before rebounding to approximately $301,939.
  • Despite the sharp recovery, the trader has not sold, raising questions about whether they are aware of the surge.

Details of the Trade

On September 22, 2024, the trader deployed 12 ETH tokens (approximately $31,000) to acquire 4.61 billion ASTEROID tokens.

Subsequently, the value of the holdings declined steeply in the weeks after the purchase, at one point nearing total loss. The position remained underwater for more than 570 days, underscoring the prolonged downside typical of speculative tokens.

However, market momentum eventually reversed. The ASTEROID holdings rebounded significantly, with their value climbing to roughly $292,000, according to Lookonchain.

At press time, the position has increased further to about $301,939, with each token trading near $0.00006553. Meanwhile, the wallet has remained inactive for over nine months.

This has raised questions about whether the trader is even aware that the once-depleted investment has recovered so dramatically.

Notably, while ASTEROID ranks as the largest asset in the trader’s portfolio, the address currently holds other notable tokens, including BNB, Tether, and Ethereum.

0x2aff Crypto Portfolio

What Fueled the Major Turnaround

Notably, the major rebound in the trader’s portfolio follows the ongoing rebound in the crypto market. Today, Bitcoin’s price reached $78,000, its highest price since February, amid easing geopolitical tension. Several altcoins are already capitalizing on Bitcoin’s rebound, reclaiming new monthly highs.
Bullish Heikin Ashi Candles Have Emerged on XRP Weekly Chart

Technical signals continue to draw attention to XRP, with analysts pointing to a shift in momentum after months of uneven price action.

CryptoQuant-verified analyst CW has identified the appearance of bullish candles on XRP’s weekly chart, suggesting that the market could be entering a new phase dominated by green candles.

Notably, XRP has been in a bear market for the last nine months, during which its price has dipped by over 60% from $3.66.

Key Points

  • CryptoQuant analyst CW spots bullish weekly Heikin Ashi candles on XRP, signaling momentum shift after bear market.
  • Heikin Ashi shows green weekly candles as XRP gains 10%, hitting a four-week high of $1.50.
  • CW calls current XRP setup a “starting line”, hinting trend continuation if history repeats and macro eases.
  • Bitcoin hits $78K as XRP leads the majors, with analysts eyeing a $5 target.

Heikin Ashi Signals Turning Point

According to CW, the emergence of green candles on the Heikin Ashi chart is a key development. This charting method, used to filter out market noise, is widely followed for spotting trend reversals more clearly than standard candlesticks.

The latest formation shows a transition from red to green candles on the 1-week timeframe. Notably, this green candle emerges as XRP posts a 10% gain over the past week. The coin is trading at $1.50, its highest price in four weeks.

This ongoing price rebound has helped improve XRP’s weekly and monthly structure, turning it positive.

CW's chart on X
CW’s chart on X

“Starting Line” for a New Move

Meanwhile, CW described the current setup as a “starting line,” suggesting the asset may be just beginning its upward move rather than nearing its end.

The chart highlights two key zones where XRP previously reacted to the trendline before rallying. The latest touchpoint mirrors the earlier moment, adding weight to the idea that history could repeat itself.

If this pattern holds, XRP’s price could be positioning for a sustained move higher as overall market conditions improve, supported by easing tensions in the Middle East, which previously dampened investor sentiment.

Market Context

Notably, Bitcoin’s price hit $78,000 today for the first time since February. Other crypto assets like Ethereum, BNB, and Solana are posting impressive price action today. However, XRP is currently leading among majors with over 10% weekly gains at press time.

XRP Price Targets to Watch

With improving market conditions, some analysts are calling for a run to a new all-time high. As The Crypto Basic reported earlier today, one analyst projects a possible move toward $5 if momentum builds, citing repeating fractal patterns seen in previous XRP cycles.

Meanwhile, a more aggressive price outlook has emerged from trader CryptoCupra, who argues the setup could lead to a breakout similar to 2017. In particular, he calls for an XRP price as high as $32 within 90 days.

However, the prediction is highly debated, with critics noting that similar “2017 fractal” calls have repeatedly failed to materialize.

At current prices, a move to $32 would require over 2,000% upside and a market cap exceeding $1.9 trillion, making it a highly ambitious scenario.

What Bitcoin Whales Holding 100+ BTC Did as Bitcoin Crossed $78,000

0

Bitcoin whales are selling into the market strength, raising questions about whether the premier asset will sustain its recent price resurgence.

At the time of writing, Bitcoin (BTC) has crossed $78,000, building its newfound momentum. However, the sustainability of this move has come into question, following a recent disclosure of the on-chain activities of large holders.

Key Points

  • At the time of writing, Bitcoin has crossed $78,000, building its newfound momentum.
  • Data shows that whales holding at least 100 BTC have ramped up inflows into exchanges, suggesting they are taking profits.
  • Such selling activities have not been this notable in several weeks and could impact the sustainability of this recovery move.
  • The Bitcoin rebound has also sparked a broader market move, with Ethereum rallying 6.3% to $2,447 and XRP by 6.5% to $1.49.
  • Analysts expect further upside for Bitcoin in the near term.

Bitcoin Whales Move Stash to Exchanges Amid Rebound

J. A. Maartunn, a prominent analyst and CryptoQuant’s verified author, highlighted an increase in exchange inflows as Bitcoin’s price rose. He noted that whales holding at least 100 BTC have ramped up inflows into trading platforms following the price resurgence, suggesting they are taking profits.

The analyst used the Bitcoin Exchange Inflow for Spent Output Value Band for all exchanges to identify this trend. According to the shared chart, a notable spike was seen among holders with 100 to 1,000 BTC, marked in yellow.

Bitcoin Exchange Inflow by Value Band/CryptoQuant

While a similar spike was seen with holders holding 1,000 to 10,000 BTC, those with 100 to 1,000 BTC made a more significant move. Notably, while movement to exchanges does not translate into sales, it adds renewed pressure on the asset’s price and dampens market sentiment.

Maartunn highlighted that such selling activities have not been this notable in several weeks. According to him, this activity weighs on the market and could impact the sustainability of this recovery move.

Bitcoin Blows Past $78,000 Regardless

However, BTC has continued to show strength despite these potential sell-offs. At press time, it has reached an intraday high of $78,120, a price level last seen on February 6. While its continuity remains a concern if such selling activity continues, its response so far signals strong market momentum.

The Bitcoin rebound has also sparked a broader market move, with Ethereum rallying 6.3% to $2,447 and XRP by 6.5% to $1.49. In general, the broader market has rebounded by 4.9% in the past 24 hours to $2.64 trillion.

Meanwhile, analysts expect further upside for Bitcoin in the near term. The Crypto Basic reported that BTC could reach $80,000 to $85,000 before the end of April. The move, however, depends on a continued show of strength as seen recently, even in the face of building selling pressure.

The BCMI Shows Bitcoin May Be Near a Historical Pivot Zone

0

The BCMI indicates that Bitcoin may now be close to a region that often translates to deep undervaluation.

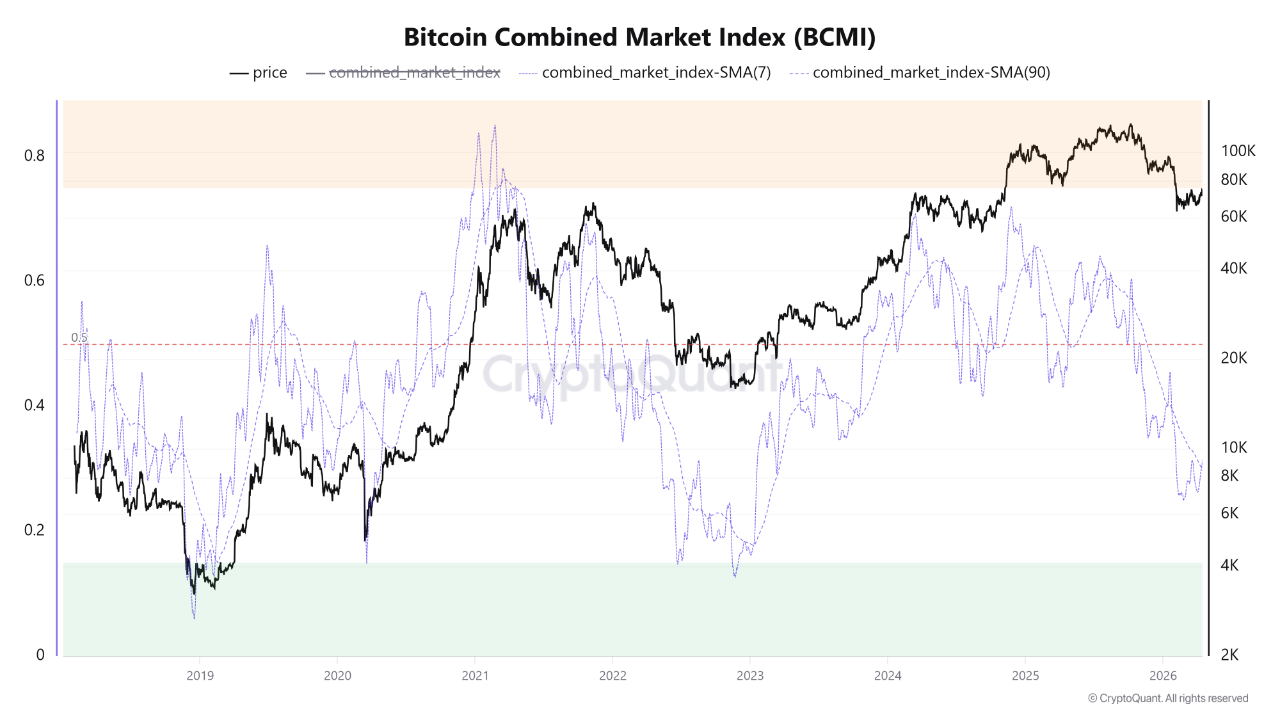
Bitcoin has rebounded from its April 12 low of $70,500 to trade at $77,982, marking a 10% recovery. Amid the recent price action, Woominkyu, a verified analyst at CryptoQuant, pointed out that the Bitcoin Combined Market Index (BCMI) shows Bitcoin may be testing a historical pivot zone. 

Key Points

  • The BCMI suggests Bitcoin may be retesting a historical pivot zone.
  • This index sits between 0.2 and 0.3, placing Bitcoin within a historically undervalued range.
  • The SMA(90) is still trending downward, and only a flattening would confirm that selling pressure has eased.
  • Bitcoin sees derivatives conditions that historically led to upward moves in over 80% of cases.

BCMI Shows Bitcoin Undervaluation

Woominkyu noted that the BCMI combines MVRV, NUPL, SOPR, and Fear & Greed indicators into a single reading. This makes it easier to understand overall market conditions, including profitability and sentiment. In general, higher values suggest the market may be overheating, while lower levels indicate undervaluation.

According to the analyst, the BCMI has dropped into the 0.2 to 0.3 range. Chart data places it at exactly 0.33. Earlier, on April 12, the index stood at 0.2969 when Bitcoin corrected to $70,500. While prices have since recovered, the index has only moved up gradually to 0.33.

Bitcoin Combined Market Index BCMI CryptoQuant
Bitcoin Combined Market Index BCMI | CryptoQuant

Woominkyu stressed that at the current position, Bitcoin is still within a zone that has historically been seen as undervalued. However, he clarified that this does not guarantee a quick V-shaped recovery, but it does indicate a level where Bitcoin has often found strong value.

Market Value and Sentiment at 2023 Levels

In addition, he stressed that the current figures involving the individual data points for the NUPL (25%) and the MVRV ratio (30%) show that the recent correction has reset market value and investor sentiment to levels last seen in early 2023.

At the moment, the MVRV ratio sits at 1.38, which suggests the market is in a healthy growth phase rather than being overvalued. The NUPL stands at 0.24, showing that investors are still holding moderate unrealized profits. 

However, Woominkyu also pointed out that the SMA(90) line is still trending downward. He explained that this trend needs to flatten before traders can say that selling pressure has fully eased.

Where Next for Bitcoin?

Considering these signals, Woominkyu believes Bitcoin is entering what he calls a value-accumulation zone. In this phase, the downside risk appears to be more limited compared to the long-term upside. 

However, he advised that traders remain cautious and wait for clearer signs of price stability before confirming that the market has reached a bottom.

Elsewhere, Michaël van de Poppe observed that Bitcoin funding rates have turned negative, while most options traders are holding put positions. 

Bitcoin Funding Rate Glassnode
Bitcoin Funding Rate | Glassnode

According to him, similar situations have happened before and, in more than 80% of those cases, the market moved upward afterward. These moves often led to a wave of short liquidations.

He also pointed out that Bitcoin is currently facing a resistance zone that many traders expect to hold and push prices lower. As a result, most traders are preparing for further downside. 

However, this kind of one-sided expectation can sometimes lead to the opposite outcome. According to van de Poppe, when markets like the Nasdaq move higher, Bitcoin typically follows with stronger moves, and the current situation may not be different.

XRP Funding Rates Mimicking Conditions That Preceded the July 2025 Rally to $3.6

0

The XRP funding rates throughout this year may be mimicking conditions that previously led to the explosive rally in July 2025.

XRP has begun to recover along with the broader crypto market, rising by more than 7% over the past week and now trading at $1.44. Amid this move, data shows an interesting pattern involving the asset’s funding rates on Binance. 

Key Points

  • The current XRP derivatives market conditions resemble patterns that led to a previous surge in 2025.
  • Funding rates on Binance have mostly stayed below -0.005 since January 2026.
  • A similar setup in 2025 saw funding rates drop to -0.03 on April 4 as the price fell below $2.
  • XRP eventually surged to $3.6, with funding rates turning positive during the price recovery.

Persistent Negative XRP Funding Rates Show Bearish Bias

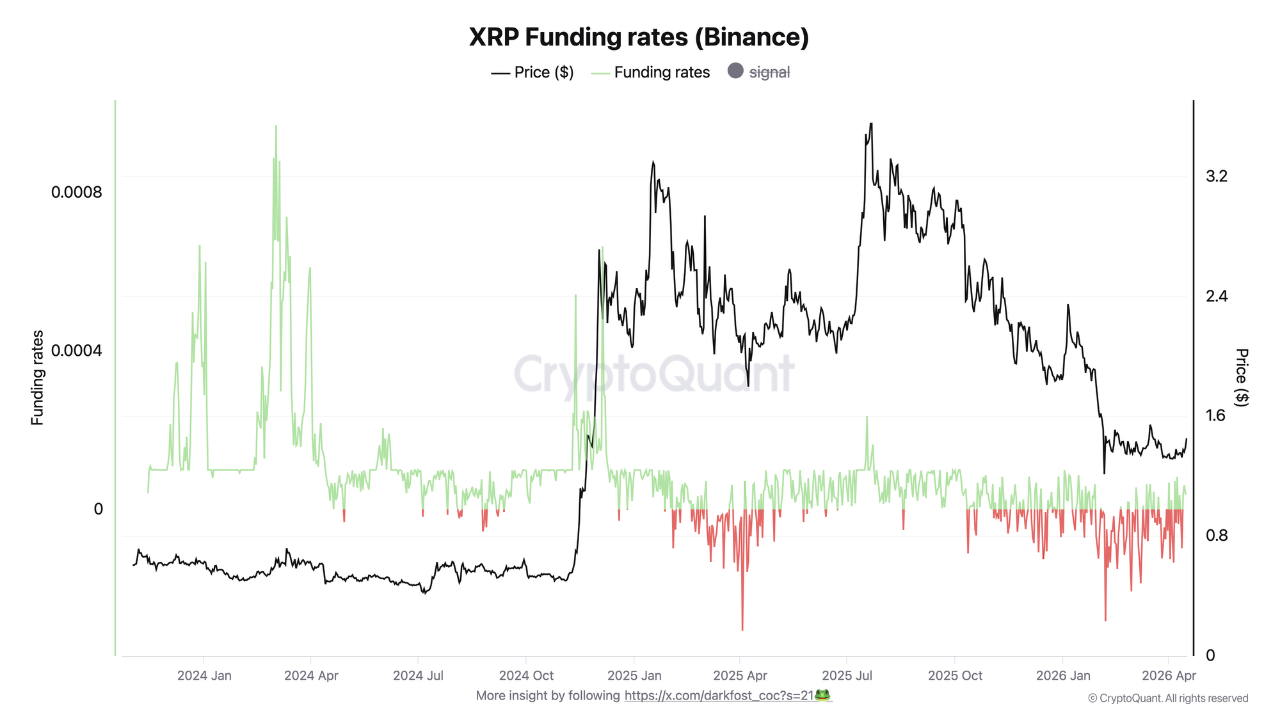
This is according to a recent analysis by verified CryptoQuant contributor Darkfost. The analyst pointed out that current funding patterns resemble those seen before XRP climbed to its $3.6 all-time high in July 2025, which involved an impressive 127% price increase.

Notably, since the start of 2026, XRP funding rates on Binance have mostly stayed in negative territory. Data from the CryptoQuant chart shows that rates have remained below -0.005 since January 2026, with occasional deeper drops. 

XRP Funding Rates on Binance CryptoQuant
XRP Funding Rates on Binance | CryptoQuant

In a specific instance on Feb. 6, funding rates fell to -0.0283, the lowest level this year, as XRP’s price dropped to $1.1 that same day. Before this, the last time rates reached similar levels was in early April 2025, during another sharp price decline. 

Although funding rates have recently turned slightly positive as XRP moved back above $1.40, the overall trend this year shows that traders on Binance have mostly taken a bearish stance. According to Darkfost, this now appears close to becoming a broad market consensus.

Market Sentiment Reaches Extreme Consensus Levels

Darkfost explained that when most traders take the same position, it creates a market imbalance. In many cases, this kind of agreement comes too late, after the trend has already played out, which can lead to a move in the opposite direction.

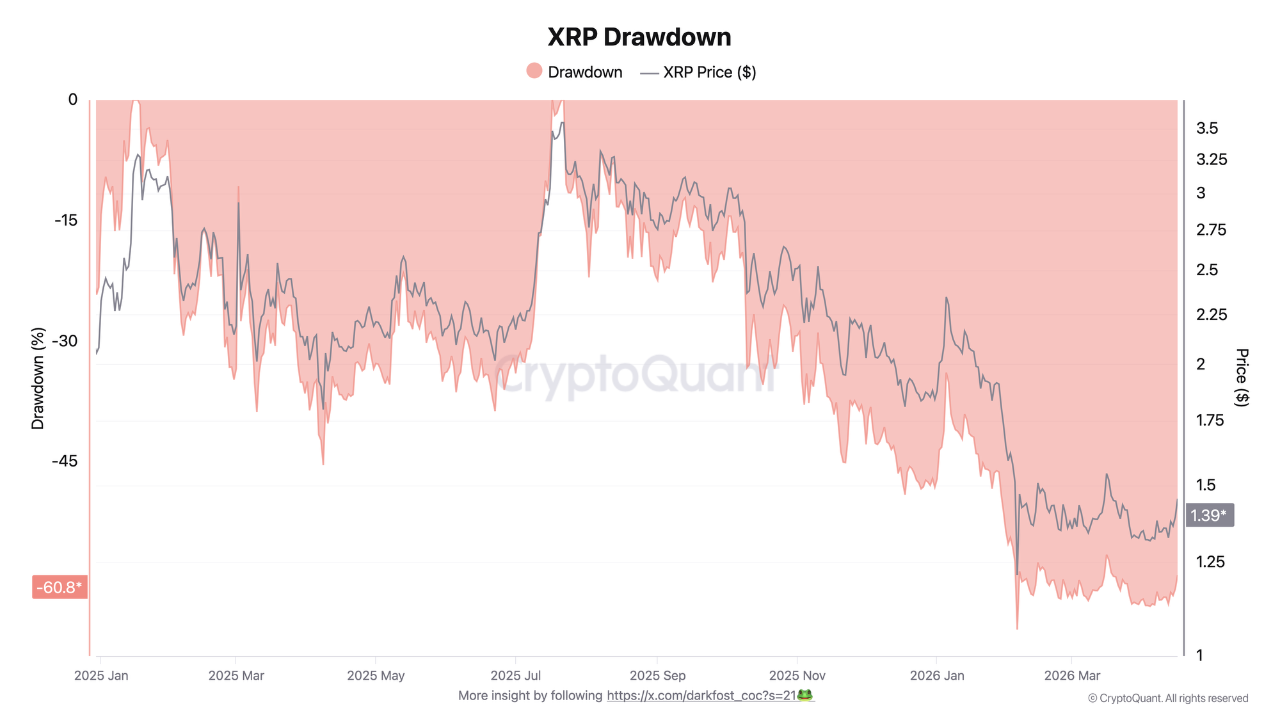
The analyst pointed out that XRP is still down over –60% from its July 2025 all-time high of $3.66, yet many traders continue to expect further declines instead of a recovery. In the past, similar extreme sentiment has not been a reliable signal to follow, as markets often move against the majority.

XRP Price Drawdown CryptoQuant
XRP Price Drawdown | CryptoQuant

According to Darkfost, the last time XRP saw this kind of condition, it was followed by a strong upward move. Specifically, the price rose from around $1.6 to $3.6, marking a gain of nearly 127%.

Despite this, the market analyst noted that the broader market remains challenging at press time, especially for altcoins. Because of this, traders still need to approach the market carefully despite the similarities to past bullish setups.

Historical Data Confirms Bullish XRP Position

Historical data confirms Darkfost’s theory. Notably, before the July 2025 rally to $3.6, XRP showed similar funding rate behavior. As the price fell from $3 in early March 2025, funding rates on Binance turned negative and stayed mostly below -0.003 for several weeks, showing that short positions dominated.

On April 4, 2025, funding rates dropped further to -0.03 as XRP’s price fell below $2, marking the lowest level in a year at that time. As the price began to recover later in April, funding rates started to turn positive again. During this period, XRP traded around the $2 level, while funding rates stayed slightly positive.

The upward move continued into late June and early July, eventually pushing XRP to $3.6 on July 21, 2025, with funding rates rising sharply alongside the price.

At present, funding rates are again improving as the price rises, similar to what happened in April 2025. If XRP were to see another 127% increase from its current price of $1.44, it would move past the $3 level and reach around $3.178.

Market Updates: France Moves to Curb Crypto “Wrench Attacks”; Meta-1 Scam Operator Receives 23-Year Jail Term; Tether Commits $150M to Drift Recovery

0

Latest Market Updates: As of 17th April 2026.

France Prepares Crackdown on Crypto Kidnappings

French authorities are stepping up efforts to protect cryptocurrency investors amid a sharp increase in violent, targeted attacks.

Speaking at Paris Blockchain Week, Jean-Didier Berger, minister delegate to the interior minister of France, said the government has already introduced preventive steps. Specifically, these include a dedicated platform to reduce so-called “wrench attacks,” in which criminals use force to access digital assets.

The initiative is already seeing strong uptake, with thousands of users reportedly signing up. Berger also confirmed ongoing coordination with Interior Minister Laurent Nuñez on a broader national security strategy, which is expected to be developed in the coming weeks.

The urgency behind these measures is reflected in recent figures. French outlet RTL reported 41 crypto-related kidnappings so far in 2026. This suggests an incident roughly every two and a half days.

Beyond France, the trend appears global. Cybersecurity firm CertiK recorded 72 verified wrench attacks in 2025, a 75% year-on-year increase. France led with 19 cases, while Europe accounted for about 40% of all incidents.

US Court Hands 23-Year Sentence in $20M Meta-1 Crypto Scam

In contrast, authorities in the United States are continuing to crack down on past abuses through the legal system.

Robert Dunlap has been sentenced to 23 years in prison by District Judge LaShonda Hunt, according to the Illinois US Attorney’s Office. Specifically, he was convicted on two counts of mail fraud linked to the Meta-1 Coin scheme.

Prosecutors said the operation ran from 2018 to 2023 and defrauded nearly 1,000 investors of approximately $20 million. Dunlap and associates promoted the token through a trust structure designed to attract investor funds.

To build legitimacy, the scheme allegedly promoted false claims of asset backing. These included a supposed $1 billion art portfolio featuring works by Vincent van Gogh and Pablo Picasso. It also claimed $44 billion in gold reserves.

Authorities added that Dunlap and his alleged associates used automated trading bots to manipulate the trading volume and price of Meta-1 Coin on a proprietary exchange he developed, known as the Meta Exchange.

Tether Commits $150M to Drift Protocol Recovery

Meanwhile, as regulators pursue enforcement, the crypto industry continues to grapple with the fallout from major security breaches.

In response to a $280 million exploit affecting Drift Protocol earlier this month, Tether has announced its support for a $150 million recovery initiative. The company will contribute $127.5 million, with the remaining funds expected to come from undisclosed partners.

Drift Protocol is set to play an active role in reimbursing affected users and is preparing to resume normal trading operations. This development signals a gradual recovery.

Additionally, as part of its relaunch strategy, the platform will transition its settlement asset from USDC (issued by Circle) to USDT. This shift aligns it more closely with Tether as its new backer.

Singapore Gulf Bank Introduces Enterprise Stablecoin Services

At the same time, institutional adoption of digital assets continues to advance.

Singapore Gulf Bank has launched a new stablecoin-focused service for corporate and high-net-worth clients. It enables continuous conversion between fiat currencies and digital tokens.

Initially, the service allows users to exchange US dollars for USDC on the Solana blockchain at a 1:1 ratio. This seeks to provide seamless, around-the-clock liquidity.

Looking ahead, the bank also plans to extend access to individual users by the end of Q2. In addition, it aims to broaden support to additional stablecoins, including USDT, in the future.

Market Updates: CoinGecko Reports 39% Drop in Q1 CEX Volumes, Arthur Hayes Discloses 90% Bitcoin Position, Key Researcher Josh Stark Exits Ethereum Foundation

0

Latest Market Updates: As of 17th April 2026.

CEX Volumes See 39% Decline in Q1

A fresh analysis from CoinGecko indicates that the cryptocurrency market has entered a sustained “crypto winter” in the first quarter of 2026, reversing much of the momentum seen in late 2025.

According to the report, total crypto market capitalization declined by more than 20% in Q1 2026. Trading activity also weakened sharply. Spot volumes across the top 10 centralized exchanges dropped to $2.7 trillion in Q1, down from $4.5 trillion in the previous quarter, a steep 39% decline.

Bitcoin reflected this broader weakness, falling 22% over the same period. This came despite having reached an all-time high of roughly $126,000 six months earlier.

Notably, Bitcoin underperformed traditional equity markets during the same period. The NASDAQ Composite declined 7.1%, while the S&P 500 fell 4.8%, marking their weakest quarterly performance since 2022.

CoinGecko links the broader risk-off environment to a combination of geopolitical and monetary policy pressures. Market sentiment was dampened following US–Israeli strikes on Iran in February 2026.

Meanwhile, expectations of tighter monetary policy, associated with the nomination of Kevin Warsh, further weighed on risk assets.

Hayes Discloses 90% Bitcoin Position While Eyeing Select Altcoins

Despite weakening market sentiment, some prominent investors remain heavily committed to Bitcoin.

In a recent conversation with Anthony Pompliano, Arthur Hayes disclosed that over 90% of his net worth remains allocated to Bitcoin. He attributed his continued exposure to a low cost basis, which allows him to remain largely inactive during periods of volatility.

However, Hayes also signaled selective interest in alternative opportunities, mentioning Zcash and Hyperliquid as areas he is watching more closely.

He added that he is not deploying new fiat capital into Bitcoin at current levels. Instead, he is waiting for what he describes as a major liquidity expansion event that could reshape broader market conditions.

Ethereum Foundation Loses Key Researcher Josh Stark

Meanwhile, notable personnel changes continue within the Ethereum ecosystem. Researcher Josh Stark has announced his departure from the Ethereum Foundation after five years.

Stark did not disclose specific reasons for leaving, stating only that he plans to take time off to focus on personal priorities. 

His exit follows structural changes introduced by Vitalik Buterin in 2025 to reshape the foundation’s leadership and long-term direction.

Notably, Stark’s departure comes just one day after contributor Trent Van Epps also stepped down. Together, these exits point to ongoing internal restructuring within one of the industry’s most influential organizations.

Zonda Exchange Faces Scrutiny Over Inaccessible Bitcoin Wallet

At the same time, operational risks have come into focus at the Zonda exchange, where a cold wallet containing approximately 4,500 Bitcoin has become inaccessible.

CEO Przemysław Kral addressed the issue publicly, stating that the wallet’s private keys were never transferred to the company. He also rejected allegations of fund misuse. 

Kral attributed responsibility to former CEO Sylwester Suszek, who has been missing since 2022, saying he was the individual who was meant to hand over access. The unresolved situation has intensified concerns surrounding the exchange.

The disclosure comes amid ongoing controversy, following reports of a regulatory investigation by Polish authorities. It also follows an analysis by blockchain platform Recoveris, which suggested Zonda could be insolvent due to a significant decline in its hot wallet balances.

Hyperliquid Price Prediction: What Next as HYPE Nears $50 Resistance After Golden Cross

0

Hyperliquid is nearing a critical resistance level around $50 after a nice pump from a higher-low formation. Will this supply wall break this time?

Hyperliquid (HYPE) is consolidating from earlier gains, down 3.8% in the past 24 hours to trade at $43.7 per coin. Despite this, it has solidified its position as the 10th-largest cryptocurrency by market cap. With a market cap of $11.19 billion, it leads its closest rival, UNUS SED LEO (LEO), by over $1.84 billion.

Earlier, HYPE was on a clear uptrend, having increased 8.51% in the past seven days. This has ensured it has the second-best growth in the past 30 days in the top 10 crypto ranking by market cap. Only Tron (TRX) has outperformed, with a 4.32% growth in this timeframe.

HYPE Technical Analysis

The earlier rally followed a well-formed higher low on the daily chart. After a higher high of $43.77 on March 18, HYPE started to pull back. It retested prior higher highs and eventually found support around $35 on April 2.

Afterward, HYPE resumed an uptrend from the higher low at $34.47, targeting an upward push. This time, it had a golden cross as further fuel for the rally. This bullish crossover happened between the 200-day and 50-day moving averages on April 6. The latter crossed over the former, signaling that bearish momentum has exhausted.

Hyperliquid 1D Chart

The price expansion continued, pushing HYPE past its former higher high of $45.77 yesterday before the current consolidation started. With no clear resistance around this area, analysts expect a further push higher.

Hyperliquid and the $50 Resistance

The $50 price mark is not far off for Hyperliquid. Notably, this is an area of interest for the coin, as it has carried strong sell pressure during prior visits. Between July 2025 and now, HYPE has tested this level four times, all of which ended in rejection.

HYPE’s last attempt was in October 2025, when its price peaked at $50.15. It could not break this resistance then, with prices crashing 59% to the January lows of $20.48. Once consolidation ends and the broader market remains favorable, HYPE could target the $50 resistance level again.

Breaking this supply zone allows an easy retest of its current all-time high of $59.40, which it attained in September 2025, the last time it decisively held above $50. However, failure to breach the supply zone leaves the possibility of a pullback open.

HYPE Bulls Rekt as Open Interest Drops

The current pullback from the yearly high of $45 has spiked liquidation in the past 24 hours. During this period, $772,760 worth of HYPE positions were chalked off the derivative market, with most of them being longs.

$466,620 were long positions, while $306,140 were short positions, reflecting the ongoing pullback. However, as HYPE has shown signs of stabilization, short liquidations have surpassed longs in the past 4 hours, with $53,340 for the former and $43,450 for the latter.

Hyperliquid Liquidation Data/Coinglass

Open interest has also dropped 6.30% in the past 24 hours to $1.81 billion, as derivative interest fades. Meanwhile, futures volume has spiked by 9.29%, while spot volume has dropped 13.7% in the past day.

XRP Mimics 2017 Fractal, Trader Predicts Price in 90 Days

Double-digit price predictions for XRP are back in the spotlight as some analysts suggest the asset may be repeating its historic 2017 price pattern.

The outlook has raised expectations of a dramatic breakout in the coming months, as the coin surged 8% over the past week. Notably, XRP is trading at $1.44, its highest price in three weeks. Amid the ongoing bullish momentum, market watchers are drawing parallels with historical patterns.

Key Points

  • XRP mirrors its 2017 fractal, with traders eyeing a potential breakout toward $32 in 90 days.
  • The coin is up 8% weekly, trading near $1.44, its highest level in three weeks.
  • Analyst CryptoCupra says XRP’s current consolidation pattern resembles its explosive 2017 rally setup.
  • Skeptics argue past fractal predictions haven’t worked, while XRP must first reclaim $2–$3 resistance.

Chart Signals Echo 2017 Breakout Setup

Notably, a veteran trader known as CryptoCupra on X pointed out that XRP’s current structure closely mirrors its 2017 fractal. Based on this setup, the analyst believes the token could rally to as high as $32 within the next 90 days if history repeats.

The shared chart shows XRP moving through a long period of sideways consolidation, followed by what appears to be the early stages of a vertical breakout. He claims this is similar to its explosive move in late 2017.

CryptoCupra's XRP chart
CryptoCupra’s XRP chart

Back then, XRP engineered its biggest price breakout in history after a prolonged accumulation phase. Although it has been nine years since that historic run and much has changed in the XRP ecosystem, analysts like CryptoCupra continue to forecast future XRP price movements based on the 2017 pattern.

Notably, a few analysts in the XRP community believe this legendary structure is no longer relevant. At the same time, others continue to draw inspiration from it.

Community Reactions

Community members reacting to CryptoCupra’s post expressed skepticism toward the bullish prediction. X user @Travislc909 remarked that it would be nice if the analyst were right, with the $30 prediction coming to pass. However, he noted that he has seen this “fractal” overlaid on XRP’s chart for years now, and it has never played out.

Similarly, X user @PruferCrypto lamented that for years it has been the same rhetoric and the same result, as analysts keep pushing bold price predictions that never materialize.

The Road to $30 XRP

Notably, at the current price of $1.44, XRP would need to surge 2,122% to reach $32. This price would give XRP a market cap of nearly $2 trillion. Despite how ambitious the outlook is, CryptoCupra gives a three-month timeline for it to materialize.

Prominent XRP analyst Amonyx even remarked that $32 would not be a prediction but a warning should XRP follow the 2017 pattern. The statement suggests $32 may be a starting point for a larger price surge.

For context, throughout 2017 to January 2018, XRP delivered a roughly 700x price increase. While it had humble beginnings then, repeating such a move now that it is a $90 billion cryptocurrency could be far more challenging. This is why some critics call such bold predictions unrealistic.

At the moment, the challenge for XRP is to reclaim $2 and $3, and then proceed to set a new all-time high.

XRP May Drop Further, But Here’s What Truly Matters: Black Swan Capitalist Founder

0

Black Swan Capitalist Founder Versan Aljarrah challenges the market’s fixation on short-term XRP price predictions.

In a detailed X post, he argues that investors are asking the wrong question about XRP’s price action. Rather than focusing on whether XRP will drop further in the short term, he urges investors to analyze liquidity cycles, macroeconomic forces, and XRP’s long-term role in financial infrastructure. 

Key Points

  • Versan Aljarrah argues that investors focus on the wrong question when they fixate on XRP’s short-term price direction.
  • The analyst urges investors to shift attention to liquidity cycles, macroeconomic trends, and long-term market structure.
  • He explains that short-term XRP price movements remain difficult to predict due to factors such as regulation and exchange liquidity.
  • He prioritizes long-term positioning over short-term trading, viewing volatility as a natural part of a broader structural and liquidity-driven evolution.

XRP Could Still Go Lower

XRP’s price performance has been highly volatile this year. It fell from an opening price of $1.84 to below $1.130 before rebounding above $1.40. Despite this recovery, uncertainty persists, prompting Aljarrah to address whether further downside remains possible.

He acknowledges that XRP can still decline in the near term. However, he explains that such movements are typical within cyclical market structures. He notes that these cycles reset leverage, flush out weak positions, and ultimately prepare the market for the next phase of expansion. 

Factors That Make Short-Term Price Prediction Difficult  

While many analysts have relied on technical analysis to project XRP’s price movements, Aljarrah criticizes it as inherently backward-looking. 

Although it helps identify trends, he argues that it often fails to anticipate forward-looking shifts in liquidity, positioning imbalances, and structural changes, especially in a complex market like crypto. 

He also highlights additional forces shaping price action, including regulatory developments, exchange liquidity conditions, and increasing institutional participation. He believes these factors make short-term price movements even more difficult to predict. 

XRP Is Beyond a Speculative Asset: Aljarrah  

At the core of his thesis, Aljarrah positions XRP as more than a speculative asset. The Black Swan Capitalist founder sees the token as part of a potential liquidity and settlement layer that could support a modernized financial system.

From this standpoint, he emphasized that macroeconomic trends become critical. As money supply expands and fiat currencies gradually lose purchasing power, capital tends to rotate into assets positioned to benefit from these shifts. In this context, XRP could play a significant role.

Consequently, Aljarrah emphasizes long-term positioning over short-term reactions. Rather than attempting to buy XRP at lower prices during dips, he focuses on aligning with a broader liquidity and infrastructure cycle, where volatility is not noise, but part of a larger structural evolution.