Home Blog Page 183

XRP Community Eyes April 1 Breakthrough for Ripple Bank Charter

0

A section of the XRP community suggests that the U.S. OCC will lift all restrictions tied to the proposed Ripple National Trust Bank charter by April 1, 2026.

This narrative has gained traction with only a few hours left before April begins. Notably, prominent XRP commentators such as Xaif argue that a recent regulatory amendment could open the door for Ripple to operate with expanded powers, including the provision of digital asset custody services at the federal level.

Despite the growing optimism, the amendment itself does not explicitly support the sweeping interpretation circulating within the community.

Key Points

  • The OCC has revised its chartering framework for national trust banks this month, offering greater clarity and operational flexibility.
  • The amendment has fueled speculation that the OCC could lift restrictions tied to Ripple’s trust bank charter by April 1, 2026—the date the new rule takes effect.
  • Ripple only holds conditional approval, and the amendment does not indicate any plan to remove existing operational restrictions.
  • The company must still obtain final OCC authorization before it can operate as a national trust bank and offer federally regulated digital asset custody services.

OCC Amends Trust Bank Charter Rules

On March 2, the Office of the Comptroller of the Currency (OCC) revised its chartering regulations for national trust banks. The update replaced the term “fiduciary activities” with broader language covering general trust company operations.

While this may seem minor, it expands what these banks can do. The new rule makes it clear they can offer both fiduciary and non-fiduciary services, including digital asset custody. Notably, the OCC confirmed that the updated rule will formally take effect on April 1, 2026.

Ripple’s Conditional Approval From OCC

Meanwhile, the OCC granted conditional approval in December 2025 for the creation of Ripple National Trust Bank. At the time, Ripple CEO Brad Garlinghouse described the milestone as a major step in the company’s expansion in the U.S., particularly in support of its RLUSD stablecoin.

Nonetheless, conditional approval represents only an early stage in the chartering process and does not authorize the bank to begin full operations. Before Ripple can officially launch the trust bank and perform activities such as federally regulated asset custody, it must obtain final OCC authorization.

Steps to Achieving Final Approval

To reach that stage, Ripple still needs to meet several regulatory requirements. According to OCC corporate decisions and supervisory guidance, the company must establish comprehensive risk management controls and implement robust anti-money laundering and know-your-customer (KYC) frameworks.

Ripple must also demonstrate that it holds sufficient capital in line with the financial standards outlined in its charter application and also satisfy other requirements.

If the company satisfies these conditions and secures final approval for Ripple National Trust Bank, the updated rule could enable the firm to provide federally regulated digital asset custody services.

Such a development would mark a significant step toward integrating blockchain companies into the traditional U.S. banking system.
XRP Just Recorded Its First ZK Proof Transaction Amid Privacy Push

The XRP Ledger (XRPL) has reached an important milestone by recording its first zero-knowledge (ZK) proof transaction on the testnet.

The transaction was initiated by DNA Protocol, a blockchain-based platform that allows users to manage and control their biological identity on-chain. This development shows the XRP Ledger’s capability to support privacy-focused transactions linked to DNA data.

Key Points

  • The XRPL recorded its first ZK proof transaction on March 25, 2026, which anchored a verified proof from real genomic data onto the testnet.
  • The transaction used a small 0.000001 XRP transfer and stored only cryptographic proof data to ensure no sensitive information like DNA was exposed on-chain.
  • The development could lead to privacy-focused use cases such as private KYC/AML checks, selective disclosure, and secure handling of medical and financial data.
  • Ripple is also proposing a Confidential MPT protocol to introduce encrypted token balances and hidden transfer amounts.

Technical Details of the XRPL Transaction

DNA Protocol carried out the transaction on March 25, 2026, at 11:19 AM UTC, but later shared the update on March 28. Notably, the transaction anchored a ZK proof created from real genomic identity data collected from a certified lab in Zimbabwe, which the Proof Anchor interface marked with a Zimbabwe flag. 

The system processed the transaction as a Payment type, using a very small transfer of 0.000001 XRP to lock the proof on the ledger. It involved a sender and receiver address, considering its nature as a Payment.

The transaction also included several memos involving DNA Protocol, stored in formats like text/plain and bin/v2. These memos carried encoded cryptographic data, including commitments, proof elements, and validation markers such as nullifiers. However, the system kept all sensitive data, including DNA details, off-chain and only stored the proof itself.

How DNA Protocol Executes Privacy-Preserving Verification

To carry out the process, DNA Protocol takes lab data off the blockchain and turns it into a ZK proof using its tools and cryptographic circuits. It then checks the proof before anchoring a commitment on XRPL. This ensures that the data remains private while still being confirmed and stored in a secure and permanent way.

With this method, institutions like banks, governments, and compliance systems can verify information without seeing the actual data. Users only need to prove that their data meets certain conditions instead of sharing details. This introduces a new way of handling identity in which proof replaces the need to expose personal information.

Potential Institutional Use Cases

This development could lead to multiple real-world uses on the XRPL. Specifically, it supports private KYC and AML checks, allows selective sharing of information, and helps manage sensitive data in areas like healthcare and finance. It can also support proof-of-reserves systems without revealing details about users or transactions.

DNA Protocol has already started pilot programs in different countries, including Zimbabwe and Nigeria. The testnet is actively processing lab data, showing that this system works in real situations and not just in theory.

Ripple’s Confidential MPT Initiative

Meanwhile, Ripple is working on its own privacy solution called Confidential Transfers for Multi-Purpose Tokens. This builds on the XLS-33 token standard, which went live on XRPL mainnet in October 2025, and adds features to hide balances and transfer amounts.

Researchers such as Murat Cenk, Aanchal Malhotra, and Joseph A. Akinyele, Ripple’s Head of Engineering, developed the proposal. They published it as IACR ePrint 2026/602 last week. Notably, their design uses encrypted balances and zero-knowledge proofs to confirm transactions without revealing sensitive details.

The system still keeps sender and receiver identities visible, but it hides balances and transfer values. It also works with existing token rules, supports controls like freezing or clawing back funds, and allows selective disclosure for audits. 

Developers have tested an open-source version called mpt-crypto with XRPL validators, and results show it can work within network limits. However, this feature is still in draft form and needs approval from the XRPL community before it can go live.

Over 40% of Altcoins Near All-Time Lows as Market Pressure Intensifies

The Bitcoin and altcoin markets continue to face pressure as macroeconomic uncertainty and geopolitical tensions weigh heavily on risk assets.

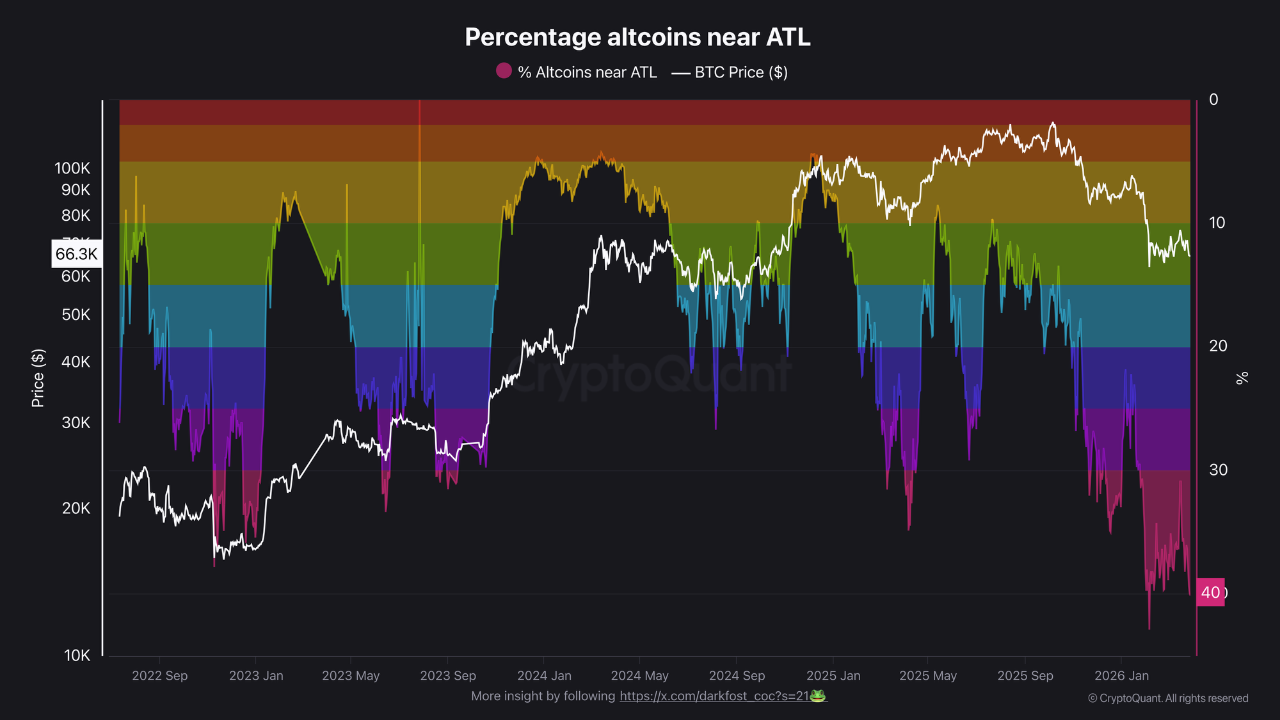
Altcoins, in particular, are emerging as the biggest casualties in the current cycle. According to CryptoQuant analyst Darkfost, over 40% of altcoins now trade at or near their all-time lows.

This marks a level of underperformance even worse than the previous bear market, which peaked at around 38%.

Key Points

  • Over 40% of altcoins now trade near all-time lows, signaling extreme market stress and deep underperformance this cycle.
  • While Bitcoin shows resilience, altcoins like XRP, Solana, and Cardano remain far below peaks, with losses up to 92%.
  • Explosive token growth has caused liquidity dilution, leaving many altcoins fragile and struggling to attract demand.
  • Analysts say the downturn may offer opportunities, but only for investors picking strong projects in a crowded market.

Altcoins Take the Hardest Hit

Ongoing volatility across global financial markets has translated into significant weakness in the crypto sector. However, the impact has been far from evenly distributed. While major assets like Bitcoin have shown relative resilience, altcoins have entered what many analysts describe as an unprecedented period of stress.

Indeed, altcoins have suffered the biggest losses in the ongoing bear market. Bitcoin is trading 46.33% below its all-time high. However, altcoins like XRP, Cardano, Solana, and Dogecoin are trading far below their peaks.

Specifically, XRP is down 65% from its peak, Solana is 72% below its peak, and Cardano is trading at a massive 92% below its all-time high.

Meanwhile, lower-cap crypto assets like Ethena (ENA) hit an all-time low just yesterday, trading at $0.09256. VeChain (VET) is also close to setting a new low, currently trading at $0.006757. This price represents a 98% drop from its peak.

Other assets facing a similar fate include Arbitrum (ARB) and SUI, which are trading at levels that risk falling below their previous all-time lows.

In his commentary, Darkfost noted that altcoins “have never been under such pressure during this cycle,” highlighting how deeply the segment has been affected compared to previous downturns.

Liquidity Dilution Becomes a Growing Problem

Beyond macroeconomic headwinds, structural issues within the crypto ecosystem are also playing a major role. One of the most significant factors is the sheer explosion in the number of digital assets.

There are now over 47 million cryptocurrencies in existence. Ecosystems like Solana host more than 22 million tokens, Base accounts for over 18 million, and BNB Smart Chain adds another 4 million.

This rapid expansion has led to what analysts call “liquidity dilution,” a scenario where capital is spread too thin across too many assets.

As a result, many altcoins struggle to attract sustained demand, making them increasingly fragile and prone to steep declines.

Record Underperformance Signals Opportunity?

While the current landscape appears bleak, extreme underperformance has historically created opportunities for selective investors.

Darkfost suggests that these conditions could present attractive entry points—but only for those able to identify fundamentally strong and resilient projects in an overcrowded market.

With altcoins hovering near record lows and competition at an all-time high, it is now a matter of which projects will survive in the months to come.

No New Bitcoin Buys From Strategy This Week, Breaking Ongoing Streak

Strategy has temporarily stopped adding Bitcoin to its balance sheet, marking its first weekly pause in more than three months.

The move, disclosed in a recent company filing, appears to reflect a timing adjustment as the current quarter draws to a close rather than a shift in overall strategy.

According to the filing, the company neither purchased Bitcoin nor issued shares through its at-the-market (ATM) program over the past week. This stands in contrast to a consistent accumulation pattern that had defined its activity in recent months.

Key Points

  • Strategy made no Bitcoin purchases this week, ending a multi-month accumulation streak.
  • The company also issued no shares through its at-the-market (ATM) program during the same period.
  • Bitcoin buying had already slowed sharply, dropping from $1.6 billion to $76.6 million in the prior week.
  • Strategy’s total Bitcoin holdings stand at 762,099 BTC, worth roughly $52 billion.
  • The firm is shifting its funding model toward preferred shares while maintaining its long-term 1 million BTC target.

Sharp Decline in Weekly Purchases

This pause follows a significant deceleration in buying momentum. In the week ending March 22, 2026, Strategy acquired roughly $76.6 million in Bitcoin. That figure represents a sharp drop from the $1.6 billion spent in the prior week.

Despite this slowdown, the firm’s overall holdings remain substantial. Strategy currently holds 762,099 Bitcoin, valued at roughly $52 billion.

Meanwhile, broader market conditions have been less favorable. Data from CoinGecko indicates Bitcoin was trading near $67,912 at the time of reporting, down 22.5% since the start of the year, underscoring ongoing volatility.

Legal Dispute Resolved Ahead of Shareholder Vote

Alongside the operational pause, the company has also resolved a pending legal dispute. A class action lawsuit filed by David Dodge in July 2025 has been settled.

The case focused on alleged voting rights concerns tied to the STRK Amendment. According to the company’s disclosure, the matter was dismissed as moot under a March 12 agreement.

Following this resolution, Strategy plans to seek formal shareholder approval for the amendment at its next annual meeting. In addition, the firm agreed to pay $550,000 toward the plaintiff’s legal fees, closing the issue without further litigation.

Shift Toward Preferred Shares for Funding

Alongside these developments, Strategy is also refining its funding approach. Chief executive Phong Le indicated that the company plans to reduce its reliance on common stock issuance.

Instead, the focus is shifting toward preferred shares as a more stable financing tool. This adjustment aims to limit dilution for existing shareholders while maintaining consistent access to capital.

To support this strategy, the company introduced a $42 billion ATM program in January 2025. The offering is evenly divided between MSTR common shares and STRC perpetual preferred shares, with $21 billion allocated to each.

In parallel, Strategy established an additional $2.1 billion facility tied to its STRK preferred series. Combined, these initiatives provide a total fundraising capacity of $44.1 billion.

Cost Implications and Long-Term Targets

However, this funding shift comes with trade-offs. STRC preferred shares carry an annual dividend of 11.5%. The company noted that this rate has increased steadily for seven consecutive months since July 2025.

The goal is to keep these shares trading close to their $100 par value, thereby ensuring predictable financing conditions. Even so, a larger preferred share base introduces fixed financial commitments that persist regardless of Bitcoin’s price movements.

Despite these added costs, Strategy’s long-term ambition remains unchanged. The company aims to hold one million Bitcoin by the end of 2026. To achieve this, it must acquire an additional 237,901 coins within roughly nine months.

Taken together, the pause in purchases, legal resolution, and funding shift reflect a period of adjustment rather than retreat. Strategy is balancing short-term caution with long-term conviction, keeping its Bitcoin accumulation plan on track.

Bitcoin Slips into Accumulation Zone Amid Increased Whale Deposits into Binance

Bitcoin may have slipped into an accumulation zone amid increased whale deposits into the Binance exchange.

While Bitcoin has collapsed 47% from its $126,000 all-time high reached in October 2025 amid the six-month downturn, market data indicates that the crypto firstborn may have entered an accumulation zone, with Binance recording higher whale deposits.

Key Points 

  • Bitcoin has dropped 47% from its $126,000 all-time high and remains down 23% this year after recording five straight months of losses.
  • The BTC price is trading around $67,000, still above its realized price of $54,286, suggesting it has not yet reached the deeper undervaluation seen in past cycles.
  • Data indicates that during the 2022 bear market, Bitcoin stayed below its realized price for 179 days before recovering.
  • Institutional demand remains weak, with key indicators turning negative.
  • Exchange activity shows rising whale influence as inflows to Binance hit 2,003 BTC ($134 million) on March 29.

Bitcoin Reacts to Global Tensions

Oinonen, a verified CryptoQuant analyst, discussed this in his latest analysis. He explained that Bitcoin has moved into an accumulation phase at a time when global uncertainty is increasing.

According to him, tensions in the Middle East, especially the Israel-Iran conflict escalation in February 2026, pushed oil prices higher and drove the CBOE Volatility Index above 31 on Monday, showing rising fear in the markets. However, these tensions pushed Bitcoin to $65,000.

No Clear Bitcoin Capitulation Yet

For context, since Feb. 28, WTI crude oil has risen by 53.7% to around $103 per barrel. In comparison, Bitcoin has only gained 3% during that period, and even that small increase came after it recently recovered from a drop to $65,000 earlier in the day. Bitcoin remains down 23% this year, recording five straight months of losses from October 2025 to February 2026.

Notably, Oinonen clarified that even though the market is deep in a bear phase, it has not yet seen a full capitulation. To him, the market still lacks the kind of sharp sell-off that usually marks the end of a downtrend.

He called this missing phase a final wave of panic selling, where trading volume rises sharply, leveraged positions face forced liquidations, and realized losses on-chain increase quickly. Without this, it is harder to say that the market has reached its lowest point.

Bitcoin Realized Price and Signs of Accumulation

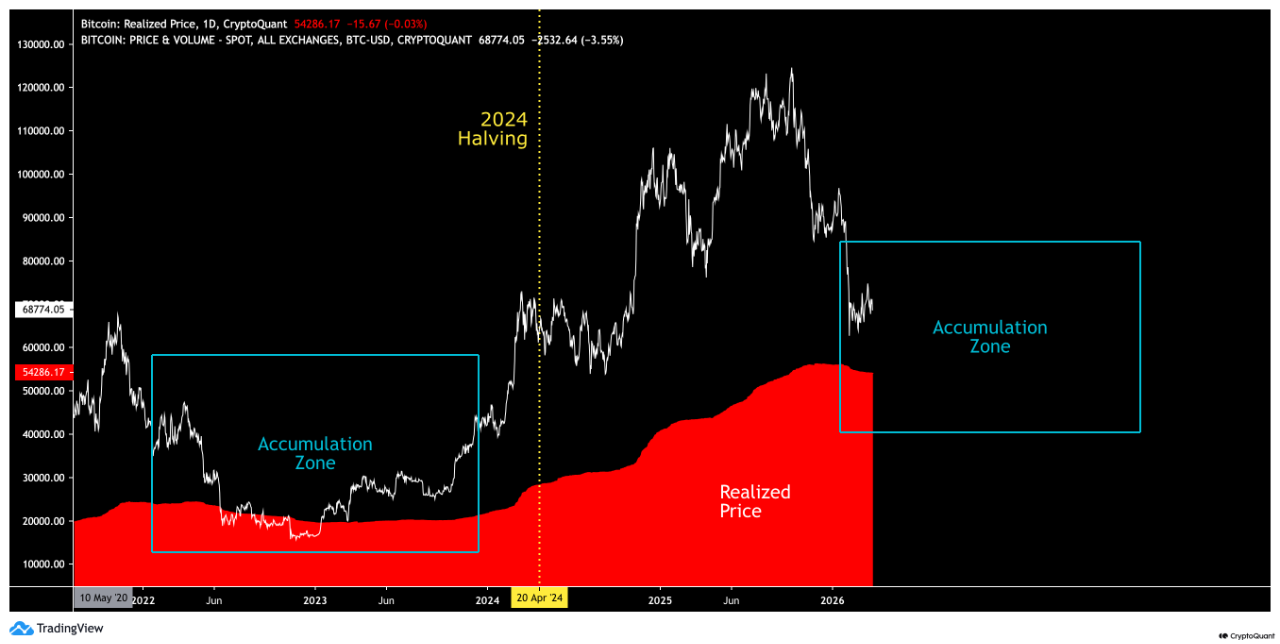
Oinonen also noted that as Bitcoin’s price drops, it is getting closer to its realized price, which often signals undervaluation. Right now, the realized price stands at $54,286, while Bitcoin is trading at about $67,000 at press time, meaning it is still above that level.

Bitcoin Slips into Accumulation Zone CryptoQuant
Bitcoin Slips into Accumulation Zone | CryptoQuant

The analyst compared the current phase to the 2022 bear market, when Bitcoin fell below its realized price in June 2022, dropping to $21,000 while the realized price was $22,500. During that time, Bitcoin stayed below the realized price for 179 days, giving investors a long window to accumulate.

Oinonen believes a similar pattern could happen again in 2026. He said that while current models suggest Bitcoin is moving sideways, a stronger sign of a bottom would be a drop below the realized price. However, he added that Bitcoin is already in an accumulation zone, where long-term investors often begin to buy.

Weak Institutional Demand and Whale Activity on Binance

Despite this, Oinonen also called attention to weakening demand from large investors. Specifically, the Coinbase Premium Index has turned negative again, showing that institutional interest has slowed. He also referred to recent CryptoQuant data, which shows that broad institutional demand is still missing.

Meanwhile, activity from large holders on Binance has increased. These whales have been moving large amounts of Bitcoin onto the exchange, which often suggests they may be preparing to sell. This trend pushed the Exchange Whale Ratio on Binance from 0.39 on March 25 to 0.66 on March 29, before it eased slightly.

He also noted that Bitcoin flows into Binance have been positive over the past two days. On March 29, the exchange recorded 2,003 BTC in net inflows, worth about $134 million, the highest since Feb. 20. The trend has continued, with current inflows at 1,395 BTC so far today, valued at around $93 million.

Bitcoin Exchange Netflow on Binance

Investors Bought XRP Funds Last Week, While Bitcoin and Ethereum Lost Millions

0

XRP investment vehicles were among the few crypto funds to see net inflows last week, while Bitcoin and Ethereum products lost a combined $416 million.

Data from CoinShares’ head of research, James Butterfill, confirmed this on Monday. XRP-related investment products recorded a net inflow of $15.8 million last week as market participants doubled down on the asset despite predominant broader sell-offs.

Key Points

  • XRP investment products recorded a net inflow of $15.8 million last week.
  • Digital investment products saw a notable $414 million outflow last week, spurred by geopolitical tension and economic uncertainties.
  • Ethereum received the hardest blow, recording a net weekly outflow of $222 million, the worst of any cryptocurrency.
  • Bitcoin followed in this step, with a softer $194 million outflow.
  • Following the weekly outflows, the total assets under management (AUM) for crypto products dropped to $129 billion.
  • Regionally, the US contributed significantly to weekly outflows, with $445 million in outflows.

Crypto Investment Products Sees Broader Sell-Offs

The CoinShares report highlighted that digital investment products saw a notable $414 million outflow last week, spurred by geopolitical tension and economic uncertainties. The Middle East conflict fears heightened, as despite ceasefire attempts by the US, Iran seems resolute in continuing the war and shutting down the Strait of Hormuz.

Elsewhere, the US Federal Reserve (Fed) failed to cut interest rates earlier in the month, as the economy feels the heat of the elongating war with Iran. The rising crude oil price has weighed on key sectors, driving up inflation risk. Consequently, the chance of an interest rate slash this year is growing increasingly slim.

These factors drove skepticism, with investors pushing away from risky assets. Crypto products reflected this skepticism, recording their first outflow in five weeks.

XRP Shines but Investors Dump Ethereum and Bitcoin

Notably, Ethereum funds received the hardest blow, recording a net weekly outflow of $222 million. The mass exodus brought their YTD net outflow to $273 million, reflecting the products’ struggles beyond the current macroeconomic headwinds. Butterfill highlighted that last week’s Ethereum net outflows might be “Clarity Act related.”

Bitcoin followed in this step, with a softer $194 million outflow. The funds have been in a good run lately, which means they still maintain a positive YTD flow of $964 million.

Investment products tied to Solana and multi-assets also saw outflows, with XRP the only shining light. Notably, funds tracking the XRPL native token saw the largest net inflows totaling $15.8 million, as investors maintained interest despite the broader struggle.

Crypto Investment Products' Weekly Flow/CoinShares
Crypto Investment Products’ Weekly Flow/CoinShares

Following the weekly outflows, the total assets under management (AUM) for crypto products dropped to $129 billion, revisiting valuation levels last seen in early February. This level is also comparable to April 2025, when the Donald Trump tariff war was in its initial phases.

Flows by Country

Regionally, the US contributed majorly to the weekly outflows, recording a $445 million outflow. This is understandable, given that the negative sentiment around the digital asset ecosystem stemmed from developments mostly impacting the country.

Other notable sources of selling pressure were from Switzerland and Sweden, which saw outflows of $4 million and $3.5 million, respectively.

In contrast, Germany and Canadian investors bought the dip, recording inflows of $21.2 million and $15.9 million, respectively. Brazil also saw inflows of just under $1 million.

Ripple CTO Emeritus Says Higher XRP Price Makes Payments Cheaper

0

Ripple CTO Emeritus David Schwartz has clarified a long-standing statement about the economics of using XRP for payments. 

According to Schwartz, the higher the price of XRP, the cheaper it becomes to transfer value, assuming other conditions remain the same.

He offered the clarification while responding to questions about a widely circulated comment he made in 2017 regarding XRP’s price and its role in payments. Through his recent explanation, Schwartz sought to simplify the concept and address persistent misunderstandings within the community.

Key Points 

  • Ripple CTO emeritus David Schwartz suggests that as XRP’s price rises, it will become cheaper and more efficient to transfer value. 
  • The concept of his commentary is that a higher unit price means fewer XRP tokens are required to move the same amount of value, say $1 million. 
  • His explanation contradicts the belief that XRP must remain low-priced to function as a payment asset. 
  • Analysts clarified that the example demonstrates payment mechanics, not a forecast that XRP will reach $1 million. 

Higher Prices Reduce Payment Friction

Schwartz explained that the logic is straightforward. When XRP’s unit price increases, users can transfer the same amount of value using fewer tokens.

In an earlier example, he noted that sending $1 million would require 1 million XRP if the token trades at $1. However, if each XRP were worth $1 million, the same payment would require just one XRP.

Although the transferred value remains identical in both scenarios, the key difference lies in market efficiency. Moving extremely large quantities of a low-priced asset can put pressure on the market order book, potentially triggering price shifts and increasing transaction costs.

By contrast, a higher-priced asset requires fewer units to complete the same transaction. As a result, the trade places less stress on the market, reducing the likelihood of price disruption. 

Market Liquidity Matters

In his earlier commentary, Schwartz used Bitcoin to illustrate this principle. He explained that purchasing a million-dollar home with Bitcoin became feasible once the asset’s price climbed to around $8,000, because the market had grown deep enough to absorb large trades. 

However, when Bitcoin traded near $300, executing a transaction of that size would likely have moved the market significantly. This type of price movement effectively raises the cost of executing a payment. As markets mature and asset prices rise, liquidity often expands, enabling large transactions with minimal market impact. 

Schwartz’s remarks also challenge a persistent narrative that XRP must remain inexpensive to function effectively as a payment token. Instead, his explanation suggests that a higher-valued XRP could actually improve efficiency. With greater purchasing power per token, fewer units are required to move large sums, reducing slippage and streamlining high-value transfers. 

$1M Example Is Not a Price Prediction

Following the discussion, XRPL dUNL validator Vet addressed claims circulating in parts of the community. Some users previously interpreted Schwartz’s example as implying a guaranteed $1 million price target for XRP.

Both Vet and Schwartz pushed back against that interpretation. They clarified that the example illustrates how payments function at higher asset prices, rather than predicting a specific future valuation.

XRP was designed to enable fast and inexpensive cross-border value transfers. Within that framework, a higher token price can improve efficiency in fiat terms because each unit of XRP represents greater purchasing power.

Institutions moving large amounts of capital would need fewer tokens to settle transactions, potentially lowering market impact and making high-value payments easier to execute.

How XRP Reacts to the 200W EMA Will “Change Everything”

How XRP reacts to the 200-week exponential moving average could “change everything” about its price action, according to historical data.

XRP has fallen back into a downtrend after failing to hold its earlier recovery. The price met strong resistance at $1.6 on March 17, and since then, it has steadily declined to around $1.35. This drop has brought XRP to the 200-week exponential moving average (EMA), a very important level that could decide what happens next.

Key Points

  • XRP fell from resistance at $1.6 on March 17 to around $1.35, putting it near the key 200-week EMA at $1.40.
  • Data shows XRP peaked at $3.3 in 2017, $1.96 in 2021, and $3.6 in July 2025, with each cycle later retesting the 200-week EMA.
  • Historical patterns indicate that repeated lower highs after these peaks show weakening buying pressure and often lead to extended bearish phases.
  • XRP could still see a relief rally toward $1.80–$2, but this move could eventually result in further declines.
  • Key resistance stands at $2.40 from January 2026, and failure to break above it keeps the broader trend under pressure.

XRP’s Reaction at the 200W EMA “Changes Everything”

Market analyst Chart Nerd called attention to the 200-week exponential moving average (EMA) as the most important level to watch now amid XRP’s current market uncertainties. 

Over the past seven to eight weeks, XRP has moved above, below, and around this line. Right now, the 200-week EMA sits at $1.40, which puts XRP almost exactly at this critical point. Based on past patterns, how XRP reacts here could “change everything,” Chart Nerd says.

Looking at XRP’s history, the market analyst highlighted three major peaks: $3.3 in 2017, $1.96 in 2021, and $3.6 in July 2025. After each of these highs, XRP eventually dropped back to test the 200-week EMA.

The pattern played out after the 2021 peak, and now again after the July 2025 top. This shows that the 200-week EMA acts as a long-term guide for the trend, even though it reacts slowly to price changes.

Historical Data Shows Repeating Patterns

In earlier cycles, XRP often bounced after first touching the EMA. For instance, during the 2018 market cycle, the price saw inconsistent rallies after hitting the EMA. 

However, those rallies became weaker over time, forming lower highs through 2018 and into 2019, which showed that buying strength was fading. Eventually, on the third major retest, XRP broke below the EMA, turned it into resistance, and continued falling until it reached the $0.11 low in March 2020.

XRP Retests 200W EMA After Each Peak
XRP Retests 200W EMA After Each Peak | Chart Nerd

A similar pattern appeared after the 2021 peak. Specifically, XRP saw several short rallies before and after reaching the 200-week EMA, but each one failed to move higher than the last. These lower highs showed that buyers were losing strength.

When XRP finally broke down in 2022, the rest of the bear market followed. Chart Nerd explained that these types of rallies can be misleading, as they often make it seem like the market has recovered when it has not.

Right now, XRP is again moving around the same level. According to him, this makes things tricky, as both buyers and sellers can get caught off guard. There is still a chance XRP could rise toward the $1.80 to $2 range, although that move has not happened yet.

Even if XRP does move up, history suggests that such rallies may not last. For instance, a rise from $1.16 to $2 would be a 91% increase, but the price could still fall again later in the year.

Resistance Remains Strong, With More Risk Below

Chart Nerd says XRP is still under strong pressure unless it breaks above $2.40, which represents the high from January 2026. Without moving past that level, the overall trend remains weak.

Past data also shows how sharp the drops can be after losing the 200-week EMA. In one case, XRP fell 64% after breaking below it in 2020, and that came after an earlier 92% drop from the 2018 peak. Even though the price later rose about 195% from $0.30 to $0.80, it still went on to fall again.

Chart Nerd pointed out that these kinds of moves can confuse traders. Large gains after big losses can make it seem like the worst is over, but the market can still turn down again. This is why both buyers and sellers often get caught at the wrong time.

What Comes Next for XRP

Chart Nerd believes XRP is at a key turning point near the 200-week EMA at $1.40. From here, two main paths are possible. The price could rise for a while and then fall again, or it could drop sooner and form a bottom more quickly.

He confirmed that he is watching the $0.70 to $0.90 range as a possible target. This area acted as resistance between July 2023 and 2024 before XRP finally broke above it, so it could now act as support if the price falls.

What Comes Next for XRP

According to Chart Nerd, some signals suggest XRP is already very oversold, especially on the weekly RSI, which has reached levels not seen before. However, markets can stay oversold for a long time. For now, Chart Nerd keeps a short-term bearish view.

XRP Now at the Same Position It Was in May 2022: What Happens Next?

Historical data indicates that XRP now sits in the same position it was in May 2022 during the bear market at that time.

This is in relation to the 200-week exponential moving average (EMA), a pivotal technical indicator that now acts as a dynamic resistance level. For context, XRP recently lost the 200W EMA, putting it in the same position as it was during the downturn in May 2022. From here, the price could slip further to hit the current bear market’s bottom.

Key Points

  • XRP recorded another round of declines after it hit a peak of $1.6 on March 17, collapsing to the current price of $1.4.
  • The latest downturn has now pushed the price below the 200-week exponential moving average.
  • This recent price action now places XRP at the same position it was in May 2022, right after it lost the support at the 200W EMA.
  • From here, XRP could suffer steeper declines to reach a bottom before the price can start seeing rebound efforts.
  • Data surrounding the Gaussian Channel suggests the bottom could come in at the $0.7 to $0.8 price range.

The Latest Round of Declines 

This comes from an analysis shared by market watcher Chart Nerd, as XRP struggles to maintain the gains it picked up during the rally earlier this month. For context, after collapsing to a local floor of $1.27 following the escalation of the Israel-Iran conflict on Feb. 28, XRP and the broader crypto market recovered.

The XRP price first rebounded to a high of $1.47 on March 4 before pulling back to $1.32 after four days. Shortly after this, another recovery effort ensued, allowing XRP to rally to the $1.6 peak on March 17. However, the resistance at this mark halted the uptrend, leading to declines that have persisted until now. 

XRP Loses the 200W EMA

As a result of these declines, XRP recently crashed below the pivotal 200-week EMA ($1.40). This marked the first time XRP would trade below this technical level since its November 2024 upsurge. XRP dropped and closed below the moving average last week, and with its price currently sitting at $1.35, the asset remains below the key level.

Now, the 200W EMA has flipped from support to resistance that could stifle XRP’s upward potential during times of a rebound. Interestingly, data from Chart Nerd’s chart indicates that, with the recent drop below this moving average, XRP now trades in the same position it was in May 2022 during the bear market at the time.

XRP 200W EMA Chart Nerd
XRP 200W EMA | Chart Nerd

The analyst had, in a previous commentary, argued that XRP has officially entered a full-blown bear market. His recent chart suggests that XRP could see steeper declines from here after losing the 200W EMA. When it lost this level in May 2022, what followed was an additional 50.8% crash from $0.57 to $0.28. This low eventually marked the bottom for that bear market.

Chart Nerd believes a similar pattern could play out this time. He has already mapped out a possible downward trend for XRP, potentially reaching $0.8 to $0.9. This aligns partially with the $0.7 to $0.8 range identified by the market watcher in a previous commentary. According to him, this level aligns with the upper band of the 2-week Gaussian Channel, and could mark XRP’s bottom.

XRP Accounts for 1.5% of All Distributed Tokenized RWA

0

The XRP Ledger now accounts for more than 1.5% of all distributed tokenized real-world assets globally despite recent declines.

This is according to data from RWA.xyz, a leading analytics platform for the tokenized RWA market. For context, the XRPL boasts $408 million worth of distributed real-world assets (excluding stablecoins), accounting for a 1.53% market share of the global figure.

Key Points

  • The XRP Ledger is home to over $408 million worth of distributed real-world assets despite a 15.22% decline in value over 30 days.
  • With this figure, the ledger accounts for 1.53% of the total global distributed RWA value.
  • This makes the XRPL the eighth-largest network in the world in terms of distributed RWA value.
  • There is $282 million worth of U.S. Treasury Debt on the network, as this asset class makes up the bulk of the $408 million total figure.
  • The inclusion of stablecoins would push XRP’s distributed RWA figure above $821 million.

XRP Ledger Seeing RWA Growth Despite Recent Declines

Notably, the current figure confirms the impressive growth demonstrated by the XRPL in terms of tokenized real-world assets. For context, at the start of 2026, the distributed RWA figure stood at $337 million, after growing by over $320 million last year, 2025.

Since the beginning of this year, the network has continued to record additions. The total figure rose to a peak of $481.8 million in mid-February 2026, driven largely by Ondo’s Short-Term Government Bond Fund, which spiked from $40 million to $160 million within a day.

However, in late February, the Aberdeen Group pulled out its US Dollar Liquidity Fund worth $7.7 million, bringing the total to $474 million. By mid-March, the worth of OpenEden’s TBILL Vault dropped from $51 million to $41 million, further reducing the total figure.

Meanwhile, on March 16, data shows that the Montis Group Limited also pulled out its $55 million tokenized product. This reduced the total to $404 million. Interestingly, the TBILL Vault from OpenEden has since grown to $46 million, bringing the total to the current reading of $408 million. Despite the recent declines, the XRPL has added $71 million in distributed RWA value this year.

DIstributed RWA League Table

U.S. Treasury Debt Leading the Charge

Notably, U.S. Treasury Debt contributes the largest share to the XRPL’s distributed RWA value. These tokenized products account for $282 million worth of RWA value on the network. These U.S. Debt funds are provided by OpenEden, Ondo, and Guggenheim Treasury Services.

US Treasury Debt on XRPL

Specifically, Ondo boasts the largest single U.S. Treasury Debt product in the form of its Short-Term U.S. Government Bond Fund, currently worth $160 million on the XRPL. As for Guggenheim, the firm hosts $75 million in U.S. Treasuries on the XRPL. Meanwhile, OpenEden’s TBILL Vault has an XRPL-based worth of $46.2 million.

Besides the U.S. Treasury Debt products, Credit-based products, and Active Strategies also contribute to the $408 million. Specifically, the XRPL hosts $82 million worth of Corporate Credit and $23.9 million in Asset-Backed Credit. Meanwhile, including the $413.8 million worth of stablecoins brings the total distributed RWA value to $821 million.

XRP Ledger Distributed RWA