Home Blog Page 184

XRP Now at the Same Position It Was in May 2022: What Happens Next?

Historical data indicates that XRP now sits in the same position it was in May 2022 during the bear market at that time.

This is in relation to the 200-week exponential moving average (EMA), a pivotal technical indicator that now acts as a dynamic resistance level. For context, XRP recently lost the 200W EMA, putting it in the same position as it was during the downturn in May 2022. From here, the price could slip further to hit the current bear market’s bottom.

Key Points

  • XRP recorded another round of declines after it hit a peak of $1.6 on March 17, collapsing to the current price of $1.4.
  • The latest downturn has now pushed the price below the 200-week exponential moving average.
  • This recent price action now places XRP at the same position it was in May 2022, right after it lost the support at the 200W EMA.
  • From here, XRP could suffer steeper declines to reach a bottom before the price can start seeing rebound efforts.
  • Data surrounding the Gaussian Channel suggests the bottom could come in at the $0.7 to $0.8 price range.

The Latest Round of Declines 

This comes from an analysis shared by market watcher Chart Nerd, as XRP struggles to maintain the gains it picked up during the rally earlier this month. For context, after collapsing to a local floor of $1.27 following the escalation of the Israel-Iran conflict on Feb. 28, XRP and the broader crypto market recovered.

The XRP price first rebounded to a high of $1.47 on March 4 before pulling back to $1.32 after four days. Shortly after this, another recovery effort ensued, allowing XRP to rally to the $1.6 peak on March 17. However, the resistance at this mark halted the uptrend, leading to declines that have persisted until now. 

XRP Loses the 200W EMA

As a result of these declines, XRP recently crashed below the pivotal 200-week EMA ($1.40). This marked the first time XRP would trade below this technical level since its November 2024 upsurge. XRP dropped and closed below the moving average last week, and with its price currently sitting at $1.35, the asset remains below the key level.

Now, the 200W EMA has flipped from support to resistance that could stifle XRP’s upward potential during times of a rebound. Interestingly, data from Chart Nerd’s chart indicates that, with the recent drop below this moving average, XRP now trades in the same position it was in May 2022 during the bear market at the time.

XRP 200W EMA Chart Nerd
XRP 200W EMA | Chart Nerd

The analyst had, in a previous commentary, argued that XRP has officially entered a full-blown bear market. His recent chart suggests that XRP could see steeper declines from here after losing the 200W EMA. When it lost this level in May 2022, what followed was an additional 50.8% crash from $0.57 to $0.28. This low eventually marked the bottom for that bear market.

Chart Nerd believes a similar pattern could play out this time. He has already mapped out a possible downward trend for XRP, potentially reaching $0.8 to $0.9. This aligns partially with the $0.7 to $0.8 range identified by the market watcher in a previous commentary. According to him, this level aligns with the upper band of the 2-week Gaussian Channel, and could mark XRP’s bottom.

XRP Accounts for 1.5% of All Distributed Tokenized RWA

0

The XRP Ledger now accounts for more than 1.5% of all distributed tokenized real-world assets globally despite recent declines.

This is according to data from RWA.xyz, a leading analytics platform for the tokenized RWA market. For context, the XRPL boasts $408 million worth of distributed real-world assets (excluding stablecoins), accounting for a 1.53% market share of the global figure.

Key Points

  • The XRP Ledger is home to over $408 million worth of distributed real-world assets despite a 15.22% decline in value over 30 days.
  • With this figure, the ledger accounts for 1.53% of the total global distributed RWA value.
  • This makes the XRPL the eighth-largest network in the world in terms of distributed RWA value.
  • There is $282 million worth of U.S. Treasury Debt on the network, as this asset class makes up the bulk of the $408 million total figure.
  • The inclusion of stablecoins would push XRP’s distributed RWA figure above $821 million.

XRP Ledger Seeing RWA Growth Despite Recent Declines

Notably, the current figure confirms the impressive growth demonstrated by the XRPL in terms of tokenized real-world assets. For context, at the start of 2026, the distributed RWA figure stood at $337 million, after growing by over $320 million last year, 2025.

Since the beginning of this year, the network has continued to record additions. The total figure rose to a peak of $481.8 million in mid-February 2026, driven largely by Ondo’s Short-Term Government Bond Fund, which spiked from $40 million to $160 million within a day.

However, in late February, the Aberdeen Group pulled out its US Dollar Liquidity Fund worth $7.7 million, bringing the total to $474 million. By mid-March, the worth of OpenEden’s TBILL Vault dropped from $51 million to $41 million, further reducing the total figure.

Meanwhile, on March 16, data shows that the Montis Group Limited also pulled out its $55 million tokenized product. This reduced the total to $404 million. Interestingly, the TBILL Vault from OpenEden has since grown to $46 million, bringing the total to the current reading of $408 million. Despite the recent declines, the XRPL has added $71 million in distributed RWA value this year.

DIstributed RWA League Table

U.S. Treasury Debt Leading the Charge

Notably, U.S. Treasury Debt contributes the largest share to the XRPL’s distributed RWA value. These tokenized products account for $282 million worth of RWA value on the network. These U.S. Debt funds are provided by OpenEden, Ondo, and Guggenheim Treasury Services.

US Treasury Debt on XRPL

Specifically, Ondo boasts the largest single U.S. Treasury Debt product in the form of its Short-Term U.S. Government Bond Fund, currently worth $160 million on the XRPL. As for Guggenheim, the firm hosts $75 million in U.S. Treasuries on the XRPL. Meanwhile, OpenEden’s TBILL Vault has an XRPL-based worth of $46.2 million.

Besides the U.S. Treasury Debt products, Credit-based products, and Active Strategies also contribute to the $408 million. Specifically, the XRPL hosts $82 million worth of Corporate Credit and $23.9 million in Asset-Backed Credit. Meanwhile, including the $413.8 million worth of stablecoins brings the total distributed RWA value to $821 million.

XRP Ledger Distributed RWA

Cardano Harmonic Pattern Shows the Next Bullish Phase Could be Biggest in History

0

An emerging Cardano harmonic pattern suggests the coming bull season could be much bigger than the previous two cycles.

The analysis follows a period of price consolidation for Cardano (ADA), which has brought it down to more than 90% of its 2021 all-time high of $3.10. With the broader market remaining cautious and bears still in charge, a recent analysis has identified an optimistic chart development on a higher timeframe.

Key Points

  • A recent Cardano analysis highlights a sequence of repeating harmonic patterns that continues to increase in scale over time.
  • The earliest pattern, a “shark,” was small, with ADA growing 243% from $0.236 in September 2023 to $0.810 in March 2024.
  • An even larger formation (Cypher) followed, and the pattern saw the coin rally 376%.
  • The most recent structure (butterfly) is significantly bigger, indicating the possibility of a more substantial move if the pattern continues to play out.

Cardano Harmonic Pattern

A recent analysis of the ADA/USDT weekly chart by MasterAnanda highlights a sequence of repeating harmonic patterns that appear to increase in scale over time. Each formation seems to correspond with a stronger upward phase than the one before it, suggesting a structured rhythm in Cardano’s price behavior.

Notably, the earliest pattern on the chart is relatively small, with the analyst calling it a “shark.” ADA moved from a low of $0.236 in September 2023 to $0.810 in March 2024, representing a 243% increase. An even larger formation (Cypher) followed, which precedes a more pronounced recovery. The pattern saw the coin rally 376% from $0.277 in August 2024 to $1.32 in December 2024.

Meanwhile, the most recent structure (butterfly) is significantly bigger, indicating the possibility of a more substantial move if the pattern continues to play out in a similar way.

Cardano Harmonic Pattern/MasterAnanda

Expanding ADA Patterns

The progression from smaller to larger harmonic formations suggests a gradual growth in momentum across cycles. Each phase reflects a transition from a corrective period into a recovery phase, with the magnitude of the move increasing alongside the size of the pattern.

This aligns with the broader behavior often seen in the crypto market, where extended periods of weakness precede stronger recoveries. The chart shows that Cardano entered a downward phase after a high of $1.018 in August 2025 and is trading near a key support area.

As the bearish ADA trend persists, the harmonic structure suggests the market may be transitioning out of that phase. Recent price action around the long-term support further adds context.

Cardano Long-Term Support and Double-Bottom Formation

MasterAnanda highlighted another notable feature on the chart: the long-term support zone. This level lies between $0.220 and $0.245, with history showing it has been a major area where Cardano has recorded turning points. ADA reached this support in June 2023, dropping to a low of $0.220 before rebounding to far higher prices.

Additionally, Cardano recently tested this long-term support in February, dropping to $0.220. The analysis suggests this is a long-term double-bottom formation, indicating the price may have bottomed.

Notably, the earlier interaction with this support zone led to a prolonged recovery phase. As such, the recent retest may suggest that a similar price trajectory could unfold again.

Supporting this narrative is the prolonged period of bearish price trends. The market watcher noted that Cardano entered the bearish phase in December 2024. Usually, the market turns bullish after activating support and an elongated bearish period.

Holding 1,000 XRP Won’t Make You Rich, Analyst Explains Why

XRP commentator Zach Humphries has pushed back against the popular belief that holding 1,000 XRP tokens is enough to guarantee future wealth.

In a recent video, Humphries argued that while XRP remains a strong asset with long-term potential, expecting a modest holding to turn into millions may be unrealistic without considering market fundamentals.

Key Points

  • Zach Humphries says holding 1,000 XRP alone won’t make you rich without a solid strategy.
  • Hitting $1,000 per XRP would value the coin at $61 trillion, unrealistic in today’s crypto market.
  • Success comes from “stacking and positioning,” diversifying, and adapting to market conditions.
  • Proper XRP management and incremental profit-taking matter more than sheer token holdings.

Reality Behind XRP Dreams

According to Humphries, the assumption that 1,000 XRP could make someone rich relies heavily on extreme price projections that would require enormous growth in market capitalization.

For instance, for a holder of 1,000 XRP to become a millionaire, the token would need to reach $1,000 per coin. This outcome would push XRP’s total valuation far beyond the current size of the global crypto market.

Specifically, $1,000 per XRP would give the coin a valuation of $61 trillion. Humphries stressed that such projections often ignore timelines, liquidity constraints, and economic factors.

Rather than dismissing XRP itself, he clarified that the issue lies in strategy, not the asset.

“Hope Is Not a Strategy”

The analyst criticized the popular “hope-driven investing” in which traders rely on a single asset to deliver life-changing returns.

In his view, simply holding a fixed amount of XRP and waiting for a massive price surge is not a sustainable approach. Instead, he emphasized the importance of actively building positions over time and adapting to market conditions.

Humphries noted that successful crypto investors typically take a more dynamic approach. This approach includes increasing income streams, accumulating more assets, and diversifying across multiple opportunities rather than relying on one token.

He added that real gains in crypto often come from “stacking and positioning,” where investors gradually build exposure and remain flexible as the market evolves.

The 1,000 XRP Psychology

Many in the XRP community have long viewed specific token milestones, such as owning 1,000 XRP, as benchmarks for future financial success.

Humphries’ stance challenges that narrative. It encourages a shift away from fixed targets and toward comprehensive financial planning.

Indeed, XRP continues to play a role in cross-border payments and institutional adoption. Yet, long-term success depends less on how much XRP one holds today and more on the strategy for growing wealth over time.

Potential Outlook in 2026

Recently, YouTube creator “BULLRUNNERS” highlighted that managing XRP properly can matter more than sheer holdings. At $1.36 per XRP, 1,000 coins are worth $1,360. Still, even modest positions can scale significantly in a bull market.

He projects price targets of $5 to $25 and even $50, turning 1,000 XRP into $5,000 or $50,000 under moderate expectations.

The strategy emphasizes incremental profit-taking instead of waiting for extreme highs. He stressed that success is less about predicting the top and more about disciplined execution.

Shiba Inu Blockchain Transactions Plunge by Over 80% in 24 Hours

0

Days after a sharp spike in daily transactions, the Shiba Inu Layer-2 network, Shibarium, has recorded a steep decline in activity. 

Specifically, daily transactions on Shiba Inu’s blockchain plunged more than 85% within 24 hours, reversing an earlier surge that briefly pushed network activity above 10,000. Although the drop initially raised concerns, the underlying data suggests a more nuanced explanation. 

Key Points 

  • Shiba Inu’s network’s daily transaction volume has plunged by more than 85% to 1,580. 
  • The drop coincides with major infrastructure upgrades across the Shibarium ecosystem. 
  • Shibarium explorer currently displays incomplete data across key metrics, with total transactions showing around 1.36 billion instead of the actual 1.56 billion. 
  • Development in the ecosystem is advancing with Layer-3 scaling initiatives such as Shib Alpha and Shib Claw, currently in beta testing.  

Shibarium Transaction Volume Dips 88%

Last week, Shibarium gained momentum, with daily transactions rising to 10,940 on March 26, the highest level in weeks. For context, activity had remained below 2,000 since February 2026, making the spike particularly striking.

However, the surge quickly faded, as transactions fell to 1,230 the following day, marking an 88.75% drop within 24 hours. At press time, daily transactions stood at 1,580, down 85.55% from the March 26 figure. 

Consequently, the sharp decline reignited debate, with many attributing it to weakening user engagement. 

Shibarium Daily Transactionn
Shibarium Daily Transactions

Factors Behind the Drop in Transaction Volume

Typically, such a massive drop signals reduced network interaction. However, Shibarium is currently undergoing major infrastructure upgrades, which have influenced the explorer’s stats. Ongoing upgrades focus on migrating to new servers, performing a full chain re-index, and rebuilding Shibariumscan, its explorer. 

As a result, the explorer now displays incomplete data across key metrics, including transaction volume, wallet addresses, and total blocks. For instance, as of today, the explorer showed around 1.36 billion total transactions, while the actual figure stands closer to 1.56 billion. Similarly, the total number of blocks appeared lower than pre-upgrade levels due to ongoing re-indexing. 

Meanwhile, transaction counts may spike intermittently as indexing progresses. Even so, most recent activity consists of smart contract calls, largely bot-driven, rather than genuine user wallet interactions. Some transactions are also labeled “Value 0 BONE,” reinforcing this trend.

At the same time, the decline aligns with broader market sentiment, as investor confidence remains subdued amid extreme fear conditions.

Shiba Inu Blockchain Still Operating Normally

Despite the indexing limitations, the blockchain itself continues to operate normally. The delay primarily affects the explorer’s ability to display complete transaction data, rather than the network’s actual functionality.

In the meantime, development within the ecosystem is accelerating. Developers are actively working on Layer-3 scaling solutions, including Shib Alpha and Shib Claw, both of which are currently undergoing beta testing.

Although transaction volumes have dipped slightly, Shiba Inu has recorded modest gains. The token briefly climbed above $0.000006 and, at press time, traded around $0.000006033, up 3.6% over the past 24 hours.

Bitcoin Vulnerable as Bitfinex BTC/USD Longs Hit Highest Level Since November 2023

0

A surge in leveraged long positions on Bitfinex is raising fresh concerns about Bitcoin near-term trajectory, with analysts warning that the market may be vulnerable to further downside despite recent price stability.

Key Points

  • BTC/USD long positions on Bitfinex have reached 79,343, the highest level since November 2023.
  • Historically, sharp increases in Bitfinex long positions have often preceded price declines rather than sustained rallies.
  • Macroeconomic pressures, including rising oil prices and geopolitical tensions, are adding to market uncertainty.
  • Short positions on Coinglass have surged more than 52% in just two days, indicating growing bearish sentiment.

Rising Leverage Signals Potential Weakness

Bitcoin is beginning to show signs of fragility as bullish bets on the Bitfinex exchange continue to climb. Notably, the latest data shows BTC/USD long positions have reached 79,343, their highest level since November 2023.

At first glance, rising longs might typically signal confidence. However, historical patterns suggest a more cautious interpretation. In fact, in past cycles, similar spikes in leveraged positions have often preceded price declines rather than sustained rallies.

Currently, Bitcoin is trading near $67,740, up about 2% over the past 24 hours. Nevertheless, this short-term strength does little to offset a broader sense of instability, particularly after the asset retreated from levels above $100,000 last year.

Contrarian Signal Emerges

To better understand the current setup, analysts are turning to historical relationships between leverage and price action. Notably, sharp increases in Bitfinex long positions have frequently aligned with market tops.

One example occurred in late 2025, when BTC/USD longs rose by roughly 30% during the final quarter. Instead of fueling a rally, Bitcoin’s price fell 23% to $87,550 following its record high of $126,080 on October 6, 2025.

Consequently, this pattern has led many analysts to treat excessive bullish positioning as a contrarian indicator, where heightened optimism often precedes downward moves.

In this context, Bitcoin’s current consolidation between $65,000 and $75,000 appears increasingly vulnerable. The latest surge in longs suggests the range may ultimately break to the downside, extending the ongoing correction.

Spot Price and Bitfinex Long Positions Relationship

Macroeconomic Pressures Add to Bearish Outlook

Beyond technical factors, broader economic conditions are also shaping market sentiment. For instance, the latest reports about potential U.S. military involvement in the Iran conflict have introduced fresh uncertainty.

At the same time, rising oil prices are adding inflationary pressure. This, in turn, has intensified concerns about a possible Federal Reserve rate hike. Such developments typically reduce investor appetite for riskier assets, including cryptocurrencies.

Therefore, these macro factors are reinforcing the cautious outlook already suggested by market indicators.

Analysts Outline Downside Scenarios

Given these converging risks, several analysts have put forward bearish projections using a range of methodologies.

For context, on-chain analyst Willy Woo recently suggested Bitcoin could fall to between $46,000 and $54,000, a potential decline of around 33% from current levels. His outlook is based on the CVDD Floor model, which tracks long-term holder behavior to estimate market bottoms. According to Woo, the current floor sits near $45,500 and is gradually rising.

In addition, he highlighted a decline in total capital allocated to Bitcoin since November. This suggests that weakening inflows may further limit upside momentum.

Meanwhile, analyst Ali Martinez warned of a deeper drop to $42,100 if selling pressure accelerates. 

Similarly, veteran trader Peter Brandt echoed bearish sentiment, identifying a bear flag pattern on the weekly chart that could drive prices toward $49,000.

Market Sentiment Turns Increasingly Negative

Adding to these concerns, market positioning data reflects a clear shift in sentiment. According to Coinglass, short positions have surged by more than 52% within just two days.

This rapid increase highlights growing confidence among traders expecting lower prices. When combined with the rise in long positions, it signals a market environment marked by heightened tension and volatility.

Overall, the combination of elevated leverage, weakening inflows, bearish technical patterns, and macroeconomic uncertainty suggests Bitcoin may be entering a more challenging phase.

Ultimately, while no single indicator guarantees a downturn, the alignment of these signals points toward a cautious near-term outlook as traders brace for potential downside risk.

Shiba Inu Signals Early Momentum Shift as 23,537,600,000 SHIB Leave Exchanges

0

Shiba Inu is beginning to show early signs of a potential momentum shift, as more than 23 billion SHIB tokens have been withdrawn from crypto exchanges within the past 24 hours.

Although Shiba Inu remains in a broader downtrend, subtle behavioral changes, particularly in exchange flows and wallet activity, suggest that selling pressure is easing while accumulation is gradually emerging. 

Key Points

  • Shiba Inu flashes early signs of a potential momentum shift, as exchange outflows are beginning to outweigh inflows.
  • More than 23 billion SHIB tokens moved off crypto exchanges within 24 hours.
  • Active receiving addresses rose by 0.91% over the same period, reaching approximately 91.
  • Despite these signals, SHIB remains under bearish pressure, down 1.24% on the day and 1.31% over the past month. 

Over 23B SHIB Leave Exchanges 

Shiba Inu’s exchange netflows, which measure the difference between inflows and outflows on trading platforms, currently stand at -23.537,600,000 (23.53 billion) SHIB. This negative reading confirms that users are withdrawing significantly more tokens than they are depositing, with roughly 23.53 billion SHIB exiting exchanges.

As investors move these tokens into private wallets, they signal that aggressive selling is slowing, while some market participants may be positioning for potential future gains.

Moreover, the decline in exchange-held supply supports short-term price stabilization. Despite this outflow trend, Shiba Inu’s exchange reserves remain elevated at 81.27 trillion SHIB. However, reserves have declined by 0.03% over the past 24 hours, reflecting a gradual reduction in exchange supply. 

Shiba Inu exchange metrics

Active Receiving Address Spikes, but SHIB Remains in Bearish Zone  

Further, network activity is improving modestly. Data from CryptoQuant shows that active receiving addresses have increased by 0.91% over the past 24 hours, reaching approximately 91. This uptick indicates that demand persists, even as broader market sentiment remains cautious.

Despite these early signs of a momentum shift, Shiba Inu continues to face bearish pressure following Friday’s broader market pullback. At press time, SHIB has declined by 1.24% over the past 24 hours and 1.31% over the past month. It currently trades below the $0.000006 level, with a price of $0.000005722 per token.

Meanwhile, trading activity has weakened significantly. Shiba Inu’s volume has dropped by 25% in the last 24 hours to $70.8 million. As a result, although selling pressure appears to be easing, the lack of strong volume and broader market support suggests that the current phase may still represent a temporary pause rather than the start of a sustained upward trend. 

Shiba Inu Sees Net Outflow of 97,177,600,000 Tokens in 24 Hours—Whales Buying the Dip?

0

Shiba Inu, the second-largest meme coin by market cap, has seen a bullish exchange activity aligning with its price action in the past 24 hours.

Shiba Inu (SHIB) has rebounded 5% on the day, joining a broader market trend. While the broader recovery has played a key role, exchange activities appear to be another major contributing factor to the market recovery attempt.

Key Points

  • In the past 24 hours, CryptoQuant noted that a net total of 97,177,600,000 SHIB tokens flowed out of exchanges.
  • Negative netflows suggest that the SHIB exchange reserve is depleting, with holders preferring self-custody.
  • The CryptoQuant metric overview also shows that active addresses and active sending addresses in the Shiba Inu ecosystem are increasing.
  • From a technical perspective, Shiba Inu appears to be finally breaking out of a descending trendline on the 1-day chart.

Shiba Inu Bulls on Top

Data from CryptoQuant shows that the Shiba Inu exchange netflow has finally turned negative. In the real sense, “negative” here is bullish for the meme coin, as it indicates outflows are now larger than inflows.

In the past 24 hours, the market intelligence platform reported that a net total of 97,177,600,000 SHIB tokens flowed out of exchanges after subtracting outflows from inflows.

Shiba Inu Netflow/CryptoQuant

Notably, negative netflows suggest that the SHIB exchange reserve is depleting, with holders preferring self-custody. This does not just reduce selling pressure but signals accumulation over distribution. Moving tokens out of trading platforms suggests an intention to keep the stash longer, reinforcing confidence in the asset’s mid- and long-term prospects.

Interestingly, this comes at a time when SHIB is struggling to find its bullish footing. While it has recovered in the past 24 hours, it has corrected substantially in higher timeframes. For context, the meme coin is down 59% from its September high of $0.0000148 and has recorded seven consecutive monthly drawdowns since last August.

As such, this accumulation suggests that holders believe the bearish momentum could finally be nearing its end. This dip-buying near key local support levels signals that selling pressure is fading, and, if this persists, it could provide the much-needed catalyst for a sustained recovery.

Shiba Inu Active Address Rises

The CryptoQuant metric overview also shows that active addresses in the Shiba Inu ecosystem are increasing. In the past 24 hours, this indicator has increased by 1.08% to 150.375, showing that the total number of unique addresses, including senders and receivers, has grown.

The active sending addresses reflected this increased user adoption, growing 1.17% to 92.875 unique users. This hinted that a chunk of the active addresses were those moving their stash.

Moreover, Shiba Inu network adoption remains high. A recent report shows steady growth in the number of holders, with 5,000 to 12,000 new addresses added each month. The adoption has pushed the number of holders past 1.55 million.

A combination of user activity and accumulation paints a bullish scenario for SHIB. What matters most now is whether this trend will persist. If it does, it suggests that bulls are beginning to take control of the market—a scenario that precedes an impulsive price uptick.

SHIB Technical Analysis

From a technical perspective, Shiba Inu appears to be finally breaking out of a descending trendline on the 1-day chart, spurred by its nearly 6% increase since the start of today. Notably, this neckline resistance has suppressed the token’s price since a lower high formation on February 14.

Shiba Inu Breaking Out of Descending Trendline

The line capped this uptrend and has done the same for others, as seen on March 16 and 25 when it reached intraday highs of $0.00000644 and $0.00000628. A daily close above this trendline, accompanied by strong volume, would spark further uptrends.

Meanwhile, the next target is the $0.00000846 level, which aligns with the 200-day MA. From the current market price of $0.00000612, this represents a 37.8% increase.

XRP Records Worst First Quarter Since 2018

0

With Q1 2026 coming to a close this week, XRP is set to record its worst first-quarter performance since 2018 after posting a double-digit loss.

Although XRP achieved a major regulatory milestone earlier this year, the asset has still struggled to maintain upward momentum. After briefly climbing above $2 in January, XRP steadily declined throughout the quarter as institutional demand cooled and macroeconomic pressures weighed on the crypto market.

Key Points

  • XRP is about to record its worst Q1 performance since 2018, with the asset already down 26.5% with just a few hours to close the quarter. 
  • Despite starting the year on a good note and reaching $2.42, XRP has posted steady declines this quarter. 
  • Investments in XRP ETFs weakened this month as investors withdrew millions of dollars from the products. 
  • Analysts remain divided on XRP’s outlook, with some expecting a major dip below $1 to end the bearish trend. 

Strong Start Quickly Fades

Like many cryptocurrencies, XRP began 2026 on a positive note after a challenging previous year. The token opened the year at around $1.84 and quickly rallied to $2.42 on January 6, 2026. 

This early surge revived investor optimism that XRP could be heading into a strong bullish cycle. However, the rally did not last as increasing macroeconomic pressure triggered a multi-month decline, pushing the asset back below $2.

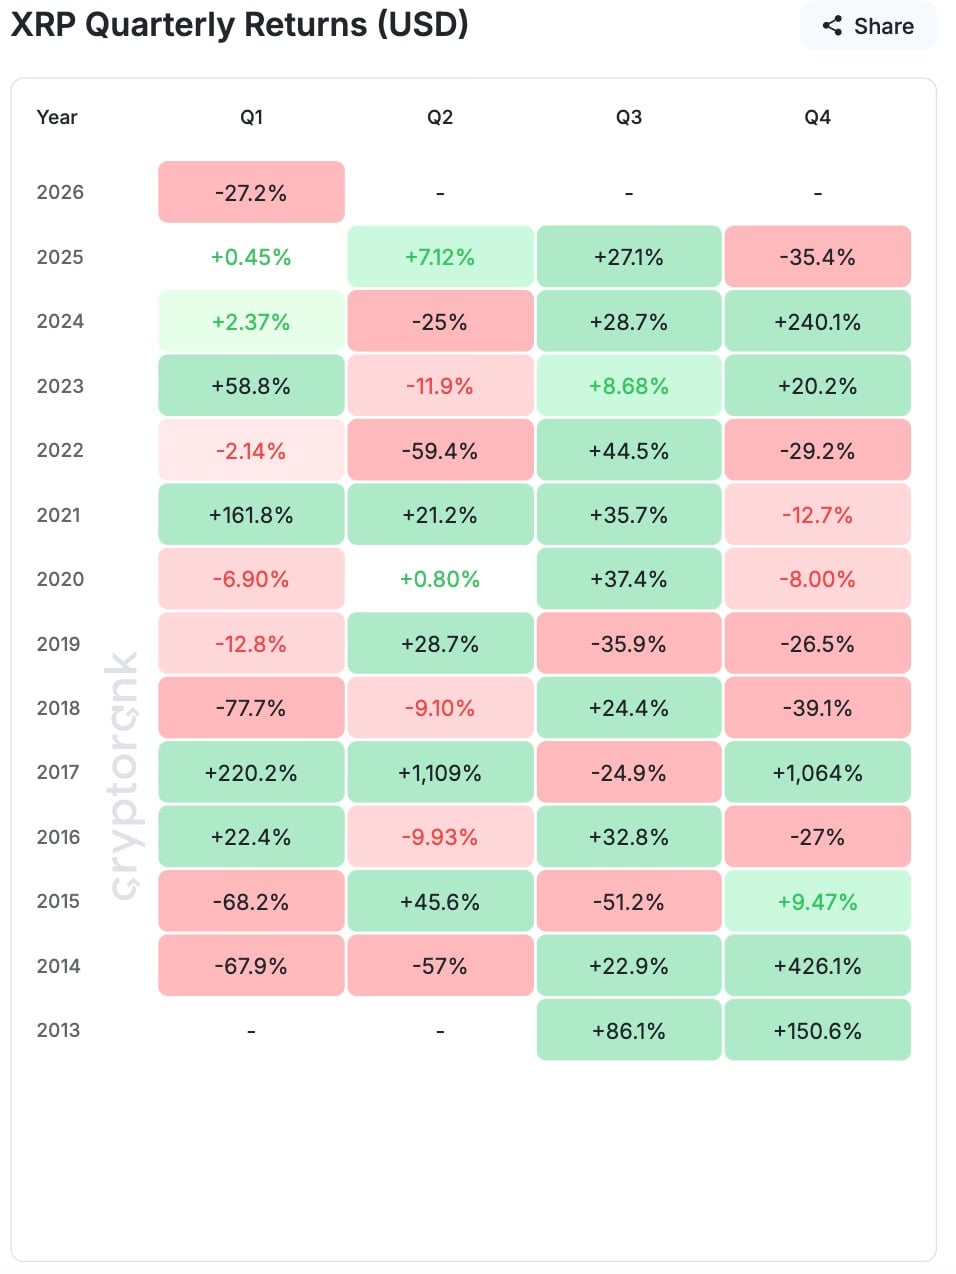
According to data from CryptoRank, XRP is set to close Q1 2026 with a decline of about 26.5%. 

Worst First Quarter Since 2018

This performance marks XRP’s weakest first quarter since 2018, the year the token reached its all-time high. For perspective, XRP ended Q1 2018 with a massive 77% loss after investors rushed to take profits following its surge to a record $3.84. 

The following years delivered mixed results. XRP recorded losses of 12.8% and 6.9% in Q1 2019 and Q1 2020, respectively. It reversed the trend in 2021 with a sharp 161% rally but slipped again in Q1 2022 with a 2.14% decline.

From 2023 through 2025, XRP posted modest gains of 58.8%, 2.37%, and 0.45%, respectively. However, the current Q1 2026 decline of about 26.5% now represents its steepest quarterly drop since 2018. 

Article image
XRP Quarterly Returns

Institutional Sentiment Wanes

Meanwhile, institutional sentiment weakened toward the end of the quarter. The launch of spot XRP exchange-traded funds (ETFs) in late 2025 initially attracted more than $1.3 billion in inflows.

However, March brought several periods of withdrawals from those investment products. Investors pulled roughly $35 million from the funds between March 6 and March 9. Additional outflows occurred later in the month, including around $6 million withdrawn on March 12.

As a result, cumulative inflows into XRP ETFs now stand at approximately $1.21 billion, while total net assets have declined to about $933 million.

Positive Milestones Despite Price Drop

Despite the price decline, XRP achieved several notable milestones this quarter. Notably, the U.S. SEC confirmed that XRP is not a security and explicitly classified it as a digital commodity.

Similarly, Ripple continued expanding its ecosystem by integrating blockchain solutions into a broader financial infrastructure stack, potentially attracting more attention to XRP.

Meanwhile, the network behind the asset, the XRP Ledger, reached a new milestone this month by surpassing 7.7 million non-empty addresses. 

Analysts Split on XRP Next Move

Despite the current downturn, some analysts remain optimistic about XRP’s outlook. For instance, Cameron Scrubs of Tradeship University believes XRP could reach a new all-time high between April and May 2026. However, he noted that the asset must first break above the key $1.70 resistance level.

On the other hand, some market observers remain cautious. Crypto analyst Casi suggested that XRP could fall further, potentially dropping to the $0.87–$1.09 range before a sustained recovery begins.

For now, XRP’s near-term direction remains uncertain, and analysts continue to urge caution as the market navigates ongoing volatility. 

Top Analyst Warns of 33% Correction Risk Before Bitcoin Finds Bottoming Structure

0

Bitcoin is entering a period of uncertainty, as analysts present sharply divergent views on its next move.

While on-chain data points to potential downside risks, institutional research suggests the market may already be stabilizing.

Key Points

  • Bitcoin faces conflicting outlooks between bearish on-chain data and bullish institutional research.
  • Willy Woo warns of a possible drop to $46,000–$54,000 based on historical on-chain models.
  • Weak capital inflows and recent price rejection above $70,000 indicate fading momentum.
  • Bearish sentiment is rising, with short positions jumping by more than 52% in two days.
  • Some analysts, including Ali Martinez, see further downside toward ~$42,100
  • Goldman Sachs suggests Bitcoin may have already bottomed and is entering a consolidation phase.

On-Chain Data Signals Downside Risk

To begin with, leading on-chain analyst Willy Woo recently outlined a cautious outlook based on blockchain data. 

In a recent post on X, he suggested Bitcoin could fall into a range between $46,000 and $54,000. This implies a potential decline of roughly 33% from its current level near $67,000.

Woo’s analysis is grounded in historical on-chain behavior, which tracks how investors interact with the network over time. A key component of his framework is the CVDD Floor model, a metric that evaluates long-term holder activity to estimate market bottoms.

According to Woo, this model currently places Bitcoin’s floor around $45,500 and indicates a gradual upward trend.

Image

Even so, he emphasized that these models are not foolproof. Bitcoin has gone through only four major downturns, all within broader bullish conditions. As a result, Woo warned that if these patterns fail, the market could enter a deeper and less predictable decline.

Weak Momentum Reflected in Market Data

Building on this cautious outlook, other indicators also suggest weakening momentum. Woo noted that the total capital held in Bitcoin has been declining since November, signaling reduced inflows.

At the same time, recent price action reinforces this trend. Bitcoin struggled to hold above the $70,000 level and quickly lost ground. Last Friday, the price dropped from $71,343 to $65,604 within a few hours.

Since then, the market has remained under pressure. Bitcoin is currently trading around $67,374, marking a weekly decline of about 2%, according to CoinGecko.

Other Analysts and Institutions Offer Mixed Views

While Woo’s analysis points to downside risk, other experts offer different interpretations. For instance, Ali Martinez believes Bitcoin could fall even further, potentially reaching $42,100.

His projection is based on historical four-year cycles, which often guide long-term market behavior. He also observed that current price patterns resemble those seen in 2022, suggesting the correction may not be over yet.

Image

Meanwhile, market sentiment appears increasingly bearish. Data from Coinglass shows that short positions have surged by more than 52% in just two days.

However, such extreme positioning can sometimes lead to the opposite outcome. If Bitcoin begins to rise, traders betting against it may be forced to buy back in quickly. This could trigger a short squeeze, accelerating upward movement.

Institutional Research Points to Stabilization Phase

In contrast to these bearish signals, institutional research presents a more optimistic scenario. Goldman Sachs recently suggested that Bitcoin may have already reached its cycle bottom at $70,000.

According to the bank, the market could now be entering a consolidation phase rather than continuing its decline. This shift is attributed to easing selling pressure from leveraged traders and improving liquidity across exchanges.

Additionally, early indications of renewed institutional participation point to cautious but growing confidence among larger investors.

Market at a Crossroads

Taken together, these perspectives highlight a market at a critical juncture. Woo’s on-chain analysis signals potential downside, while institutional insights suggest stabilization may already be underway. 

With sentiment divided and volatility still elevated, Bitcoin’s near-term direction will likely depend on how these opposing forces evolve in the weeks ahead.