Home Blog Page 189

Goldman Sachs Calls $70K Bitcoin Bottom After 45% Bloodbath

0

Bitcoin may be nearing its bottome after a prolonged decline, according to a recent research note from Goldman Sachs.

Early signs of stabilization are emerging across the crypto market. The bank points to easing selling pressure and improving market balance as key indicators that the worst of the downturn could be passing.

Supporting this view, analyst James Yaro suggests Bitcoin likely established support near $70,000 following a sharp correction. After climbing to approximately $126,000, the asset fell roughly 45% and was trading around $68,562 at the time of the report, slightly below the projected stabilization range.

Key Points

  • Goldman Sachs signals that Bitcoin may have found a support level near $70,000 after a steep 45% correction.
  • Forced selling is declining, easing pressure and helping the crypto market rebalance.
  • Institutional investors are showing early signs of renewed participation, indicating cautious confidence.
  • The bank is shifting its strategy toward utility-focused assets such as XRP, reflecting long-term growth potential.
  • Crypto-related stocks, including Coinbase and Figure Technologies, are gaining favor amid market stabilization.
  • Market recovery is expected to be gradual through 2026, driven by institutional inflows and a more resilient structure.

Decline in Forced Selling Supports Bitcoin Market Balance

A major driver behind the emerging stability is the decline in forced selling. Goldman Sachs highlights reduced outflows from exchange-traded funds and large institutional holders as a critical shift. Consequently, with less urgent liquidation, the market has begun to rebalance.

At the same time, the excess optimism that characterized the post-2025 rally has largely dissipated. This cooling of sentiment suggests Bitcoin is transitioning into a consolidation phase rather than continuing its downward trajectory.

Although macroeconomic headwinds, such as tight monetary policy and geopolitical risks, remain in place, their influence now appears more contained.

In parallel, liquidity conditions are gradually improving. However, Goldman notes that this recovery remains uneven across different trading venues.

Institutional Investors Show Early Signs of Return

As market conditions stabilize, institutional investors are beginning to re-engage. Goldman Sachs observes early signs of renewed participation, although positioning remains cautious.

Importantly, the bank stops short of calling a full recovery. Instead, it highlights that trading behavior has become more consistent, suggesting a healthier and more stable market environment. 

This shift is further supported by the firm’s own disclosures, which show approximately $2.36 billion in exposure to Bitcoin and Ethereum ETFs as of late 2025. Such figures indicate that institutional interest has not disappeared, even during the downturn.

Crypto Stocks Gain Favor Amid Market Reset

Beyond digital assets, Goldman Sachs sees growing opportunities in crypto-related equities as the market resets.

For instance, the bank has maintained a positive outlook on Coinbase Global, assigning a price target of $235 despite a recent earnings miss. This confidence reflects strong retail engagement and continued expansion into institutional products, including developments within Coinbase’s “Base” ecosystem.

Similarly, Goldman has raised its price target for Figure Technologies to $42, citing rapid growth in its blockchain-based lending platform. This underscores a trend toward real-world applications driving value in the sector.

Strategic Shift Toward Utility-Focused Assets

In addition to its market outlook, Goldman Sachs has made notable adjustments within its own portfolio. Recent regulatory filings reveal a significant increase in exposure to XRP-focused ETFs.

Specifically, the bank now holds approximately $152 million across four funds, making it the largest institutional investor in this category. At the same time, it has reduced its spot Bitcoin ETF holdings by about 40%.

While this repositioning has not yet translated into a significant price surge for XRP, it reflects growing confidence in its long-term potential.

Outlook Points to Gradual Recovery in 2026

Looking forward, Goldman Sachs believes the current market structure is more resilient than in previous cycles. However, trading volumes remain below 2025 highs, indicating that a full recovery is still unfolding.

In the near term, the bank anticipates a modest slowdown in revenues, with a typical trough period lasting around three months. Beyond that, a recovery could take shape in the second half of 2026.

This rebound is likely to be driven by renewed institutional inflows into regulated market participants, particularly in the evolving post-GENIUS Act environment. Taken together, these trends suggest that while the market may have moved past its most severe phase, the path to full recovery will be gradual rather than immediate.

XRP Is at Risk of Retesting the Lows Around $0.70

0

XRP has suffered considerable declines since the ongoing downtrend began, but chart data shows steeper drops may be on the horizon.

XRP has recently shown signs of fading strength after a short-lived recovery. The asset climbed to a local high of $1.6 on March 17 but has since reversed course, declining steadily over the following five days. At the time of analysis, XRP trades at $1.35, marking a 15% drop from its March peak. 

This pullback reflects growing selling pressure and weakening bullish momentum in the short term. Repeated rejections at the $1.41 to $1.5 zone, alongside bearish technical signals, now suggest that a possible move below $1 could emerge.

Key Points

  • XRP rose to $1.6 on March 17 but dropped 15% to $1.35 within five days, showing weakening short-term momentum based on data.
  • Data shows a key support zone between $1.41 and $1.50 broke in early February during the downward push at the time.
  • XRP has made multiple failed attempts to reclaim the $1.41-$1.50 range, but each has resulted in pullbacks.
  • Current price structure suggests a possible drop to $1.1 first, with further downside toward $0.70, representing about a 48% decline from $1.35.
  • A move above $1.80 to $2 would invalidate the bearish outlook.

Key XRP Support Turned Resistance Remains a Major Barrier

This is according to a recent chart analysis from market watcher Knight. Data from his daily chart shows an important technical development that has continued to weigh on XRP’s price. 

Notably, during the late January to early February crash, XRP broke below a crucial support range between $1.41 and $1.50. This breakdown occurred as the price fell from around $1.9 on Jan. 28, eventually breaching the support zone on Feb. 4 and dropping further to a floor of $1.1 by Feb. 6.

Although XRP quickly rebounded from the $1.1 low, it has consistently struggled to reclaim the $1.41 to $1.50 range. This area has now flipped into a resistance zone, creating a ceiling that limits upward movement. Multiple attempts to break above this range have failed, confirming its importance in the current market structure.

One attempt saw XRP rise to $1.51 on Feb. 14, followed by a brief consolidation between $1.44 and $1.41 until Feb. 17 before another decline. 

A similar pattern emerged in mid-March when XRP climbed to $1.55 on March 16 and traded between $1.43 and $1.5 until March 19, only to face rejection again. These repeated failures confirm that bulls lack the strength to reclaim this zone as support.

XRP Downside Targets Point to $0.70 Risk

Knight’s analysis suggests that XRP could revisit lower levels if the current trend persists. Specifically, the chart indicates a possible drop back to the Feb. 6 low of $1.1. According to this outlook, XRP may stabilize briefly around that level, consolidating for several days before continuing its downward move.

XRP 1D Chart Knight
XRP 1D Chart | Knight

After $1.1, the chart pointed to a deeper target near $0.7. Reaching this level would require a 48% decline from the current price. Notably, XRP last traded around $0.7 in mid-November 2024, during the major upward surge that occurred at the time.

Multiple Analysts Echo Bearish Outlook

Knight is not the only one forecasting further downside. Other analysts have also projected declines below $1, though their exact targets differ. For instance, market analyst Casi previously warned during XRP’s earlier rally that the price action resembled a temporary bounce, not a sustained recovery.

Casi called attention to a breakdown below a long-standing consolidation trendline, which has since started acting as resistance. This development suggests that XRP may be completing a corrective bounce before entering another downward phase. Casi identified a potential move toward $0.87 as part of this structure.

Another analyst, Chart Nerd, confirmed the bearish outlook by highlighting a macro fractal pattern. According to him, XRP could target the $0.80 to $0.70 range if it fails to hold current lows heading into the second and third quarters. 

He noted that the lower Gaussian Channel, which has been trending upward since December 2025, currently rests at $0.73, aligning with his lower target. Meanwhile, Chart Nerd also noted that reclaiming higher levels between $1.80 and $2 would invalidate this bearish scenario. 

XRP Open Interest Approaches $1B While Price Drops: Here’s What’s Happening

0

XRP is facing renewed selling pressure after failing to hold its recent rebound, but Open Interest has continued to rise despite the price crash.

While the price has dropped from its March high of $1.6, XRP’s Open Interest has moved closer to the $1 billion mark, showing that traders are adding new positions rather than exiting. This indicates a strong short-term bias, but increases the risk of a short squeeze if a price spike emerges.

Key Points

  • XRP rose 26% from $1.27 on Feb. 28 to $1.60 on March 17 before dropping 15% to $1.36.
  • Despite the ongoing price downtrend, XRP’s Open Interest increased from $886 million to $946 million.
  • OI-weighted funding rates turned negative at -0.0086, confirming that short positions dominate the market.
  • Also, liquidation data shows $314 million in short positions clustered between $1.375 and $1.405, creating a strong upside trigger zone.
  • Such a situation shows bearish bias, but could lead to a short squeeze if the price spikes, possibly leading to higher price surges.

XRP Faces Renewed Pressure While Open Interest Climbs

While XRP’s price decline itself is not unusual, the steady rise in Open Interest (OI) during this period has triggered attention from market analysts. CryptoQuant author JA Maartunn pointed this out, calling the situation “juicy.” However, he also warned traders to stay cautious.

For context, XRP climbed 26% from $1.27 on Feb. 28 to reach $1.60 by March 17. However, the rally stalled at $1.60, which acted as resistance, and the price has pulled back since then. XRP now trades at $1.36, down 15% from the recent high, but it is still holding above the $1.35 support level. 

XRP Price Drops While OI Spikes Maartunn
XRP Price Drops While OI Spikes | Maartunn on X

However, the data shows that OI has moved in the opposite direction. On March 25 at 4 PM UTC, XRP traded for $1.42, with total Open Interest at $886 million. By March 26 at 9 PM UTC, the price had fallen to $1.36, yet Open Interest had climbed to $946 million. At the time of writing, the price remains around $1.36, while Open Interest has slightly eased to $933 million.

Meanwhile, data from Coinglass shows that the OI-weighted funding rate recently dropped to -0.0086. A combination of rising OI and negative funding shows traders are opening new positions as the market drops, and most of these are short positions. 

This suggests that the current price decline is being driven by traders betting against the price, not just by long holders closing their positions.

Bears Hold Control, but the Setup Is Getting Risky

In the short term, sellers are in control. Notably, they have pushed XRP down from $1.42 to $1.36 while more traders continue to enter the market. The rise in Open Interest confirms this, and the negative funding rate indicates that short positions dominate.

However, this creates a risk, as too many traders are now on the same side of the market. When this happens, trends can become unstable. Notably, if the price starts to move in the opposite direction, it can force many traders to close their positions at once. This can quickly turn a slow move into a sharp one.

XRP’s liquidation heatmap on Binance confirms the risk of a short squeeze. Specifically, around $70 million in positions sit at $1.375, and another $44.98 million is at $1.3785. In total, about $314 million in positions are spread between $1.375 and $1.405. Most of these are short positions that will be forced to close if the price rises.

XRP Liquidation Heatmap Coinglass
XRP Liquidation Heatmap | Coinglass

These levels act as a target for the market. Prices often move toward areas where large liquidations can happen because they add momentum. If XRP starts to move into this range, forced buying from closed short positions could push the price up quickly.

Two Possible Paths for XRP 

The market now points to two main outcomes. In the first scenario, XRP could fail to move back above the $1.37 level. If this happens, sellers will remain in control, the Open Interest will stay high, and the price will slowly move lower.

In the second scenario, XRP could push into the $1.375 to $1.38 range. This area would trigger the first wave of short liquidations. If this happens, forced buying could drive the price higher toward the $1.38 to $1.405 zone, where the larger $314 million cluster sits. This could lead to a fast and strong rally. During such a move, Open Interest may drop as short positions are closed.

The most important resistance area sits between $1.375 and $1.38, where the first liquidation pressure appears. Above that, the range from $1.38 to $1.405 holds the larger cluster of positions. On the downside, XRP is holding support between $1.34 and $1.36. If the price falls below this range, sellers are likely to stay in control for longer.

Ripple Reveals Plans to Improve XRP Ledger Security Using AI

0

Ripple has shared a new plan to improve the security of the XRP Ledger by leveraging AI for its development and testing processes. 

Per the disclosure, the firm plans to use AI testing, a dedicated red team, codebase improvements, and better ecosystem collaboration to maintain security as the network grows. 

These efforts follow a series of major upgrades pushed by the broader XRPL developer community between December 2025 and February 2026, many of which introduced features for attracting more institutions.

Key Points

  • Ripple recently announced that it will use AI to proactively detect and fix vulnerabilities in the XRP Ledger before they reach production.
  • The firm introduced AI-driven development tools, continuous adversarial testing, and a red team that has already identified 10+ bugs.
  • Ripple is also improving the XRPL codebase structure and collaborating with groups like XRPL Foundation and XRPL Commons to improve overall network security.
  • Between December 2025 and February 2026, the XRPL developer community pushed multiple major upgrades, including Permissioned Domains, to target institutional adoption.
  • Ripple confirmed its next XRPL release will focus entirely on bug fixes and system improvements.

Ripple Moves to Improve XRPL Security with AI Integration

Notably, the announcement came from Ayo Akinyele, Senior Director of Engineering at RippleX, in a blog post published on March 26, 2026, where he explained how the network is preparing for its next stage of growth.

Akinyele said XRPL will move toward a more proactive, AI-based system that can find and fix issues before they reach production. This plan includes AI-supported testing, a dedicated red team, and stricter checks for code updates and amendments. 

For context, the XRP Ledger has been running continuously since 2012, acting as a base for global payments, real-world asset issuance, and financial tools used by institutions. Over time, it has processed more than 100 million ledgers and handled over 3 billion transactions.

However, Akinyele pointed out that systems like XRPL naturally become more complex over the years. Earlier design choices, assumptions from when the network was smaller, and older coding patterns still affect how it works today. This is common for long-running systems, but it means ongoing improvements are necessary.

As the XRPL continues to grow in size and importance, Ripple noted that keeping it secure and stable demands constant work. The company emphasized that maintaining a strong foundation is important, especially for a system used in global finance.

Steps Behind the XRPL Security Upgrade

Ripple has leveraged several major steps for this approach. Specifically, the company is now using AI throughout the development process, including code scanning, reviewing updates, and mapping risks. AI also helps simulate extreme scenarios that would be hard to create manually.

A dedicated AI-supported red team now studies the XRPL codebase continuously and focuses on how different parts of the system work together in real situations. 

The team uses advanced testing methods, including fuzzing and simulated attacks, to find weaknesses early. So far, they have identified more than 10 bugs, though only low-risk issues have been made public, and all are being fixed.

Ripple is also working on improving the structure of the XRPL code itself. This includes fixing issues like weak type safety, inconsistent feature behavior, and unclear system rules. These updates seek to make the system easier to understand and more reliable over time.

Ripple Working With the Wider XRPL Community

Ripple highlighted that security in a decentralized system depends on many participants, not one company. It has expanded its work with groups like XRPL Commons and XRPL Foundation, along with independent researchers, validators, and external security firms.

This helps cover more areas and reduces the chances of missing problems. Ripple has also increased its standards for approving updates by requiring multiple security checks, expanding bug bounty programs, and running attack simulations to test new features.

The company plans to set security rules for future updates, working with XRPLF to make sure every change meets strict requirements before going live. It also plans to stay open with the community by sharing findings and lessons to help improve the network as a whole.

Recent XRPL Updates and What Comes Next

These plans come after several major XRPL updates between late 2025 and early 2026. On Dec. 10, 2025, the developer community released rippled v3.0.0, which introduced five major fixes on system stability, oracle ordering, MPT and escrow accounting, AMM clawbacks, and ledger metadata.

In January 2026, five major fixes were activated with over 97% consensus. Then, on Feb. 4, 2026, the Permissioned Domains (XLS-80) update went live with more than 91% consensus. This added tools for controlled access and compliance, targeting institutional adoption.

Further updates followed, including the Permissioned DEX amendment on Feb. 18, 2026. Meanwhile, rippled v3.1.0, released in January 2026, introduced SingleAssetVault and LendingProtocol features, but both are still under validator voting at press time.

Meanwhile, Ripple said its next XRPL release will focus only on fixing bugs and improving the system, without adding new features. The company wants to improve the network step by step to ensure the XRPL remains reliable and ready to support global financial use for many years.

Cardano Joins Bitcoin and XRP in Hashdex Nasdaq Crypto Index Fund

0

The Hashdex Nasdaq CME Crypto Index ETF (HDEX.BH) has officially added Cardano (ADA) to its portfolio. 

The issuer confirmed this update in its first annual Form 10-K filing submitted to the U.S. SEC this week. As a result, the ETF now offers investors exposure to seven major crypto assets, including Cardano.

Key points 

  • The Hashdex Nasdaq CME Crypto Index ETF now features seven cryptocurrencies, including Cardano. 
  • Cardano has a weight of 0.68%, trailing Bitcoin, Ethereum, XRP, and Solana, which have weights of 77.06%, 12.34%, 5.88%, and 3.35%, respectively. 
  • ADA has featured prominently in various multi-asset ETFs, including the Bitwise 10 Crypto Index Fund (BITW). 
  • It does not have a standalone spot ETF, with Grayscale’s efforts still pending.

Cardano Inclusion in Hashdex Crypto Index ETF

The fund originally launched in February 2025 with only Bitcoin and Ethereum. However, Hashdex steadily expanded its holdings. By September 2025, the ETF had grown to include five assets, adding XRP, Solana, and Stellar (XLM).

Although Hashdex had filed to include ADA and XRP as early as April 2025, it delayed ADA’s inclusion. Eventually, after multiple amended filings, Cardano joined the fund late last year, bringing the total number of supported assets to seven.

Currently, Cardano ranks fourth-largest in the ETF, with a 0.68% weighting. It trails Bitcoin (77.06%), Ethereum (12.34%), XRP (5.88%), and Solana (3.35%). Meanwhile, Chainlink and Stellar follow behind with allocations of 0.38% and 0.31%, respectively. As of March 23, the fund’s assets under management stood at $485.17 million. 

Hashdex Nasdaq CME Cryoto Index ETF Holdings

ADA Presence in Crypto ETF Market 

This development further strengthens ADA’s presence in institutional investment products. Cardano already featured in several crypto basket ETFs, including offerings from Bitwise Asset Management and Grayscale Investments. 

However, Grayscale replaced ADA with BNB in its CoinDesk Crypto 5 ETF (GDLC). Despite that setback, sentiment improved after Ark Invest, led by Cathie Wood, included Cardano in a proposed basket of 20 crypto assets. 

In that preliminary filing, ADA received a 2.29% weighting, surpassing those of Bitcoin Cash, Chainlink, Litecoin, and Sui. While ADA continues to gain traction in diversified crypto ETFs, it still lacks a standalone spot ETF. Grayscale’s efforts to launch the first Cardano spot ETF remain pending at press time. 

Ripple Is Redeploying Years of Capital Into Real Businesses for XRP: Franklin Templeton’s Crypto Exec

Franklin Templeton’s Head of Digital Assets, Roger Bayston, recently highlighted how legacy blockchain projects like Ripple and XRP are evolving.

He stated that XRP is no longer just surviving market cycles but is actively channeling accumulated capital into building real-world businesses. Bayston shared this on the Thinking Crypto podcast with Tony Edward.

Key Points

  • Ripple is shifting XRP from speculation to real-world business use, redeploying years of accumulated capital into infrastructure.
  • Franklin Templeton sees XRP’s value in the scale of financial systems around it.
  • Institutions are embracing multi-chain strategies, with firms like Franklin Templeton avoiding closed ecosystems for broader network access.
  • Tokenization is expanding beyond crypto, with XRP Ledger could benefit as real-world assets move on-chain.

Ripple’s Capital Strategy

According to Bayston, some of the earliest blockchain networks have amassed significant capital over time. Meanwhile, the next phase involves putting those resources to work.

He highlighted Ripple as a key example, noting that the company has “fantastic plans” to redeploy capital generated through XRP into building substantial businesses.

This aligns with Ripple’s recent aggressive expansion strategy, which has seen $3 billion deployed into infrastructure, including custody, liquidity, treasury management, and institutional brokerage services. The goal is to strengthen the XRP ecosystem and position it at the center of institutional finance.

Bayston’s comments reinforce the idea that XRP’s long-term value proposition may lie in the scale of infrastructure being built around it.

Multi-Chain Future, Not Walled Gardens

Bayston also made it clear that Franklin Templeton is not pursuing its own proprietary blockchain, unlike firms such as Coinbase and Robinhood.

Instead, the asset manager is betting on a multi-chain future, describing blockchains as “digital nation-states” that will evolve at different speeds.

Rather than creating a closed system, the firm plans to work across multiple networks and benefit as they develop.

In this setup, Ripple is one of the networks with the resources and strategy to remain relevant as the industry matures.

Institutional Mindset Is Changing

Furthermore, Bayston said institutional investors are still adapting to how crypto is reshaping finance. In the past, custody, trading, and infrastructure were handled by separate firms. Now, platforms are combining these services into a single system, changing how institutions participate.

This shift is happening on major platforms like Binance, Kraken, and OKX, which together serve hundreds of millions of wallets.

For Franklin Templeton, these platforms act as a new distribution channel. Specifically, Bayston calls it the “wallet ecosystem,” where financial products can be delivered directly to users on-chain.

Tokenization Expands Beyond Crypto

Beyond XRP and payments, Bayston emphasized that tokenization is expanding across asset classes.

Franklin Templeton, which manages about $1.6 trillion, is already working with tokenized money market funds and plans to expand into real estate, commodities, and securities.

He stressed that these assets do not change; they simply move into a digital format and run on blockchain. This could benefit networks like the XRP Ledger, as more real-world assets move on-chain and require liquidity and settlement.

Ultimately, Bayston believes the strongest blockchain networks, those with capital, strategy, and real-world use, will continue evolving.

For Ripple, this means using XRP’s existing capital base to build large-scale financial infrastructure, which is already playing out.

XRP 1, 2, 3 Monthly RSI Formation Progresses—What Does History Say?

0

The XRP RSI is forming a familiar pattern on the monthly timeframe, and history suggests it precedes an impulsive move upwards.

Analyst EGRAG Crypto identified this trend in his recent X post, highlighting its significance to the XRP price trend. Notably, the RSI formation usually precedes a significant price move, and the market technician seems upbeat that a similar scenario would recur.

Key Points

  • Analysis from EGRAG Crypto highlighted that a 1, 2, 3 formation is developing on the monthly XRP RSI.
  • This has happened twice before in XRP’s history, both times preceding a notable price shift.
  • The first instance of this formation occurred between late 2019 and mid-2020, and the second between June and December 2022.
  • Analysis shows that the monthly RSI appears to have made its first low, dropping to 45.35 in February.
  • If history repeats, the second and third retests could occur, with the analysis setting a target of September 2026 for their actualization.

XRP Monthly RSI Formation

EGRAG highlighted that a 1, 2, 3 formation is developing on the monthly XRP RSI. An accompanying chart provided further context using historical data.

XRP 1, 2, 3 Formation/EGRAG Crypto

This has happened twice before in XRP’s history, both times preceding a notable price shift. Specifically, the RSI makes three distinct downward movements within a range, each labeled 1, 2, and 3. Notably, this pattern signals strength, as the RSI holds above the range’s support despite downward pressure.

The first instance of this formation occurred between late 2019 and mid-2020. The monthly RSI made a low of 44.25 in December 2019. It rebounded to 46.22 a month later but revisited the range’s low in March 2020, dropping to 43.75.

Again, it rebounded but couldn’t sustain this trend. By June 2020, the RSI dropped again to 44.01, but the support proved strong once more. The analyst labeled the support visits as 1, 2, and 3.

Notably, what followed was a breakout to reach 73.69 in April 2021. Meanwhile, between the time of this breakout in July 2020 and the peak in April 2021, XRP rallied from $0.175 to a high of $1.97, representing a 1,025% increase.

Familiar RSI Pattern Forming

The second instance occurred between June and December 2022. In this case, the XRP monthly RSI dropped to 43.90 in June 2022 but found support within a range. After a brief rebound, it dropped to 43.98 a month later, but the area cushioned further weakness.

By December 2022, it was back at this range support, dropping to 44.42. Subsequently, the RSI broke out, peaking at 84.40 in January 2025. During the two-year period, the price of XRP moved from $0.338 to a high of $3.39, marking a 903% growth.

EGRAG highlighted that this pattern is repeating. The chart shows that the monthly RSI appears to have made its first low. In February, it dropped to 45.35, with the analyst marking it as 1.

If history repeats, the second and third retests could occur, with the analysis setting a target of September 2026 for their actualization. A break above 50 would confirm this breakout, with the target a surge to 80.

Typically, a surge in RSI is reflected in an asset’s price, and XRP has historically risen after the 1, 2, 3 formation. If history repeats, then XRP could surge with the RSI.

Bitcoin Faces Heavy Sell Wall at $72,500: What’s Next?

Bitcoin structure is showing signs of short-term weakness, as fresh order book data highlights an imbalance between overhead resistance and lower support liquidity.

Data shared by CoinGlass reveals that large players, or whales, have positioned strong sell orders above current price levels. At the same time, buy-side liquidity remains layered below.

Heavy Bitcoin Sell Wall Caps Upside

According to the whale order book, a dense cluster of sell orders sits between $72,300 and $72,600, forming a major resistance zone. This area represents a key hurdle for any upward movement, with significant supply likely to absorb bullish momentum on a bounce.

The presence of this “sell wall” suggests that even if Bitcoin attempts a recovery, it may struggle to break through without a surge in demand or volume.

Notably, this resistance region is already in effect, as Bitcoin’s price dipped 2.64% over the past day. It traded above $71,600 yesterday but has now fallen to $69,150 as of press time.

Layered Support Below Current Price

Meanwhile, on the downside, smaller bids are visible around $69,200, offering some immediate support. However, stronger buying interest is positioned lower, between $68,200 and $68,500.

Beyond that, deeper liquidity pockets lie in the $67,000 to $67,500 range. This is a typical market setup, with strong resistance above and buy orders spread below. Price usually moves toward areas with higher liquidity.

For Bitcoin, that means it may drop first to fill lower buy orders before any meaningful recovery. Unless BTC breaks above $72K, short-term price action still appears bearish, with a possible dip before a stronger bounce.

Meanwhile, Bitcoin also faces significant pressure from the derivatives market.

Image

More Pressure for BTC Amid $18.6B Options Expiry

As Bitcoin currently ranges between $67,700 and $71,600, traders are eyeing Friday’s $18.6 billion options expiry as a potential catalyst for a breakout.

Although call options worth $11.2 billion exceed puts at $7.4 billion, most bullish bets are placed far above current prices, making many likely to expire worthless.

At current levels, put options hold a slight advantage across most price ranges below $75K. For bulls to take control, Bitcoin needs roughly a 6% move above $75K before expiry.

Meanwhile, macro pressure, rising oil prices, and economic uncertainty have strengthened the bearish case. The war in the Middle East continues to escalate, and there has been no indication of the Strait of Hormuz reopening anytime soon, causing further spikes in oil prices, which is bearish for crypto.

Multiple Market Signals Suggest It May Be Too Early to Call the Bitcoin Bottom

Multiple Bitcoin signals, including on-chain metrics and volatility patterns, suggest it may be too early to call the bottom.

Bitcoin is still under pressure as the downtrend that started in Q4 2025 continues, with some analysts suggesting that an initial drop to $60,000 marked the bottom. However, the alignment of on-chain metrics suggests it may be too early to call the bottom.

Key Points

  • Bitcoin has dropped 20.42% in 2026, currently changing hands for $69,500 after failing to hold above the $76,000 peak earlier this month.
  • The Bitcoin price initially crashed to $60,000 in early February 2026, marking a 52% drop from the $126,000 ATH, before recovering.
  • Analysts in the crypto space now remain divided on whether this $60,000 low marked the bottom or if Bitcoin could see steeper price declines.
  • Data indicates that current market signals, including on-chain metrics, volatility patterns, and capital inflows, have not yet aligned enough to confirm a market bottom.
  • Past cycles show Bitcoin can still reach a bottom even while the dollar rises, with similar patterns seen in 2011, 2014, and 2018-2019, unlike the unique macro conditions of 2022.

It May Be Too Soon to Confirm a Bitcoin Bottom

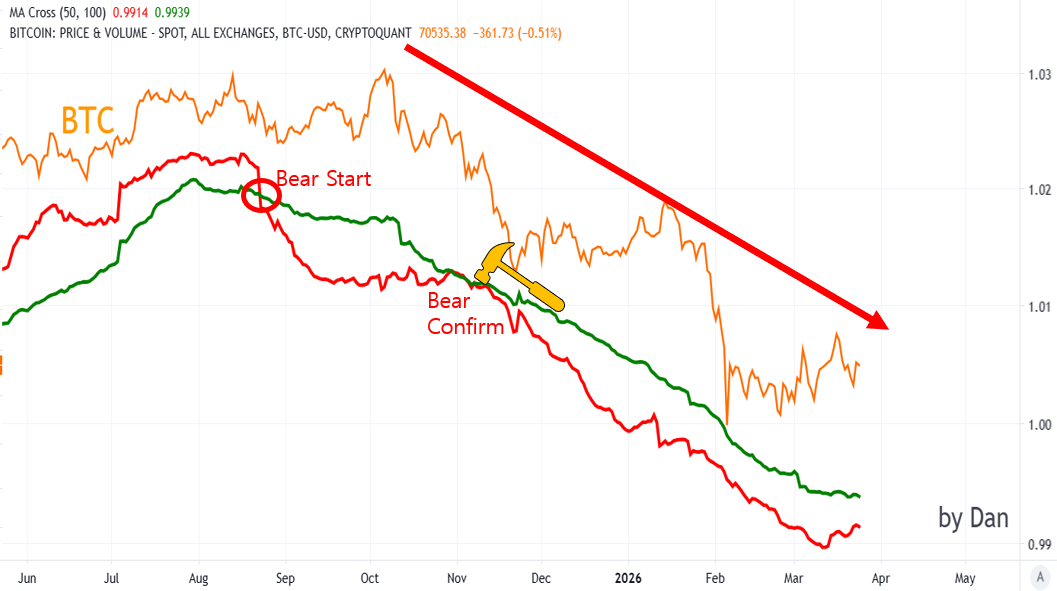
Analyst Dan from CryptoQuant highlighted this position in a recent report. For context, last month, Bitcoin fell to $60,000, which marked a 52% decline from its October 2025 all-time high of $126,000. Although the price has bounced from that low, there is still no agreement among analysts on whether that point was the true bottom or if more downside could still happen.

Dan believes these bottom calls are too soon. He explained that the market has not yet shown signs of a shift from a medium- to long-term downtrend into an uptrend. According to him, while Bitcoin’s move around the $60,000 level and some indicators may suggest a possible bottom, these signs are not strong enough to confirm it.

He added that a real bottom can only be confirmed when there is clear and steady evidence across on-chain data, volatility patterns, and capital inflows. He believes that until those signals appear together, it is still too early to say that Bitcoin has reached its lowest point. However, Dan failed to highlight these signals explicitly.

The market watcher discussed this while sharing an accompanying chart confirming that the Bitcoin bear market began in August 2025 when the 50 EMA crossed below the 200 EMA. However, the bear market was confirmed in November 2025 when the 50 EMA attempted to cross above the 200 EMA but failed.

Bitcoin 50 and 100 EMAs Dan
Bitcoin 50 and 100 EMAs | Dan

Stronger Dollar Could Keep Pressure on Bitcoin

Meanwhile, investment firm Trading Shot analyzed Bitcoin’s next possible direction through its relationship with the U.S. Dollar Index (DXY). They pointed out that Bitcoin usually rises when the dollar weakens and falls when the dollar gains strength.

They stressed that the dollar could be stepping into a new rally, while Bitcoin has already been in a bear market since last October. According to their analysis, the dollar reached a bottom in June 2025 and has been building a strong base since then, which often leads to a longer upward move.

The current situation resembles past cycles. Specifically, in 2011, Bitcoin still found a bottom even as the dollar was rising. In 2014, the dollar moved up strongly, but Bitcoin still reached a normal bear market bottom without crashing further. A similar pattern appeared in 2018-2019, when the dollar rose more slowly while Bitcoin moved into a new bull phase.

Bitcoin 1M Chart Trading Shot
Bitcoin 1M Chart | Trading Shot

However, 2022 was different. At that time, Bitcoin bottomed almost exactly when the dollar peaked and started to fall sharply. The period was affected by special factors like the COVID-related money printing, rising inflation, and the economic impact of the Russia-Ukraine war, which pushed energy prices higher. 

Based on this comparison, Trading Shot believes the current cycle is more like earlier ones, meaning the dollar could keep rising while Bitcoin continues its slow decline, possibly reaching a bottom in Q4 2026.

Current Fear Levels Create Opportunity

Interestingly, Michaël van de Poppe revealed last month that he believes Bitcoin may already be close to the bottom of its current cycle. He mentioned past moments when the fear and greed index dropped to very low levels, such as during the COVID-19 crash and the Terra collapse.

In those periods, Bitcoin later recorded gains of about 1,800% and 900%. Considering these signals, the market veteran suggested that times of extreme fear often create good opportunities to enter the market. At the time of his analysis, the Fear and Greed Index had reached extreme fear.

Fannie Mae Moves to Accept Bitcoin and USDC as Mortgage Collateral

0

Fannie Mae is taking a significant step toward integrating digital assets into mainstream housing finance by introducing a new mortgage model that allows borrowers to use Bitcoin and USDC as collateral.

The initiative signals a broader shift in traditional lending, reflecting the growing influence and acceptance of cryptocurrency within institutional finance.

Key Points

  • Fannie Mae is developing a mortgage framework that accepts Bitcoin and USDC as collateral for home loans.
  • The initiative is being built in partnership with Coinbase and Better Home & Finance to combine crypto custody with traditional mortgage infrastructure.
  • Borrowers can pledge crypto without selling it, thereby retaining ownership and avoiding taxable liquidation events.
  • The structure removes margin calls, meaning borrowers are not forced to post additional collateral during declines in cryptocurrency prices.
  • Crypto-backed mortgages are expected to carry higher interest rates (about 0.5%–1.5% above standard loans) due to added risk and complexity.

Crypto Enters Mainstream Mortgage Lending

Under the new framework, qualified homebuyers can leverage holdings in Bitcoin and the USDC stablecoin to support their mortgage applications. The program is being rolled out in partnership with Coinbase and Better Home & Finance, combining established mortgage infrastructure with crypto custody and liquidity solutions.

The development, first reported by The Wall Street Journal, underscores increasing institutional confidence in crypto-backed financial products and their role in real-world applications.

How the New Mortgage Structure Works

At the core of the model is a custody-based system designed to make crypto usable without forcing liquidation. Borrowers transfer their digital assets into a secure wallet managed by Better, while retaining legal ownership.

This approach allows buyers to avoid selling their crypto at the point of purchase, bypassing potential tax liabilities that have historically limited the use of digital assets in large transactions.

For USDC holders, the structure offers an additional advantage: they can continue earning yield on their stablecoins even while those funds are pledged as collateral, improving capital efficiency.

Balancing Flexibility With Cost

The added flexibility comes at a price. Crypto-backed mortgages are expected to carry interest rates roughly 0.5 to 1.5 percentage points higher than standard 30-year loans, with final terms depending on borrower risk profiles, according to Coinbase.

However, the model addresses one of the biggest drawbacks of crypto lending—volatility risk. Unlike typical crypto-backed loans, these mortgages do not involve margin calls. Even if Bitcoin prices fall, borrowers are not required to post additional collateral.

This eliminates forced liquidations tied to market swings and introduces a level of stability more consistent with traditional mortgage products.

Familiar Risk Framework

Despite the novel collateral, the underlying risk structure remains aligned with conventional lending standards. Borrowers face liquidation only after missing payments for 60 days, mirroring traditional mortgage delinquency rules.

By prioritizing predictability over rapid asset liquidation, the model bridges a critical gap between crypto finance and established housing norms.

Momentum Across the Industry

Fannie Mae’s move follows earlier guidance from U.S. housing authorities urging both it and Freddie Mac to explore how digital assets could factor into mortgage qualification.

Since then, regulators have been studying how crypto holdings might factor into borrower evaluations. This signals a broader policy shift toward recognizing digital wealth.

Meanwhile, private lenders are also moving in the same direction. For context, Newrez has begun evaluating Bitcoin and Ethereum as part of its mortgage qualification process, reflecting growing industry-wide adoption.

Toward a Hybrid Financial Future

Taken together, these developments point to a gradual but meaningful transformation in housing finance. Cryptocurrencies are increasingly being treated not just as speculative instruments, but as usable components of personal balance sheets.

By allowing borrowers to retain ownership while unlocking liquidity, Fannie Mae’s model creates a practical bridge between traditional lending and digital finance—one that could reshape how future homeowners fund their purchases.