Home Blog Page 190

Bitcoin Faces Heavy Sell Wall at $72,500: What’s Next?

Bitcoin structure is showing signs of short-term weakness, as fresh order book data highlights an imbalance between overhead resistance and lower support liquidity.

Data shared by CoinGlass reveals that large players, or whales, have positioned strong sell orders above current price levels. At the same time, buy-side liquidity remains layered below.

Heavy Bitcoin Sell Wall Caps Upside

According to the whale order book, a dense cluster of sell orders sits between $72,300 and $72,600, forming a major resistance zone. This area represents a key hurdle for any upward movement, with significant supply likely to absorb bullish momentum on a bounce.

The presence of this “sell wall” suggests that even if Bitcoin attempts a recovery, it may struggle to break through without a surge in demand or volume.

Notably, this resistance region is already in effect, as Bitcoin’s price dipped 2.64% over the past day. It traded above $71,600 yesterday but has now fallen to $69,150 as of press time.

Layered Support Below Current Price

Meanwhile, on the downside, smaller bids are visible around $69,200, offering some immediate support. However, stronger buying interest is positioned lower, between $68,200 and $68,500.

Beyond that, deeper liquidity pockets lie in the $67,000 to $67,500 range. This is a typical market setup, with strong resistance above and buy orders spread below. Price usually moves toward areas with higher liquidity.

For Bitcoin, that means it may drop first to fill lower buy orders before any meaningful recovery. Unless BTC breaks above $72K, short-term price action still appears bearish, with a possible dip before a stronger bounce.

Meanwhile, Bitcoin also faces significant pressure from the derivatives market.

Image

More Pressure for BTC Amid $18.6B Options Expiry

As Bitcoin currently ranges between $67,700 and $71,600, traders are eyeing Friday’s $18.6 billion options expiry as a potential catalyst for a breakout.

Although call options worth $11.2 billion exceed puts at $7.4 billion, most bullish bets are placed far above current prices, making many likely to expire worthless.

At current levels, put options hold a slight advantage across most price ranges below $75K. For bulls to take control, Bitcoin needs roughly a 6% move above $75K before expiry.

Meanwhile, macro pressure, rising oil prices, and economic uncertainty have strengthened the bearish case. The war in the Middle East continues to escalate, and there has been no indication of the Strait of Hormuz reopening anytime soon, causing further spikes in oil prices, which is bearish for crypto.

Multiple Market Signals Suggest It May Be Too Early to Call the Bitcoin Bottom

Multiple Bitcoin signals, including on-chain metrics and volatility patterns, suggest it may be too early to call the bottom.

Bitcoin is still under pressure as the downtrend that started in Q4 2025 continues, with some analysts suggesting that an initial drop to $60,000 marked the bottom. However, the alignment of on-chain metrics suggests it may be too early to call the bottom.

Key Points

  • Bitcoin has dropped 20.42% in 2026, currently changing hands for $69,500 after failing to hold above the $76,000 peak earlier this month.
  • The Bitcoin price initially crashed to $60,000 in early February 2026, marking a 52% drop from the $126,000 ATH, before recovering.
  • Analysts in the crypto space now remain divided on whether this $60,000 low marked the bottom or if Bitcoin could see steeper price declines.
  • Data indicates that current market signals, including on-chain metrics, volatility patterns, and capital inflows, have not yet aligned enough to confirm a market bottom.
  • Past cycles show Bitcoin can still reach a bottom even while the dollar rises, with similar patterns seen in 2011, 2014, and 2018-2019, unlike the unique macro conditions of 2022.

It May Be Too Soon to Confirm a Bitcoin Bottom

Analyst Dan from CryptoQuant highlighted this position in a recent report. For context, last month, Bitcoin fell to $60,000, which marked a 52% decline from its October 2025 all-time high of $126,000. Although the price has bounced from that low, there is still no agreement among analysts on whether that point was the true bottom or if more downside could still happen.

Dan believes these bottom calls are too soon. He explained that the market has not yet shown signs of a shift from a medium- to long-term downtrend into an uptrend. According to him, while Bitcoin’s move around the $60,000 level and some indicators may suggest a possible bottom, these signs are not strong enough to confirm it.

He added that a real bottom can only be confirmed when there is clear and steady evidence across on-chain data, volatility patterns, and capital inflows. He believes that until those signals appear together, it is still too early to say that Bitcoin has reached its lowest point. However, Dan failed to highlight these signals explicitly.

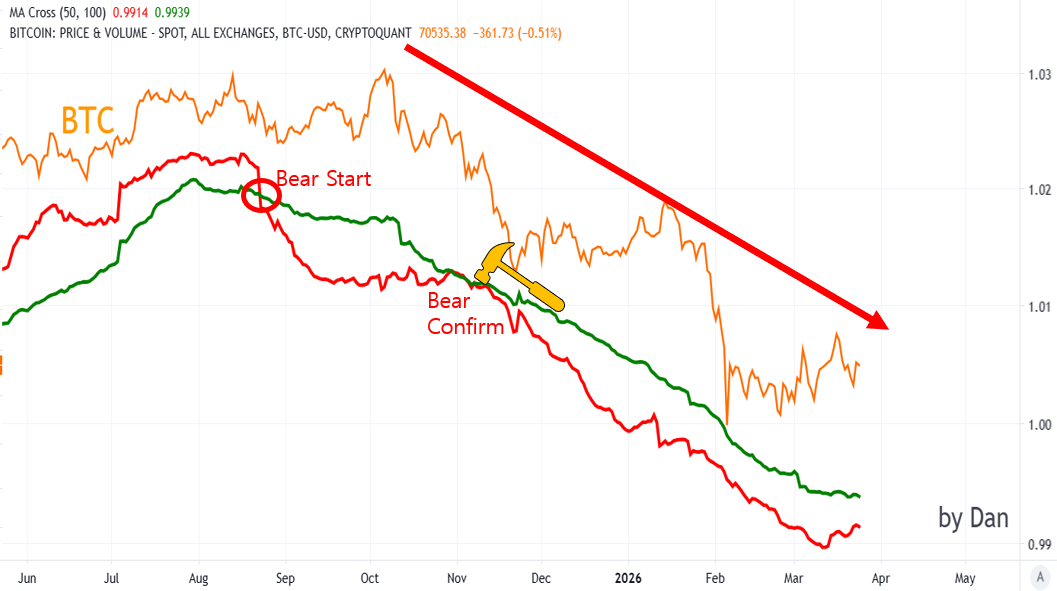
The market watcher discussed this while sharing an accompanying chart confirming that the Bitcoin bear market began in August 2025 when the 50 EMA crossed below the 200 EMA. However, the bear market was confirmed in November 2025 when the 50 EMA attempted to cross above the 200 EMA but failed.

Bitcoin 50 and 100 EMAs Dan
Bitcoin 50 and 100 EMAs | Dan

Stronger Dollar Could Keep Pressure on Bitcoin

Meanwhile, investment firm Trading Shot analyzed Bitcoin’s next possible direction through its relationship with the U.S. Dollar Index (DXY). They pointed out that Bitcoin usually rises when the dollar weakens and falls when the dollar gains strength.

They stressed that the dollar could be stepping into a new rally, while Bitcoin has already been in a bear market since last October. According to their analysis, the dollar reached a bottom in June 2025 and has been building a strong base since then, which often leads to a longer upward move.

The current situation resembles past cycles. Specifically, in 2011, Bitcoin still found a bottom even as the dollar was rising. In 2014, the dollar moved up strongly, but Bitcoin still reached a normal bear market bottom without crashing further. A similar pattern appeared in 2018-2019, when the dollar rose more slowly while Bitcoin moved into a new bull phase.

Bitcoin 1M Chart Trading Shot
Bitcoin 1M Chart | Trading Shot

However, 2022 was different. At that time, Bitcoin bottomed almost exactly when the dollar peaked and started to fall sharply. The period was affected by special factors like the COVID-related money printing, rising inflation, and the economic impact of the Russia-Ukraine war, which pushed energy prices higher. 

Based on this comparison, Trading Shot believes the current cycle is more like earlier ones, meaning the dollar could keep rising while Bitcoin continues its slow decline, possibly reaching a bottom in Q4 2026.

Current Fear Levels Create Opportunity

Interestingly, Michaël van de Poppe revealed last month that he believes Bitcoin may already be close to the bottom of its current cycle. He mentioned past moments when the fear and greed index dropped to very low levels, such as during the COVID-19 crash and the Terra collapse.

In those periods, Bitcoin later recorded gains of about 1,800% and 900%. Considering these signals, the market veteran suggested that times of extreme fear often create good opportunities to enter the market. At the time of his analysis, the Fear and Greed Index had reached extreme fear.

Fannie Mae Moves to Accept Bitcoin and USDC as Mortgage Collateral

0

Fannie Mae is taking a significant step toward integrating digital assets into mainstream housing finance by introducing a new mortgage model that allows borrowers to use Bitcoin and USDC as collateral.

The initiative signals a broader shift in traditional lending, reflecting the growing influence and acceptance of cryptocurrency within institutional finance.

Key Points

  • Fannie Mae is developing a mortgage framework that accepts Bitcoin and USDC as collateral for home loans.
  • The initiative is being built in partnership with Coinbase and Better Home & Finance to combine crypto custody with traditional mortgage infrastructure.
  • Borrowers can pledge crypto without selling it, thereby retaining ownership and avoiding taxable liquidation events.
  • The structure removes margin calls, meaning borrowers are not forced to post additional collateral during declines in cryptocurrency prices.
  • Crypto-backed mortgages are expected to carry higher interest rates (about 0.5%–1.5% above standard loans) due to added risk and complexity.

Crypto Enters Mainstream Mortgage Lending

Under the new framework, qualified homebuyers can leverage holdings in Bitcoin and the USDC stablecoin to support their mortgage applications. The program is being rolled out in partnership with Coinbase and Better Home & Finance, combining established mortgage infrastructure with crypto custody and liquidity solutions.

The development, first reported by The Wall Street Journal, underscores increasing institutional confidence in crypto-backed financial products and their role in real-world applications.

How the New Mortgage Structure Works

At the core of the model is a custody-based system designed to make crypto usable without forcing liquidation. Borrowers transfer their digital assets into a secure wallet managed by Better, while retaining legal ownership.

This approach allows buyers to avoid selling their crypto at the point of purchase, bypassing potential tax liabilities that have historically limited the use of digital assets in large transactions.

For USDC holders, the structure offers an additional advantage: they can continue earning yield on their stablecoins even while those funds are pledged as collateral, improving capital efficiency.

Balancing Flexibility With Cost

The added flexibility comes at a price. Crypto-backed mortgages are expected to carry interest rates roughly 0.5 to 1.5 percentage points higher than standard 30-year loans, with final terms depending on borrower risk profiles, according to Coinbase.

However, the model addresses one of the biggest drawbacks of crypto lending—volatility risk. Unlike typical crypto-backed loans, these mortgages do not involve margin calls. Even if Bitcoin prices fall, borrowers are not required to post additional collateral.

This eliminates forced liquidations tied to market swings and introduces a level of stability more consistent with traditional mortgage products.

Familiar Risk Framework

Despite the novel collateral, the underlying risk structure remains aligned with conventional lending standards. Borrowers face liquidation only after missing payments for 60 days, mirroring traditional mortgage delinquency rules.

By prioritizing predictability over rapid asset liquidation, the model bridges a critical gap between crypto finance and established housing norms.

Momentum Across the Industry

Fannie Mae’s move follows earlier guidance from U.S. housing authorities urging both it and Freddie Mac to explore how digital assets could factor into mortgage qualification.

Since then, regulators have been studying how crypto holdings might factor into borrower evaluations. This signals a broader policy shift toward recognizing digital wealth.

Meanwhile, private lenders are also moving in the same direction. For context, Newrez has begun evaluating Bitcoin and Ethereum as part of its mortgage qualification process, reflecting growing industry-wide adoption.

Toward a Hybrid Financial Future

Taken together, these developments point to a gradual but meaningful transformation in housing finance. Cryptocurrencies are increasingly being treated not just as speculative instruments, but as usable components of personal balance sheets.

By allowing borrowers to retain ownership while unlocking liquidity, Fannie Mae’s model creates a practical bridge between traditional lending and digital finance—one that could reshape how future homeowners fund their purchases.

MARA Sells Over 15K Bitcoin to Finance $1B Convertible Note Buyback

0

Popular Bitcoin mining company MARA Holdings, Inc. has sold part of its Bitcoin holdings to repurchase its outstanding convertible debt. 

The company disclosed this move in a press release, explaining that it aims to strengthen its balance sheet, reduce debt, and improve long-term financial flexibility.

Key Points 

  • MARA Holdings, Inc. sold 15,133 BTC to fund the repurchase of its senior convertible notes.
  • The company executed the sale this month, generating approximately $1.1 billion in proceeds.
  • The transaction follows MARA’s recent policy update permitting the sale of its Bitcoin holdings.
  • As a result of the sale, MARA has dropped to third place among global corporate Bitcoin holders. 

MARA Sells 15,133 Bitcoin to Finance Repurchase of Senior Convertible Notes 

MARA executed a major capital restructuring by liquidating a portion of its Bitcoin reserves to buy back outstanding convertible debt at a discount. Specifically, it sold more than 15,133 BTC for approximately $1.1 billion.

According to the announcement, the company carried out these sales between March 4 and March 26, 2026, generating total proceeds of roughly $1.1 billion.

Subsequently, MARA allocated the majority of these proceeds to repurchase convertible senior notes totaling nearly $1 billion, due in 2030 and 2031. According to MARA, this repurchase program will close by March 31, 2026. Meanwhile, it directed the remaining funds toward general corporate purposes. 

Strategic Capital Allocation 

CEO Fred Thiel described the $1 billion repurchase as a strategic capital allocation decision. Notably, the company negotiated private agreements with noteholders, enabling it to repurchase debt at a discount and secure approximately $88 million in savings.

In addition, the transaction reduces MARA’s convertible debt exposure by about 30%, thereby lowering leverage and minimizing the risk of future shareholder dilution linked to conversion features. 

By leveraging its Bitcoin holdings, the company is effectively deleveraging on favorable terms while preserving flexibility for future investments. Furthermore, Thiel emphasized that this strategy reflects a broader shift in MARA’s business model. 

While the company has historically focused on Bitcoin mining, it is now positioning itself within the digital energy and AI/high-performance computing (HPC) sectors. As a result, strengthening its balance sheet provides the financial flexibility needed to pursue these capital-intensive opportunities. 

MARA Now Third Largest Corporate Bitcoin Holder 

Meanwhile, this development follows a recent filing with the U.S. SEC in which MARA updated its policy to allow the sale of its Bitcoin holdings. 

Although the filing initially raised concerns that the company intended to offload its reserves, MARA later clarified that it had no immediate plans to do so.

As of March 3, MARA held approximately 53,822 BTC, making it the second-largest corporate holder of Bitcoin. However, after selling over 15,000 BTC between March 4 and March 25, the company has now fallen to third place. It has been overtaken by Twenty One Capital, which holds 43,514 BTC, while MARA currently holds 38,689 BTC at press time. 

Corporate Bitcoin Holders

Solana Price Outlook for Mar 26: Where Next as SOL Holds $88 and Daily Outflows Hit $93.35M

0

Solana is holding near support, as futures outflows and soft momentum signals point to a cautious market.

Notably, Solana (SOL) spent the latest session in a clear defensive posture, sliding to $88.17 and shedding 4.5% over the past 24 hours. The chart shows a slow bleed early on, followed by a sharper breakdown later in the move, with price falling from the $93 region toward the $88 area. 

That pattern matters because it suggests sellers did not just win the open. They kept control throughout the day and accelerated pressure into the close, leaving SOL pinned near the lower end of its daily range.

SOL is down 0.5% in 1 hour, 4.6% in 24 hours, and 1.2% in 7 days, even though it still held gains of 2.9% in 14 days and 15.1% in 30 days. 

Notably, $88 has become the immediate line bulls need to protect, while any meaningful relief bounce likely requires SOL to climb back above the $90 to $91 zone.

Solana Price Analysis

Solana’s daily chart shows the token slipping just below the Donchian Channel midline at $88.98. The midline often acts as a short-term balance point, and trading beneath it suggests buyers have recently lost control of the immediate trend.

Solana 1D Chart
Solana 1D Chart

At the same time, SOL remains well above the lower Donchian boundary near $80.29 and below the upper boundary around $97.67. 

The momentum picture also looks cautious rather than outright bearish. The RSI Divergence indicator is reading about 48.27, which puts Solana slightly below the neutral 50 area and signals that momentum has cooled. 

There is no strong overbought or oversold signal visible here, which suggests the market is drifting rather than capitulating. 

Ultimately, Solana is sitting in a neutral-to-soft zone: it is not collapsing, but it also lacks strong upside momentum. Solana will need buyers to push the price back above the Donchian midpoint to start targeting the $92 to $97 region again.

Solana Futures Flows

Solana’s futures flow data shows a broad net outflow trend across every visible timeframe. In the last 30 minutes, inflows reached $43.43 million while outflows came in at $50.03 million, leaving a net outflow of $6.60 million. 

Solana Futures Flows

That imbalance became much larger over the 1-hour and 4-hour windows, where net outflows stood at $61.11 million and $60.00 million, showing that futures traders were pulling liquidity even as turnover remained high.

The pressure looks even more pronounced on the longer intervals. Over 8 hours, Solana posted a $116.79 million net outflow, followed by $128.37 million over 12 hours and $93.35 million across 24 hours.

Even the 3-day reading stayed negative at $39.56 million, despite total inflows and outflows both running into the billions.

Shiba Inu Exchange Netflow Jumps to 39 Billion, Mounting Fresh Selling Pressure

0

Shiba Inu exchange netflow has ticked up in the past 24 hours alongside the latest price decline, suggesting renewed selling pressure.

The prominent meme coin has dropped 4% in the past 24 hours, joining a broader market trend. Technical analysis also revealed that it could not surmount the resistance at the apex of a descending triangle, forcing a rejection. Meanwhile, users have more to worry about, as on-chain data shows that selling pressure has ticked up in the past day.

Key Points

  • Data from CryptoQuant shows that the SHIB exchange netflow has amounted to 39,498,300,000 tokens in the past 24 hours.
  • A jump in exchange netflow increases selling pressure, as more Shiba Inu tokens become available for immediate sell-off.
  • CryptoQuant also shows a slight increase in exchange reserve to 81.29 trillion in the past 24 hours, supporting the inflow narrative.

Shiba Inu Holders Move Stash to Exchanges

Data from CryptoQuant shows that the SHIB exchange netflow has grown by 39,498,300,000 in the past 24 hours. For the uninitiated, this tracks the difference between inflows and outflows, and in this case, more tokens were deposited into exchanges than withdrawn.

Shiba Inu Netflow/CryptoQuant
Shiba Inu Netflow | CryptoQuant

This increases selling pressure, as more Shiba Inu tokens become available for immediate sell-off. While not all inflows into exchanges directly translate into sales, they mean fewer tokens in self-custody wallets and more tokens in platforms where holders can easily dump if market conditions remain unfavorable.

CryptoQuant also shows a slight increase in exchange reserve to 81.29 trillion in the past 24 hours. The metric moved from 81.27 trillion on March 25 to its current level, supporting the inflow narrative.

5,000 to 12,000 New Shiba Inu Wallets Monthly

The Shibarium team also revealed steady growth in the Shiba Inu ecosystem despite negative price trends. A recent report found that retail users created between 5,000 and 12,000 wallets per month, reflecting steady growth.

The steady influx has brought the total number of holders to 1.558 million. For one, new wallets mean new users, which suggests higher adoption and potentially more token purchases. This means that regardless of the dip in the price, the ecosystem is thriving.

Upbit Challenges Binance for XRP Market Share as Volume Surges 289% in One Hour

0

Upbit, South Korea’s largest exchange, has continued to challenge Binance for XRP market share, as its XRP volume spikes 289% in an hour. 

While the XRP price sees renewed bearish pressure amid a 2.83% decline today, trade volume has spiked in the last hour, indicating that the recent price crash receives support from increased market participation in the form of heightened selling pressure.

Interestingly, South Korea’s Upbit appears to be leading the charge surrounding XRP’s recent volume spike, recording a 289% increase in XRP trade volume within an hour. This has brought its 1-hour volume to $10.41 million, edging close to Binance’s $12.82 million.

Key Points

  • The market correction, which has led to a 2.83% drop in XRP’s price, comes alongside heightened trade volume on exchanges.
  • Upbit, South Korea’s largest exchange, seems to be leading the charge, with XRP’s trade volume on the exchange spiking 289% in one hour.
  • The spike in XRP’s volume on Upbit has pushed the figure to $10.41 million in the last hour, closing in on Binance’s $12.82 million. 
  • This volume spike cuts across all major exchanges, including a 128% rise on Binance, a 155% increase on Coinbase, and an 87% spike on Bybit.

XRP Volume Spikes Amid Renewed Bearishness

Notably, XRP engineered a rebound push alongside the rest of the crypto market earlier this month, leveraging the panic from the Iran conflict that escalated on Feb. 28 to post impressive gains. XRP rose nearly 26% from a low of $1.27 on Feb. 28 to a peak of $1.6 by March 17.

However, the resistance at $1.6 resulted in a pullback, as the rest of the market lost momentum. This pullback has endured until now, threatening to push XRP into the red in March. The correction now appears to be gaining steam, and the latest renewed bearish push has coincided with volume spikes on centralized exchanges.

Specifically, data from market resource Coinglass confirms that XRP has recorded volume spikes across all major exchanges over the past hour amid a 2.83% price decline today. Specifically, Binance’s volume has risen 128.57% within the hour, while Coinbase has recorded a 155.96% spike. Moreover, Bybit currently sees an 87.23% increase.

Upbit Leads in XRP Volume Growth

While other exchanges have recorded considerable XRP volume spikes, Upbit leads in this metric. Notably, the Korean exchange boasts a 289.52% increase in XRP trade volume over the last hour.

XRP Volumes on Binance and Upbit
XRP Volumes on Binance and Upbit | Coinglass

This surge has pushed XRP’s volume on Upbit from just $2.67 million to $10.41 million within the hour. With the spike, Upbit has begun closing in on Binance in terms of short-term XRP volume, now requiring an additional 23% increase to overtake Binance’s $12.82 million volume.

Meanwhile, despite the uniform growth, other exchanges have continued to see significantly lower figures than Upbit and Binance. Specifically, Coinbase has recorded a $5.28 million in XRP trade volume over the last hour, while Bybit has seen $1.95 million in the same timeframe.

XRP Now Approaching a Key Confluence Zone That Could Determine Its Next Direction

0

Market data shows that, amid the ongoing downturn, XRP is on the verge of retesting a major confluence zone at the intersection of three key levels.

The current market turbulence has continued to cap XRP’s upside potential over the past six months. During this period, the crypto asset has seen five consecutive monthly losses, losing $85 billion worth of market valuation.

With the persistent decline showing no signs of slowing down, data shows that XRP may now be approaching an important confluence zone at the intersection of three key levels. How XRP behaves in this area will determine whether it continues the downtrend or mounts a recovery effort.

Key Points

  • XRP has dropped 50% since October 2025 to the current price of $1.4, having lost $85 billion worth of market valuation.
  • Amid the downturn, XRP may now be approaching a major confluence zone that could determine its next price direction.
  • This confluence zone is important because it features the lower band of a falling channel, the $1 psychological support, and a key support zone.
  • If XRP retests and bounces back above this confluence zone, the rebound could target the $2 price area.

XRP’s Downward Price Action

Anonymous market commentator, The Signalyst, highlighted this structure in one of his recent analyses, as XRP struggles to recover. Notably, XRP remains one of the biggest victims of the downtrend that has plagued the broader market since Q4 2025.

Within this period, XRP has dropped more than 51% from the October 2025 price of $2.84 and 61% from the July 2025 peak of $3.6. Despite a recovery push that began earlier this month, bears remain in control, having reduced XRP’s March 2025 gains to 0.25% at press time, as the crypto token trades for $1.38. 

XRP Confluence Zone

Amid this downward price action, The Signalyst stressed in his latest analysis that XRP’s position has been “overall bearish.” However, he called attention to a confluence zone sitting at lower support levels as an important area that could mark a decisive turnaround for XRP. 

According to him, this zone is important for XRP’s price action because it features an intersection between the lower trendline of a multi-month falling channel, the $1 psychological level, and a major blue zone that XRP flipped to support during the November 2024 rally.

XRP Confluence Zone The Signalyst
XRP Confluence Zone | The Signalyst

Notably, the intersection of these three important levels at the confluence zone makes it a “powerful reaction” area that traders should watch out for, according to the market analyst.

The Three Important Levels

For context, the multi-month falling channel started forming after XRP collapsed from the $3.6 peak in July 2025. From here, the downturn led to lower highs and lower lows, resulting in the falling channel. The confluence zone lies around the lower support trendline of this channel.

Meanwhile, the confluence zone also rests around the $1 psychological level, which XRP breached during the rally in November 2024. Since then, XRP has not broken below this level, as each retest close to it has always marked a strong defensive area, including the drop to $1.1 in early February.

XRP also features a blue support zone between $0.84 and $1.04 on the 1-week chart. Like the $1 psychological mark, XRP broke above this area in the November 2024 rally after multiple attempts before then failed. It flipped this area from resistance to support and has not broken below it since. The confluence zone also lies in this area.

With these three important levels intersecting at the confluence zone, XRP could mount a proper defense at this region, potentially leading to a recovery. The Signalyst expects such a rebound to push prices toward $2, breaching the falling channel. 

However, he confirmed the uncertainty of this projection, insisting that investors should not see this call as investment advice. Notably, it is also possible for XRP to break below this confluence zone. Such a development would lead to steeper declines for the crypto asset.

Keep Your Conviction as XRP Fundamentals Are Building Beneath the Surface, Expert Says

0

Jake Claver, Chairman of Digital Ascension Group, has urged XRP holders to remain resilient rather than react to short-term price swings.

As the crypto market enters another downturn and XRP slips below $1.40, he emphasizes patience, conviction, and a focus on real-world adoption signals. 

Key Points 

  • Jake Claver urges XRP holders to stay resilient and ignore short-term volatility. 
  • He revisits the SEC v. Ripple lawsuit, noting that the company continued building and even launched three payment corridors by Q1 2026. 
  • He advises investors to watch adoption trends rather than react to price dips. 
  • Ripple continues expanding globally, integrating Payments, Custody, Treasury, and RLUSD while growing adoption in markets like Brazil. 

Reminiscing on XRP Performance During Ripple Lawsuit

Claver recently revisited the lawsuit period involving Ripple, noting that XRP traded largely sideways and tested even its most loyal investors. Although uncertainty dominated headlines and drove many investors out of the market, Ripple continued building behind the scenes.

Notably, Claver argued that the lawsuit’s conclusion did not mark progress; rather, it revealed developments already underway. By Q1 202, he stressed that Ripple had already launched three new payment corridors, quietly strengthening the XRP Ledger (XRPL).

These corridors, in turn, created real transaction pathways between financial institutions. As a result, they directly contributed to future settlement volume and served as a proxy for demand, according to Claver’s commentary. 

For context, XRP surged from around $0.50 in October 2024 to $3.65 within months. Claver suggests that this rally stemmed largely from Ripple’s behind-the-scenes progress during the lawsuit. 

Need for Patience and Conviction

His commentary suggests that investors often misinterpret price action by overlooking underlying utility. In his view, XRP’s market performance typically lags behind real-world adoption. 

By the time volatility returns and prices begin to rise, foundational growth, such as partnerships, integrations, and corridor expansion, has already taken place. Against this backdrop, he delivered a clear message: urge investors to remain patient and avoid getting shaken out of their positions.

Instead, Claver encourages investors to track adoption trends before the market reacts. Specifically, he highlights new corridor developments as early indicators of rising demand and potential future price momentum. 

In the meantime, renewed bearish pressure has pushed XRP below $1.40, fueling investor frustration. The token currently trades at $1.38, down 2.36% over the past day and 5.09% over the past week.  

Ripple Expands Global Financial Infrastructure

Even as the crypto market has remained bearish for most of the year, Ripple has continued to expand aggressively. The company has integrated solutions such as Ripple Payments, Custody, Treasury, and its RLUSD stablecoin into a unified financial stack designed to better serve institutional clients. 

More recently, the company intensified its push into Brazil. Its Ripple Payments network, having processed over $100 billion across 60 markets, has attracted major Brazilian financial institutions, including Braza Bank and Banco Genial. At the same time, firms like Justoken and CRX have adopted Ripple’s custodial solution.

Interestingly, Ripple has positioned XRP at the center of its long-term strategy, referring to the token as its “North Star”.

As a result, analysts believe that once market conditions stabilize, these ongoing initiatives could support a renewed price uptrend. However, near-term uncertainty persists amid continued bearish sentiment. 

We Don’t Even Know How Much XRP the Government Owns: The Wolf Of All Streets

Uncertainty around government crypto and XRP holdings is once again in focus.

Scott Melker, also known as The Wolf Of All Streets, argues that even basic details about U.S. exposure to assets like Bitcoin and XRP remain unknown.

Speaking in a recent podcast alongside Mark Yusko, Melker highlighted that despite growing speculation about a U.S. digital asset stockpile, there is still no clear data on how much XRP, or any crypto, the government actually holds.

Key Points

  • Scott Melker says the U.S. government’s XRP holdings remain unknown.
  • Speculation grows over whether the government could access Ripple’s 37B XRP escrow tokens.
  • Known holdings include 328K BTC, 62K ETH, USDT, and other tokens worth over $23B, no XRP confirmed.
  • Analysts stress some crypto may be tied up in legal claims; an audit could reveal true government exposure.

No Transparency on XRP Holdings

Melker pointed out that the lack of transparency goes beyond XRP alone. According to him, there is no confirmed audit detailing government reserves across major cryptocurrencies, including Bitcoin, Ethereum, Cardano, and Solana.

He noted that while discussions about a “strategic stockpile” have intensified, the absence of verified figures leaves investors guessing. “We don’t even know how much XRP the United States government holds,” Melker remarked.

XRP Escrow Speculation Adds to Uncertainty

The debate comes as speculation within the XRP community continues over whether the U.S. government could eventually acquire tokens from Ripple’s massive escrow holdings.

Some analysts have suggested that legal developments in the Ripple case could position the government as a potential “buyer” of up to 37 billion XRP held in escrow.

Others have floated the idea that Ripple’s $125 million penalty could be paid in XRP, potentially marking the government’s first direct exposure to the asset. However, these theories remain hypothetical.

There is currently no official confirmation that the U.S. government holds XRP, nor any indication that escrowed tokens have been pre-allocated or earmarked for federal use.

Notably, Ripple has already paid the $125 million fine, and no document suggests it was paid in XRP. Even if it were, it would most likely have been converted to fiat.

Skepticism Over Political Narratives

Meanwhile, Yusko expressed skepticism during the discussion about political involvement in crypto, arguing that expectations of government support are often misplaced.

He suggested that narratives about XRP’s inclusion in a national stockpile may be overstated, noting that, in many cases, government crypto holdings come from seized assets rather than deliberate purchases.

U.S. Government’s Known Bitcoin and Crypto Holdings

Meanwhile, the U.S. government directly holds other crypto assets such as Bitcoin, Ethereum, and USDT, based on on-chain data. According to tracking platform Arkham, the U.S. government holds 328,372 BTC worth over $22.97 billion, as well as 750.72 WBTC valued at more than $52.38 million.

It also holds 62,742 ETH tokens worth over $132.74 million and USDT valued at more than $126 million. The U.S. government’s tracked portfolio also includes assets such as BNB, WBNB, AUSDC, USDC, DAI, WETH, UNI, and LINK, all valued in the millions.

Collectively, the government’s crypto holdings are worth over $23.36 billion, with no XRP included in the lineup.

US Government Crypto Holdings | Arkham

Meanwhile, there are suggestions that some of these holdings may still be subject to legal claims and are not yet under permanent forfeiture. Commentators believe that a full audit would clarify the government’s actual crypto holdings.