

Home Blog Page 236

Bitcoin ETF Investors Show Diamond Hands—Just $6.5B Outflow Since Early October

0

Bitcoin ETF investors have handled the market dip maturely, as the funds have only recorded meager outflows since the start of the dip.

Their maturity is particularly commendable, given that they are new to the volatility associated with Bitcoin (BTC). Compared to the inflows the investment funds have recorded since their January 2024 market entrance, selloffs have been moderate, reinforcing their confidence in Bitcoin’s long-term price trajectory.

Key Points

  • Bitcoin ETF investors have handled the market dip maturely, as the funds have only recorded meager outflows since the start of the dip.
  • Amid the 50% downturn, they have remained largely composed, selling only $6.5 billion in BTC, especially compared with their hefty $55 billion inflows.
  • Data shows that the past four months have been rough, with over a billion flowing out from the funds in each of the past three months.
  • The tides might be turning following a third consecutive day of inflow, surpassing $1 billion.

ETF Investors HODL Bitcoin

NovaDius Wealth president Nate Geraci took to X on Friday to commend Bitcoin investors’ diamond-handed attitude. Amid the 50% downturn, they have remained largely composed, selling less of their holdings, especially when compared with their hefty inflows.

The industry leader pointed out that since Bitcoin topped in October 2025 after hitting an ATH of $126,200, the funds have recorded only $6.5 billion in outflows. While this may be huge in dollar terms, Geraci spotlighted that this is a “drop in the bucket” compared to the $55 billion taken in since January 2024.

Notably, the US Bitcoin spot ETFs had an impressive start to life, bringing in billions in inflows in days. Despite early selling pressure from the Grayscale Bitcoin Trust (GBTC), the broader BTC-focused inflows weathered the storm, driven by persistent inflows from BlackRock and Fidelity.

While the funds have seen mixed periods, the trend has generally been favorable. Recall that the BlackRock iShares Bitcoin Trust (IBIT) ranked as one of the most successful ETF launches in history, contributing massively to the Bitcoin ETFs’ success.

Bitcoin ETFs Inflow Stall, but Some Positives

Data from Sosovalue shows that the past four months have been rough. In November, the ETFs recorded a net outflow of $3.48 billion, selling back all the BTC it bought the prior month.

Meanwhile, the poor run of form has persisted, with outflows of $1.09 billion in December, $1.61 billion in January, and currently a total net outflow of $179 million in February.

Geraci suggested that the tides might be turning following a third consecutive day of inflow, surpassing $1 billion. If the ETFs record a similar daily inflow to yesterday’s on Friday, the funds will completely reverse the current monthly flow drawdown.

ETF investors remaining resilient is also another positive. Long-term BTC investors have experienced 50% drawdowns several times from their exposure to the premier asset, but these enthusiasts are largely new to such events. Instead of panicking, recent activity suggests they are buying the dip.

Resilience: The Right Theme 

Bloomberg’s senior ETF analyst Eric Balchunas also weighed in on the discussion. He emphasized that, instead of the misreported focus on the over $6 billion in outflows, the main theme should be how these new investors have shown resilience following the 50% price drop.

Balchunas also discussed the narrative that crypto is suffering from its exposure to the traditional financial markets. According to him, new capital worth $55 billion received from regulated Bitcoin spot products in the US “is the opposite of paying the price.”
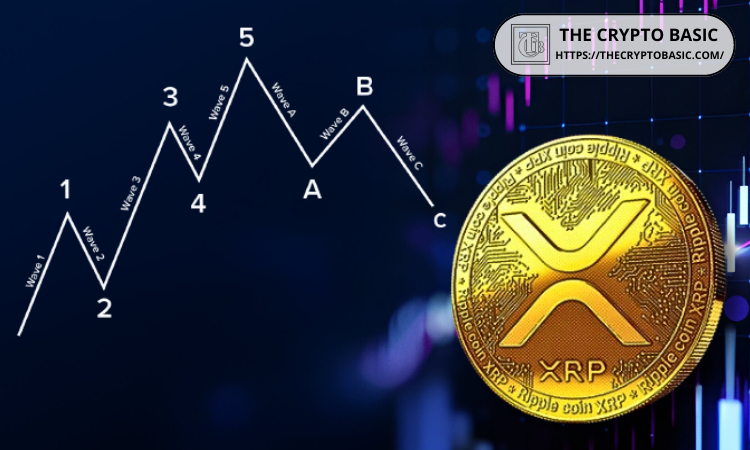
New XRP Price level as XRP Breakout That Took Place in Late 2024 Hints at Another 900%+ Surge

0

The late-2024 XRP breakout is back in focus, with market watchers suggesting the move could still be pointing to a much larger upside target.

For context, XRP’s price surge 647% from $0.49 in late 2024 to above $3.60 by mid 2025. While the price has retracted 70% from that peak, market watchers believe a continuation is now due.

Key Points

  • XRP’s 647% surge from $0.49 to $3.66 is back in focus after a 70% pullback from its peak.
  • Analyst Javon Marks says the $15 measured move target remains valid, implying 900%+ upside.
  • Elliott Wave analyst XForceGlobal sees “compression,” not weakness, eyeing $5–$10 next.
  • Five straight red months echo 2016’s setup, fueling hopes of a major 2026 breakout.

XRP 900%+ Price Surge Loading

In a post on X, widely followed market analyst Javon Marks raised the possibility of another parabolic run in XRP prices. He stressed that XRP’s measured move target above $15 “goes unchanged.” 

Marks argues that the structural breakout that occurred in late 2024 continues to support the possibility of a 10x move, a surge of more than 900% from current levels.

According to the analyst, XRP’s breakout from a multi-year triangle formation in November 2024 remains technically valid despite months of choppy price action.

Measured move projections is ypically calculated by taking the height of a consolidation pattern and extending it upward from the breakout point. 

At the time of writing, XRP is trading around $1.38, down 4.3% over the past day with a yearly dip exceeding 38%. From today’s price levels, Marks’ $15 ‘measured move’ outlook would represent a gain of 1,008%.

Image

“It’s All Coming Together”

The bullish outlook is echoed by Korean certified Elliott Wave analyst XForceGlobal, who recently stated that “it’s all coming together” for XRP from a structural perspective.

He argues that XRP has already checked off two major milestones:

  • A revisit of its prior all-time high zone with the rally to $3.66
  • A full-range retracement back toward the $1 area

In other words, an impulsive expansion phase could follow this major reset. The analyst maintains that short-term volatility does not invalidate the broader wave structure. Instead, he describes the sideways action as “compression,” not weakness.

His earlier projections labeled $6 as a conservative Fibonacci extension target. More recent commentary references $5 and $10, highlighting expectations for double digit price this year.

Five Red Months and a Potential Reset

Another data point fueling speculation is XRP’s rare streak of five consecutive red monthly candles, something not seen since the 2016–2017 consolidation phase.

That earlier five-month decline was followed by an explosive rally in 2017. While today’s market conditions are vastly different, some analysts believe history could repeat itself.

Moreover, the recent wave of capitulation, including over $900 million in realized losses by holders in a single week, suggests weaker hands may have exited. Supporters argue this could leave stronger long-term participants positioned for a reversal if momentum returns.

2026: A Defining Year?

Community commentator Archie has gone even further, suggesting 2026 could be transformational for long-term holders. In one widely discussed chart, he projected XRP reaching as high as $83, a 5,900% increase from the $1.38 region.

Such a move would imply a multi-trillion-dollar market capitalization and remains highly speculative. Meanwhile, more conservative projections, such as $4, $6, or $10, would already represent substantial gains from current levels. 

Bank of America, Fidelity, Morgan Stanley Endorse 1–5% Bitcoin Stakes in Portfolios

0

Several major Wall Street institutions are now advising clients to include a modest allocation to Bitcoin within diversified portfolios.

According to a report by River, firms such as Fidelity Investments, Bank of America, and Morgan Stanley are recommending measured exposure to cryptocurrency. Most suggested allocations fall between 1% and 5% of total portfolio value, reflecting a cautious but deliberate embrace of digital assets.

Key Points

  • Major firms, including Fidelity, Bank of America, and Morgan Stanley, are formally recommending small Bitcoin allocations in client portfolios.
  • Suggested allocations generally range from 1% to 5%, reflecting cautious but deliberate adoption of cryptocurrency.
  • Institutions are increasingly treating Bitcoin as a portfolio diversifier rather than purely speculative.

Institutional Allocation Strategies Expand

River reports that Fidelity is formally advising its wealth management clients to allocate between 2% and 5% of their portfolios to crypto, including Bitcoin. Bank of America recommends a slightly lower range of 1% to 4%, while Morgan Stanley suggests allocations of up to 4%.

Other asset managers are taking a more conservative approach. BlackRock recommends limiting exposure to between 1% and 2%. Meanwhile, WisdomTree and JPMorgan Chase advise allocations of up to 1%.

Collectively, these recommendations mark an important evolution in institutional thinking. Bitcoin is increasingly being treated as a portfolio diversifier rather than a purely speculative asset. By keeping allocations relatively small, institutions aim to capture potential long-term upside while maintaining prudent risk management.

Image

Bitcoin Faces Heavy Selling Pressure

These allocation calls come amid a challenging period for the cryptocurrency market. Bitcoin reached a record high of $126,080 in October last year but has since declined by 47%. At the time of reporting, the asset was trading at $67,441, according to data from CoinGecko.

Despite the sharp correction, institutional commentary suggests that long-term conviction remains intact. Several major firms continue to publish bullish projections, reinforcing the view that short-term volatility has not undermined Bitcoin’s strategic relevance.

Long-Term Forecasts Reflect Strategic Confidence

In 2025, BlackRock CEO Larry Fink projected that Bitcoin could eventually reach $700,000 per coin, citing growing concerns about currency debasement and global financial instability. He argued that Bitcoin may serve as a hedge against structural weaknesses in traditional monetary systems.

Fidelity has outlined an even more ambitious scenario. In September 2021, the firm projected that Bitcoin could reach $1 billion per coin by 2038. At the time, Jurrien Timmer, Fidelity’s Director of Global Macro, supported the projection using stock-to-flow and demand-based valuation models.

JPMorgan analysts have also issued long-term projections, suggesting Bitcoin could eventually rise to $266,000. Their analysis focuses on Bitcoin’s potential to compete with gold as a store of value.

Comparing Bitcoin and Gold Dynamics

JPMorgan analysts note that gold has outperformed Bitcoin since last October, even as gold’s own volatility has increased. This combination has improved Bitcoin’s relative appeal on a volatility-adjusted basis.

They highlighted that the Bitcoin-to-gold volatility ratio has declined to approximately 1.5, a record low. This shift suggests Bitcoin may be becoming more competitive with gold in terms of risk-adjusted performance.

To reach $266,000, Bitcoin’s market capitalization would need to equal roughly $8 trillion in private-sector gold investment, excluding central bank holdings. JPMorgan stressed that such a target is unrealistic for the current year. However, the firm said it illustrates potential upside if market sentiment improves and Bitcoin regains favor as a hedge asset.

Overall, while price pressures persist, major financial institutions appear to be integrating Bitcoin into mainstream portfolio strategy. Their recommendations emphasize limited exposure, disciplined allocation, and long-term positioning rather than short-term speculation.

Solana Price Prediction for Feb 27: SOL Eyes Reversal But Weekly Chart Warns of Lower Levels

0

Solana shows early recovery signals, but bearish weekly structure highlights major downside support levels if momentum weakens further.

Solana (SOL) changes hands at $86.45, down 2.07% over the past 24 hours, as intraday volatility keeps the price oscillating between roughly $84 and $88. After an early drop toward the mid-$84 zone, SOL rebounded above $88 before easing back into the $86 region.

This indicates short-term resistance around $88 while buyers continue defending lower support levels. Despite the daily pullback, SOL remains up 4.97% over the past week, though it is still down more than 30% over the last month.

Long/short ratios on major exchanges show a clear bullish skew, with Binance accounts at 2.31 and top traders even more heavily positioned to the upside. This strong long bias reflects optimistic sentiment, but could amplify volatility if support levels fail and leveraged positions begin to unwind. What’s next?

Where’s Solana Headed?

Solana remains in a broader downtrend on a daily chart, with the price trading well below the 50-day ($106.86), 100-day ($119.12), and 200-day ($158.02) simple moving averages. The bearish stacking of these moving averages confirms that medium- and long-term momentum is still tilted to the downside.

Although SOL has stabilized around the mid-$80 region and is attempting to build a short-term base, it has yet to reclaim any of the key moving averages, meaning the larger trend structure remains technically weak.

Solana Price Analysis

For a clear directional move, Solana needs to break decisively above the 50-day SMA and establish it as support. A sustained push beyond this level would be the first signal of shifting momentum, potentially opening the door toward the $119 region near the 100-day SMA.

Momentum, however, is beginning to show early signs of recovery. The Awesome Oscillator remains in negative territory at approximately -9.83, indicating that bearish momentum is still present.

That said, the histogram bars have been gradually shifting from deeper red to smaller green prints, suggesting that downside pressure is fading. If this momentum improvement continues alongside higher lows in price, it could signal the early stages of a recovery attempt. 

Here Are Next Major Support Levels for SOL

Elsewhere, crypto analyst Ali Martinez has outlined key downside levels to watch on Solana’s weekly chart if bearish momentum continues to build. The first major support level sits around $50.22, which previously acted as a significant consolidation and breakout region. 

Solana 1W Chart
Solana 1W Chart

Below that, Martinez highlights $22.47 as the next structural support tied to prior accumulation phases. In a more extreme downside scenario, the final major level to monitor stands near $9.98, representing a long-term floor.

If You Invested $10,000 in XRP When Trump Took Office, What It’s Worth Now

0

As crypto prices continued to decline in 2026, market watchers are examining how significant investments in XRP, Bitcoin, and Ethereum have fared over the past year.

Crypto commentator Henry recently shared a striking comparison of how major cryptocurrencies have performed since President Donald Trump’s second inauguration on January 20, 2025.

While his original example used a $20,000 investment, scaling the numbers to $10,000 still paints a sobering picture for holders of XRP, Bitcoin, and Ethereum.

Key Points

  • $10K in XRP at Trump’s 2025 inauguration is now worth 53% below.

  • Bitcoin has fallen 34% since January 2025, and $10K then would be $6,600 today.

  • Ethereum declined 38%; and$10K investment is now about $6,200.

  • Analysts see XRP potentially hitting $5–$10 with regulatory clarity, offering 7x gains.

Where the Market Stood in January 2025

XRP, Bitcoin, and Ethereum were rallying massively on the momentum that swept the market after Trump’s election victory in November 2024. Specifically, Bitcoin cracked the $100K milestone while XRP reached $3 for the first time in eight years. The momentum continued through November, December, and into January, when Trump was inaugurated.

On the day of Trump’s second inauguration, Bitcoin traded at $101,100, with a market cap of $2 trillion. Ethereum stood at $3,208, with a market cap of $383 billion. Likewise, XRP changed hands at $2.95, with a market cap of $170 billion.

Snapshot showing XRP, Bitcoin, and Ethereum price data | CoinMarketCap

Fast forward to today, Bitcoin trades at $66,800, with a market cap of $1.33 trillion, having lost over 30% of its value. Ethereum sits at $1,995, with a $240 billion market cap, while XRP trades at $1.39, with a market cap of $85 billion.

What $10,000 Would Be Worth Today

Using those price levels, a $10,000 investment in each asset in January 2025 would have significantly depreciated:

  • Bitcoin: $10,000 at $101,100 would have bought roughly 0.0989 BTC. At today’s $66,800 price, that holding is worth about $6,600 — a decline of roughly 34%.
  • Ethereum: $10,000 at $3,208 would have secured about 3.11 ETH. At $1,995 today, that investment is worth around $6,200, down about 38%.
  • XRP: $10,000 at $2.95 would have purchased about 3,389 XRP. At today’s $1.39 price, the holding is worth roughly $4,710 — a drop of nearly 53%.

Among the three, XRP has experienced the steepest percentage drawdown from inauguration-day levels, with its market capitalization cut in half from $170 billion to $85 billion.

Is This an XRP Shakeout Before a Bigger Move?

Despite the decline, some analysts argue that prolonged weakness could set the stage for a stronger cycle ahead.

One XRP commentator, Archie, recently suggested that 2026 could be transformative for the asset, projecting a move toward $83 per token. From today’s $1.39, that would represent a gain of more than 5,900%, implying a multi-trillion-dollar valuation.

Under that scenario, the 3,389 XRP accumulated with a $10,000 investment would be worth over $281,000. Archie even hinted at the possibility of “four figures,” though such projections remain highly speculative.

More conservative upside cases, tied to potential U.S. regulatory clarity, envision XRP moving into the $5–$10 range. At $10, that same 3,389 XRP would be valued at nearly $33,890, turning today’s depressed position into a 7x rebound.

Bitcoin Million-Dollar Narrative

Similarly, bullish sentiment around Bitcoin persists. At a recent forum at Mar-a-Lago, Eric Trump reiterated his long-term projection that Bitcoin could eventually reach $1 million per coin. If Bitcoin climbs from today’s $66,800 to $1 million, the 0.0989 BTC purchased with $10,000 on inauguration day would be worth close to $98,900.

Analysts like Michaël van de Poppe argue that market participants in a few years will regret not buying Bitcoin at the current ~$60K level. Even Bitwise CEO has called the current level a generational buying opportunity. The firm projects Bitcoin could see compound growth of 28% over the next decade.

Test of Conviction

The numbers show that a $10,000 investment made at the start of Trump’s second term would currently be underwater across all three major assets. For small altcoins, the results are even far worse.

Notably, the declines have been widely attributed to Trump’s macroeconomic policies, including back-and-forth tariffs and conflicts in the Middle East.

These actions destabilized investor sentiment, despite hopes for a promising turn given Trump’s pro-crypto advocacy. Yet, some believe the worst is over and bull season will resume soon.

Indeed, crypto markets have historically moved in cycles marked by deep corrections followed by sharp expansions. As always in crypto, time horizon and risk tolerance remain the defining factors.

Ethereum Forecast for Feb 27: Buyers Reclaim Short-Term Control, But Is It Enough?

0

Ethereum shows improving short-term momentum and heavy liquidations, but broader downtrend and overhead resistance remain key hurdles.

Ethereum (ETH) now hovers near $2,026, down 1.6% over the past 24 hours amid a volatile trading session. Price action saw an early push toward the $2,060–$2,080 zone before sellers stepped in, driving ETH below the key $2,000 psychological level.

A rebound followed from session lows near $1,981, allowing the asset to reclaim ground above $2,020, though it still trades beneath earlier intraday peaks.

Looking at the broader picture, Ethereum’s momentum remains uneven. While the asset has posted gains over the past week and over the last 14 days, it continues to face pressure on the monthly timeframe, where it remains down more than 32%.

The key focus now is whether Ethereum can hold above the $2,000 psychological level.

Ethereum Price Prediction

On the technical side, Ethereum remains in a broader downtrend. However, price has now moved above the Alligator’s teeth (red line) and lips (green line), signaling that short-term momentum is shifting in favor of buyers. This crossover suggests that the immediate bearish pressure has weakened and that ETH is attempting to transition from consolidation into a potential recovery phase. 

Ethereum Price Analysis

However, the longer-term jaw (blue line) still sits above price near the $2,100 region, meaning the broader trend has not fully flipped bullish yet. A sustained move above the jaw would be required to confirm a stronger trend reversal.

Momentum is showing improvement. The Stochastic oscillator has pushed higher, with %K around 65 and %D near 68, signaling strengthening short-term momentum. While not yet in extreme overbought territory, the indicator suggests buyers are regaining traction after a prolonged decline.

If momentum continues to build as the price breaks above the descending moving average, it could reinforce a recovery attempt. Otherwise, failure to clear overhead resistance may keep Ethereum trapped in a consolidation phase within its broader corrective trend.

Ethereum Liquidation Data

Ethereum’s liquidation data shows elevated derivatives activity across multiple timeframes, with a noticeable imbalance between long and short positioning. Over the past hour, total liquidations reached $1.28 million, with long positions accounting for $994.72K compared to $283.04K in shorts. 

Ethereum Rekt Data
Ethereum Rekt Data

On the 4-hour timeframe, liquidations totaled $4.92 million, with $2.88 million in longs and $2.04 million in shorts, suggesting two-sided volatility but still slightly heavier pressure on long positions.

Zooming out, the 12-hour data shows $16.06 million in total liquidations, with shorts ($9.68 million) exceeding longs ($6.38 million), signaling that earlier upward moves may have squeezed bearish traders. Over the full 24-hour period, total liquidations stand at $67.11 million, with long positions contributing $39.73 million and shorts $27.38 million.

Cardano Price Analysis: Is ADA Preparing for a Breakout Above $0.29?

0

Cardano shows early reversal signals as SAR flips bullish and funding turns positive, pointing to rising upside momentum.

Cardano (ADA) is currently trading at $0.2926, down 0.4% over the past 24 hours, as price action continues to consolidate within a narrow intraday band. Despite the short-term pause, broader momentum remains mixed.

ADA has gained 7.4% over the past week and 12.6% over the past 14 days, signaling improving near-term sentiment. However, the asset is still down 18.0% over the last 30 days, indicating that the wider corrective trend has not fully reversed.

From a market fundamentals standpoint, Cardano maintains a market cap of approximately $10.77 billion, supported by $606.38 million in 24-hour trading volume. This level of activity suggests steady liquidity as traders assess whether ADA can maintain higher lows and generate sustained momentum above the $0.29 region.

Cardano Price Analysis

Looking elsewhere, Cardano is showing early signs of a potential trend shift as the Parabolic SAR dots have flipped below the price, with the current SAR level near $0.2549. This transition typically signals that bearish momentum has weakened and that buyers may be regaining short-term control.

Cardano Prediction
Cardano Prediction

After a prolonged downtrend, ADA appears to be attempting to establish a base around the mid-$0.26 to $0.29 region. A sustained hold above the SAR level would reinforce the developing bullish structure, while a break back below it could invalidate the early reversal signal.

Meanwhile, the Average True Range sits around 0.0198, indicating that volatility has moderated compared to the sharp swings seen earlier in the decline. The cooling ATR suggests price is stabilizing rather than expanding aggressively in either direction. Combined with the SAR flip, this contraction in volatility may precede a more decisive move. 

Cardano OI-Weighted Funding Rate

The Cardano OI-weighted funding rate chart (30-minute timeframe) shows a highly volatile derivatives landscape over the past two weeks. Funding rates have oscillated sharply between positive and negative territory, with multiple deep red spikes below -0.0100% around February 16 and February 21–22, indicating aggressive short positioning during periods of price weakness. 

OI-Weighted Funding Rate

These negative funding extremes coincided with declines in ADA’s price toward the $0.26 region, suggesting traders were heavily betting on further downside. Historically, such deeply negative funding levels often signal crowded short trades, creating conditions for short squeezes if the price begins to rebound.

More recently, funding has flipped decisively positive, with green spikes approaching +0.0100%. If funding remains elevated while price stalls, it could signal overheating long positioning. Conversely, a sustained positive funding environment alongside rising prices would confirm strengthening upside momentum. 

New 819 Million Reasons to Watch Cardano Right Now

0

Recent whale on-chain activity underscores that large market players remain keen on Cardano, even as its price underperforms.

Cardano (ADA) has spent much of the past six months under pressure, sliding roughly 71% from its previous highs. Yet beneath the weak price action, on-chain data suggests a bullish trend is unfolding, one that points to steady accumulation by the network’s largest wallets.

Key Points

  • Recent whale on-chain activity shows that large market players remain keen on Cardano, even as its price underperforms.
  • Over the last six months, addresses commonly labeled as whales and sharks have added about 819 million ADA, worth roughly $239 million at current prices.
  • With this accumulation, they now hold over 25.35 billion ADA tokens, representing 68.44% of the asset’s supply.
  • The move suggests conviction that ADA would recover from this setback in the mid- to long term.
  • ADA remains below key technical areas and needs to reclaim them before any broader recovery attempt becomes possible.

Cardano Whales Expand Shares as Price Drifts

Over the last six months, addresses commonly labeled as whales and sharks have added about 819 million ADA, worth roughly $239 million at current prices.

The accumulation, which The Crypto Basic confirmed happened among whales holding between 100,000 and 100 million ADA, has occurred while broader sentiment remained cautious. This suggests that while the market focused on the decline, larger players appeared to be increasing their exposure in the background.

Notably, this divergence between price and accumulation often attracts attention, particularly during periods of market fear, as it emphasizes the bullish disposition of the largest market whales. Historically, heavy accumulation by this class of holders has occurred closer to cycle lows, when valuations look less attractive to retail traders.

With this accumulation, they now hold over 25.35 billion ADA tokens, representing 68.44% of the asset’s supply. This marked a 1.6% growth in the past 6 months, when they held 24.54 billion tokens (66.84%).

Conviction Despite ADA Price Uncertainties

ADA is still struggling below key resistance zones, struggling to reclaim levels that previously acted as support. While it recorded heavy daily growth last seen in months on Wednesday, following its over 14% growth, the structure remains fragile.

Momentum has not yet flipped decisively positive, and attempts to push higher have repeatedly stalled near psychological barriers. The recent stall around $0.31 on Wednesday supports this narrative. The momentum summarizes the coin’s predominant weakness over the past six months. 

Yet, whales have quietly increased their share of the circulating supply. The move suggests conviction that ADA would recover from this setback in the mid- to long term. It also reduces the number of coins available on the open market, which can tighten supply when market conditions improve.

Key Levels to Watch

Nonetheless, accumulation alone does not guarantee an immediate turnaround. ADA remains below key technical areas and needs to reclaim them before any broader recovery attempt becomes possible.

Currently at $0.29, Cardano must defend the 3-year support at $0.24 to keep the chances of a recovery alive. Losing this 2023 base would risk massive downsides to $0.17 and the psychological $0.1 support level.

The next key resistance level lies around $0.38, aligning with the wave C target in an analysis from SmellyTaz. The commentary, however, hinges the rally to this zone on a successful retest of the $0.27 support and an MSS to confirm. Other resistance levels are at $0.79, and a sustained break above it would swing ADA well into bullish territory again.

Analyst Identifies Crucial XRP Support Zone at $0.90

0

A leading market analyst has spotlighted a critical technical structure, outlining where XRP could find its next major support zone. 

Although XRP recently climbed above $1.40, analysts continue to warn that the token and the broader crypto market remain under bearish pressure. Consequently, prominent analyst Ali Martinez has identified a key price region that could act as a cushion in the event of a deeper market pullback. 

Key Points 

  • Despite XRP’s rally above $1.40, skeptics argue that broader bearish pressure still lingers across the market.
  • Ali Martinez highlights a key support zone between $0.90 and $0.60 in case of a major pullback.
  • XRP’s demand metrics have improved even as the token remains down 22% year to date.
  • Binance’s XRP exchange supply ratio fell to a two-year low of 0.025, while Bitrue recorded a 212% surge in spot buying activity.

Martinez Identifies Crucial Support for XRP

In his latest technical outlook, Martinez shifts attention to XRP’s long-term price structure as volatility continues to shape market sentiment. Examining the monthly chart, he identified a broad triangular pattern that has been developing since 2020, with its rising lower boundary forming a potential long-term support trendline. 

According to the chart, the upper boundary of this pattern sits near $3.30, a level that repeatedly capped XRP’s upside on a few occasions last year. Meanwhile, the support trendline projects potential support between $0.90 and $0.60, representing a zone that could attract new buying interest during any major corrective phase.

Notably, this trendline dates back to the 2022 bear-market bottom, when XRP stabilized before embarking on a gradual recovery that eventually lifted prices above $1 in late 2024. Since then, XRP has consistently traded above this boundary, further strengthening its technical significance. 

ImageCaution Still Imperative Despite Recent Surge

Martinez’s analysis comes shortly after XRP enjoyed a strong short-term rally, which pushed it above $1.40 earlier this week. However, despite the bullish momentum, Martinez’s outlook cautions that sharp rallies often invite periods of consolidation or corrective pullbacks. 

Therefore, he emphasizes the importance of closely monitoring robust support zones, particularly the $0.90 to $0.60 region. Holding this range would help preserve XRP’s broader bullish structure, while a breakdown could expose the asset to heightened downside risks. 

In the meantime, market reactions to the analysis remain mixed. While some traders hope XRP retests support to buy at lower prices, others note that the token still trades well above that zone. 

XRP Demand Spikes on Exchanges

Although persistent bearish pressure has pushed XRP down 22.7% this year, the token’s demand metrics have gained momentum lately. Notably, its exchange supply ratio on Binance fell to 0.025, marking a two-year low and a sharp drop from 0.0302 in October 2025. 

Reports indicate that users have withdrawn roughly 500 million XRP from Binance since the October 2025 crash. As more tokens leave Binance, reduced exchange supply could ease selling pressure and support price stability. 

Meanwhile, Bitrue reported a 212% surge in XRP spot purchases, with buy orders exceeding sales by more than twofold. The exchange attributed the spike to sustained institutional accumulation following the launch of XRP ETFs.

Amid rising interest and tightening supply, investors believe XRP could be preparing for a major move, though the direction remains uncertain. 

XRP Wave 3 Points to $15-$31 Target, But XRP Must First Reclaim This Level

0

The XRP Elliott Wave structure points to a bullish $31 peak for Wave 3, but the price must first reclaim a key level.

XRP has fallen 22.59% this year amid a broader market downturn, but the decline may fit into a larger five-wave Elliott Wave structure that began in July 2024.

Despite the ongoing correction, the overall pattern remains intact, and chart data suggests the forthcoming Wave 3 could eventually push XRP toward the $15 to $31 range. However, the confirmation of Wave 3 requires a decisive weekly close above the $3.6 all-time high.

Key Points

  • XRP has dropped 22.59% this year but continues to trade within a broader five-wave structure that started in July 2024.
  • Wave 1 drove an 814% rally from $0.39 to $3.66 between July 2024 and July 2025.
  • After peaking, XRP corrected 60.5% from $3.6 to its current level near $1.42 as part of Wave 2.
  • The pullback falls within typical 50% to 61.8% retracement levels and found support at $1.1 along the lower channel boundary.
  • The chart structure points to a potential rally to a range of $15 and $31 for Wave 3, but XRP must first reclaim the $3.6 all-time high from Wave 1.

Wave 1 Took XRP From $0.39 to $3.66

EGRAG Crypto, a well-known market watcher, highlighted this structure in a recent commentary. Data from his chart shows that the first wave of the 5-phase Elliott Wave structure began in July 2024. Notably, XRP traded at just $0.39 at this point. 

From there, the token went on a massive rally, buoyed by the November 2024 upsurge, as it climbed to $3.4 in January 2025. After the surge, XRP pulled back to $1.61 in April 2025, only to bounce again and reach a fresh all-time high of $3.66 in July 2025.

The entire move, from $0.39 to $3.66, marked a gain of about 814% in one year. Throughout the climb, XRP remained inside an existing ascending channel, repeatedly touching the upper boundary before pulling back. The rally showed strong momentum, but it also respected technical limits, which fits the look of a Wave 1 push.

Wave 2 Has Pulled Price Down 60.5% to $1.42

After hitting $3.66 in July 2025, XRP entered its second wave, which represents the correction phase. The token now trades at $1.42, down 60.5% from the Wave 1 peak of $3.6. According to EGRAG, while that drop looks steep, it still falls within normal Elliott Wave behavior.

XRP Elliott Wave EGRAG Crypto
XRP Elliott Wave | EGRAG Crypto

Wave 2 typically retraces between 50% and 61.8% of the previous move, and in crypto markets, deeper pullbacks can remain valid. XRP has stayed inside its larger ascending channel during this decline. Earlier this month, the price dropped to $1.1, found solid support near the lower boundary, and then rebounded to $1.42.

EGRAG stressed that as long as XRP holds within that channel, the broader structure remains intact. Notably, the correction has not broken the overall pattern.

XRP Must Reclaim $3.6 to Confirm Wave 3

Now, EGRAG’s projections place Wave 3 targets between $15 and $31, but the move will only begin once XRP proves itself. 

The key level to reclaim sits around $3.6, which matches the previous all-time high. XRP must close above that level on a weekly timeframe and show strong momentum. Without that breakout, the market remains in correction mode.

According to EGRAG, Wave 2 could still drag on or move sideways before the next major push starts. He stressed that calling Wave 3 too early would ignore the rules of the pattern. Essentially, a confirmed weekly close above $3.6 would signal that buyers have taken back control.