Home Blog Page 269

BTCL Advances Node Infrastructure as Markets Enter Capitulation Phase

0

The digital asset market is currently experiencing extreme volatility and signs of capitulation. Global market capitalization has fluctuated between $2.41 trillion and $2.49 trillion following a sharp sell-off that erased more than $500 billion in value over a short period. Market sentiment deteriorated rapidly during the decline. The Fear & Greed Index dropped to levels between 9 and 11, marking “Extreme Fear” and reaching its lowest readings since the 2022 exchange collapse, before recovering slightly to 14.

Periods like this typically reduce participation and speculative activity. Liquidity tightens, risk tolerance contracts, and attention shifts away from short-term narratives. Infrastructure projects operating through these conditions are often evaluated less on momentum and more on whether their systems continue functioning while market activity slows.

BTCL is advancing its deployment under those conditions.

A Defensive Approach During Market Stress

Market drawdowns place pressure on participation models that rely heavily on price expansion. When volatility increases and capital becomes defensive, projects tied primarily to speculative demand tend to lose visibility.

BTCL’s positioning during the current downturn emphasizes operational contribution over market excitement. Network participation centers on execution activity and availability rather than emissions or promotional incentives. If market conditions remain weak, node operators continue receiving network rewards generated from transaction handling. If activity increases, execution demand scales with it.

This structure frames BTCL as a defensive infrastructure deployment during turbulent market cycles.

How Network Activity Translates Into Rewards

BTCL operates as an execution-layer network focused on transaction routing, confirmation coordination, and availability management. Participation involves operating nodes that handle execution flow rather than settlement validation.

Network rewards are distributed based on measurable contribution. Routing volume, responsiveness, uptime consistency, and operational tier all influence how rewards are allocated. Under current network parameters, estimated annualized distributions can reach up to 21%, depending on aggregate transaction demand and node performance. These figures reflect network usage and contribution levels, not fixed payouts or guaranteed outcomes.

There are no mandatory lock periods tied to participation. Rewards accrue only while nodes remain active and meet defined performance thresholds. Nodes that fall below required metrics are deprioritized until performance recovers.

Node Operation Through a Mobile Interface

Node participation within BTCL is managed through a dedicated mobile application. Operators use the app to monitor node status, execution activity, uptime consistency, and reward accumulation.

Real-time metrics allow participants to track routing volume and availability without relying on complex command-line interfaces. The app also delivers alerts related to performance changes or connectivity issues, allowing operators to respond quickly when conditions shift.

This mobile-based control model reduces operational friction while keeping execution responsibility with the operator. For participants navigating volatile markets, the ability to manage infrastructure remotely adds flexibility without expanding system complexity.

Independent Reviews and Team Accountability

Verification plays a larger role during risk-off periods, when scrutiny increases and expansion slows. BTCL has completed independent third-party security reviews examining contract logic, execution behavior, and deployment configuration.

External assessments have been conducted through the SpyWolf and the SolidProof audits, focusing on permission structures, transaction handling, and potential failure scenarios under realistic operating conditions.

Operational accountability is reinforced through independent team identity verification conducted via SpyWolf and Vital Block, confirming the individuals responsible for development and ongoing network operations. These checks establish accountability standards prior to broader participation.

BTCL Supply Structure and Presale Progress

BTCL operates with a fixed total supply of 21,000,000,000 tokens, with allocation defined in advance. 45% is designated for the public presale, 20% for node rewards and network incentives, 15% for liquidity provisioning, 10% for team allocations under vesting conditions, and 10% reserved for ecosystem development and treasury use.

The public presale follows a 20-stage structure. Stage 3, priced at $0.0012, is nearing its end. Presale allocations release 20% at token generation, with the remaining 80% distributed linearly over six to nine months. Team allocations follow a 12-month cliff with extended vesting thereafter.

Token usage remains limited to network function, including routing fees, node participation thresholds, performance-based incentives, and anchoring operations tied to execution-layer activity.

Operating Through Volatility

Capitulation phases often remove speculative support and leave infrastructure exposed to real-world conditions. BTCL’s current deployment unfolds during that environment, placing emphasis on execution behavior, participation discipline, and delivery consistency.

With network rewards tied to execution activity, mobile-based node operation, and verification completed ahead of broader participation, BTCL advances through a period where defensive positioning matters more than expansion narratives. As market conditions stabilize over time, infrastructure built during drawdowns becomes easier to evaluate on what it delivers rather than how it is promoted.

Learn More:

Official Website
Security
How to buy

Disclaimer: This Press release article is provided by the Client. The Client is solely responsible for this page’s content, quality, accuracy, products, advertising, or other materials. Readers should conduct their own research before taking any actions related to the material available on this page. The Crypto Basic is not responsible for the accuracy of info and any damage or loss caused or alleged to be caused by the use of or reliance on any content, goods, or services mentioned in this press release article.

Please note that The Crypto Basic does not endorse or support any content or product on this page. We strongly advise readers to conduct their own research before acting on any information presented here and assume full responsibility for their decisions. This article should not be considered investment advice.

Michael Saylor Says Strategy Will Continue Buying Bitcoin Each Quarter

0

Michael Saylor has reaffirmed that Strategy will continue purchasing Bitcoin every quarter, even as the cryptocurrency faces renewed volatility.

Speaking in a recent television interview, the company’s founder said short-term price fluctuations will not influence its long-term approach. His remarks underscore the firm’s unwavering commitment to Bitcoin as a core treasury asset.

Key Points

  • Strategy will continue buying Bitcoin every quarter, regardless of market volatility.
  • Michael Saylor says short-term Bitcoin volatility will not alter the company’s strategy.
  • Bitcoin is treated as a permanent treasury asset; Strategy has no plans to sell holdings.
  • Strategy holds 714,644 bitcoins, valued at around $49 billion, with some financing coming from debt.
  • The company can maintain Bitcoin purchases despite market downturns due to strong liquidity and lender support.

Quarterly Buying Plan Remains Unchanged

Expanding on this position, Saylor said Strategy’s Bitcoin strategy is designed to be permanent, thereby dismissing suggestions that the company might pause or scale back purchases during market downturns. Instead, he emphasized that accumulation will continue on a regular, quarterly basis regardless of broader market sentiment.

At the same time, Saylor rejected speculation that Strategy could sell its existing holdings. He explained that Bitcoin is treated as a long-term reserve asset, not a vehicle for short-term gains. In fact, this philosophy underpins the company’s decision to buy Bitcoin consistently over time.

Handling Risk and Debt Concerns

Moreover, Saylor addressed concerns about Strategy’s financial risk if Bitcoin prices were to decline further. He said the company is prepared to fulfill its obligations through refinancing if necessary. Even in the event of a severe and prolonged downturn, Strategy would roll its debt forward rather than reduce its Bitcoin exposure.

Building on that point, he expressed confidence that the company would continue to have access to credit, arguing that lenders understand Bitcoin’s volatility and do not view price swings as a threat to its long-term value. Consequently, he said banks would remain willing to work with Strategy.

Strategy’s Bitcoin Holdings

This long-term stance is reflected in the scale of Strategy’s Bitcoin position. According to data published on the company’s website, Strategy holds 714,644 bitcoins. At the time of publication, those holdings were valued at approximately $49 billion, making Strategy the largest known corporate holder of the digital asset.

Much of this accumulation has been financed through debt. Strategy reportedly carries more than $8 billion in total debt, including convertible notes issued specifically to fund Bitcoin purchases.

Market Conditions Add Pressure

Saylor’s comments come as Bitcoin trades well below recent highs. The cryptocurrency was last priced near $68,970, down about 9% over the past five days. Earlier in the week, Bitcoin briefly fell to around $60,062, its lowest level in roughly 16 months.

At that point, Bitcoin had lost more than half its value from its record high of $126,080.  The pullback has coincided with a broader reassessment by investors of Bitcoin’s utility, adding pressure across the crypto market.

Stock Performance and Liquidity

The weakness in Bitcoin has also weighed on Strategy’s shares. The stock slipped about 2% on Tuesday as Bitcoin dropped below $70,000 again. Over the past three months, Strategy’s shares have declined by more than 40%.

Despite these market pressures, Saylor highlighted the company’s liquidity position. He said Strategy holds sufficient cash to cover dividend payments for roughly two and a half years, a buffer he argued supports the company’s ability to maintain its quarterly Bitcoin purchases without disruption.

Shiba Inu Buy-Side Liquidity and Strong Support Hint at Rebound

0

While downside pressure dominates the market amid price weakness, several factors point to a near-term recovery course for Shiba Inu.

Indeed, Shiba Inu looks fragile as the broader market continues to consolidate. The meme coin is down across all timeframes, as its price gravitates towards lower price levels.

Yet all hope is not lost, as Shiba Inu might recover higher. Its strong support and the buy-side liquidity above suggest the token could be set on a rebound course to greater heights.

Key Points

  • While downside pressure dominates amid price weakness, several factors point to a near-term recovery course for Shiba Inu.
  • Support around $0.0000060 to $0.0000056 is crucial for SHIB, as it has never broken below it since its market debut over four years ago.
  • Data shows that the exchange reserve has dropped over 316 billion SHIB in the past five days to 81.3 trillion tokens, as holders move their stash away from exchanges.
  • Another factor that could drive SHIB higher is the buy-side liquidity at higher prices.

Weekly Support Holds Strong

Shiba Inu currently trades within a weekly support zone. Notably, this area, around $0.0000060 to $0.0000056, is crucial for SHIB, as it has never broken below it since its market debut over four years ago.

Notably, it has maintained a price above this level so far, rebounding considerably from a drop to $0.00000507 last week. As long as Shiba Inu holds above this support level, it could rebound to higher prices.

Interestingly, on-chain metrics add to the optimistic view. CryptoQuant data shows that the exchange reserve has dropped over 316 billion SHIB in the past five days to 81.3 trillion tokens, as holders move their stash away from exchanges. The move suggests that buying pressure is slowly returning as holders accumulate rather than sell their tokens on exchanges.

Shiba Inu Exchange Reserve/CryptoQuant

Buy-Side Liquidity

Another factor that could drive SHIB higher is the buy-side liquidity at higher prices. For the uninitiated, this refers to a level with large volumes of unfiled buy orders. Typically, these are price magnets, and an asset tends toward them to grab liquidity.

Derivatives data from Coinglass show that massive liquidity is concentrated around the $0.000010 level, with $591,630 in liquidation leverage at risk of a wipeout if the price reclaims this psychological level. Before that, there are also lower-liquidity blocks. The chart shows that liquidity is greater on the upside than on the downside, as traders are heavily skewed toward further price corrections.

Buy-side liquidity also lies around $0.0000350, and a steady recovery could ensure that Shiba Inu reaches the multi-year high. On the way to this price, potential profit targets are $0.0000150 and $0.000025, where significant resistance levels exist.

Shiba Inu TPs and Buy-Side Liquidity

Dogecoin Price Outlook for Feb 10: Here’s Key Level for DOGE to Reclaim as $2.07M Liquidated From Market

0

Dogecoin remains under pressure as heavy long liquidations and technical resistance define a critical reclaim zone that will shape its next move.

Dogecoin (DOGE) is once again testing investor patience as short-term weakness collides with steady market participation. DOGE is trading at $0.0934, down 1.5% over the past 24 hours, after failing to sustain earlier intraday gains. The meme coin has moved within a daily range of $0.09267 to $0.09674, reflecting tight but persistent selling pressure. 

Despite the pullback, DOGE has outperformed Bitcoin on the day, gaining 0.6% versus BTC, although broader trends remain under strain. The largest memecoin by market cap has struggled in the longer-term, including 13.6% losses over seven days and 33% in the past 30 days.

With short-term volatility building and relative strength flashing against Bitcoin, the key question now is whether Dogecoin can set up its next decisive move.

Dogecoin Price Analysis

Dogecoin remains under sustained pressure on the weekly chart, with the price above $0.08, a zone that now defines the most immediate support. A decisive weekly close below this level would expose DOGE to deeper downside, with the next notable support likely emerging around the $0.06 region. Until buyers defend the current base convincingly, downside risks remain elevated.

DOGEUSD 1-Week Chart

On the upside, Dogecoin faces layered resistance that reinforces the broader bearish structure. The first major ceiling sits near $0.175, aligning closely with the 50-week EMA, as well as the 100-week EMA. Beyond that, prior weekly highs around $0.20–$0.25 represent a heavier resistance band. Without a recovery of the EMA zone, upside moves will likely remain corrective.

Momentum indicators continue to reflect weakening conditions. The weekly True Strength Index (TSI) remains firmly in negative territory, with both TSI and signal lines trending lower. Until the TSI moves to the positive region and the TSI line flips above the signal line, the technical setup favors caution.

DOGE Liquidation Data

Liquidation data adds another layer to Dogecoin’s current market stress. Over the past 24 hours, total liquidations reached $2.07 million, with long positions accounting for roughly $1.60 million, far outweighing $477.87K in short liquidations. This imbalance shows that most forced exits came from traders betting on upside.

Dogecoin Liquidation

Shorter time frames tell a similar story. In the last 12 hours, liquidations totaled $893.09K, with longs contributing $834.24K, compared to just $58.84K from shorts. Even in the most recent 4-hour window, nearly the entire $310.32K wiped out came from long positions, while shorts lost only $5,17K.

Ethereum Prediction for Feb 10: Here’s Next Resistance After ETH Breaches 20-Day SMA 

0

Ethereum faces elevated volatility after slipping below key technical levels, with traders watching resistance zones and divergence signals. Where next?

A sharp Ethereum (ETH) price sell-off has put the second-largest crypto asset back under pressure. ETH is trading around $2,011, down 3.12% over the past 24 hours, with intraday price action breaking lower after failing to hold above the support between $2,015–$2,100. The daily range has compressed toward the downside, signaling aggressive selling into weakness.

Broader performance metrics reinforce the bearish tone. Ethereum is down 14.22% over the past week, and 34.75% in the last 30 days, while losses deepen to 41.12% over 90 days. 

Market capitalization now stands near $242.5 billion, with $4.79 billion in spot volume and $58 billion worth of futures volume over 24 hours. Despite the sell-off, long/short ratios remain elevated above 2.3 on Binance and 2.5 on OKX.

With ETH breaking lower into a critical psychological zone and positioning still skewed long, the market now faces a pivotal question: Does this flush mark the final shakeout before stabilization, or is Ethereum setting up for another leg lower before buyers step back in?

Is Ethereum’s Stabilization Ahead?

On the technical end, Ethereum remains under heavy pressure after slipping below the lower half of its recent range, with price now hovering just above the psychological $2,000 area. This zone now acts as near-term support, but it sits well above the lower Bollinger Band near $1,684, which represents the next major downside buffer if selling resumes. 

ETHUSD 1-Day Chart
ETHUSD 1-Day Chart

On the upside, recovery attempts face layered resistance. The first major barrier is the 20-day SMA, which aligns with the Bollinger mid-band near $2,488. This level has capped price repeatedly and defines the line between corrective bounces and a broader trend shift.

Above it, the upper Bollinger Band near $3,291 marks the wider resistance ceiling, representing the extreme of the recent volatility envelope and a level sellers previously defended aggressively.

Volatility remains high, with the 20-period standard deviation rising to about 401.77, signaling expanding price swings. Bollinger Bands are still wide, confirming that Ethereum is trading in a high-volatility environment.

Until volatility contracts and price reclaims the mid-band, momentum stays skewed to the downside. A flattening standard deviation alongside a move back above the 20-day SMA would be the first technical sign that bearish pressure may be easing.

Can Ethereum Reach $5,000?

Elsewhere, analyst Javon Marks highlighted a developing hidden bullish divergence on Ethereum’s chart. According to Marks, ETH has printed a higher low on price while momentum indicators continue to register lower lows, signaling weakening downside pressure beneath the surface. 

Ethereum Prediction
Ethereum Prediction

If confirmed, Marks argues that this setup leaves room for a sustained recovery phase, with Ethereum potentially rallying back toward the $5,000 region. To reach $5,000 from the current price of $2,011, ETH would need to surge by approximately 148.6%.

Bitcoin at Crossroads: Can February Break the Back-to-Back Loss Streak?

0

Bitcoin is flashing renewed stability this month, backed by a notable seasonal pattern, as it has never posted back-to-back losses in January and February.

Key Points

  • Bitcoin has fallen 12.55% in February, following a 10.16% drop in January, testing a long-standing seasonal pattern.
  • Historically, February has rebounded after a losing January (observed in 2015, 2016, 2018, 2019, 2022).
  • Extreme pessimism prevails: the crypto Fear & Greed Index hit 5 (lowest ever), and Bitcoin’s RSI at 15 signals oversold conditions.
  • Short positions totaling $5.45 billion could be liquidated if Bitcoin rises to around $10,000, potentially triggering a short squeeze.
  • Bitcoin trades well below the 50-day ($87K) and 200-day ($102K) moving averages, limiting immediate upside.
  • Key support levels remain near $60K, with longer-term Fibonacci levels around $57K–$42K guiding potential downside.

Historical Trends Put February in Focus

For context, Bitcoin is currently trading near $68,789, marking a 12.55% decline so far this month. Meanwhile, January also ended with losses, as Bitcoin fell 10.16% over the month.

Consequently, this consecutive weakness has drawn close attention from traders because it stands in contrast to past behavior. Historical data shows that whenever Bitcoin finished January in the red, February typically brought gains. Years such as 2015, 2016, 2018, 2019, and 2022 clearly illustrate this pattern.

Therefore, February has become a pivotal test. A second consecutive monthly loss would mark the first instance of declines across both months, thus breaking a long-standing seasonal tendency.

Market Data Suggesting a Rebound in February

Short-Term Price Action Shows Early Stabilization

Against this backdrop, Bitcoin briefly climbed above $71,000 on Monday, following a sharp dip in market sentiment. This bounce coincided with extreme pessimism across the crypto sector, a condition that often precedes short-term stabilization.

In this context, some market participants argue that elevated fear levels could help Bitcoin defend the $60,000 region, widely regarded as a key annual support level. However, others caution that weak liquidity and bearish positioning in futures markets may cap any near-term upside.

Extreme Fear Highlights Oversold Conditions

Sentiment indicators now sit at levels rarely seen. Michaël van de Poppe, founder of MN Capital, highlighted that the Crypto Fear & Greed Index dropped to 5 — its lowest reading on record. Meanwhile, Bitcoin’s daily relative strength index fell to 15, signaling exhaustion.

Van de Poppe compared current conditions to those seen during the 2018 bear market and the March 2020 COVID-19 crash. Based on these parallels, he suggested Bitcoin could stabilize and attempt a recovery without immediately retesting the $60,000 level.

Liquidation Data Favors an Upside Squeeze

Beyond sentiment, derivatives data offer additional support for a rebound scenario. Figures from CoinGlass show that approximately $5.45 billion in short positions would be liquidated if Bitcoin rises by around $10,000.

In comparison, a move back to $60,000 would trigger about $2.4 billion in liquidations. This imbalance suggests upward price movement could force short sellers to close positions, potentially accelerating a rally through a short squeeze.

Indeed, such liquidation dynamics often play a decisive role during periods of heightened volatility.

Bitcoin Exchange Liquidation Map

Technical Structure Remains a Limiting Factor

Despite supportive seasonal and sentiment signals, Bitcoin’s broader technical structure remains weak. Data from CryptoQuant shows the asset trading well below key moving averages.

The 50-day moving average stands near $87,000, while the 200-day average is close to $102,000. This wide separation reflects an ongoing corrective phase following the previous rally.

Additionally, CryptoQuant’s Price Z-Score stands at -1.6, indicating Bitcoin is trading below its statistical mean. Historically, similar setups have often led to extended consolidation periods rather than immediate trend reversals.

Derivatives Markets Signal Continued Caution

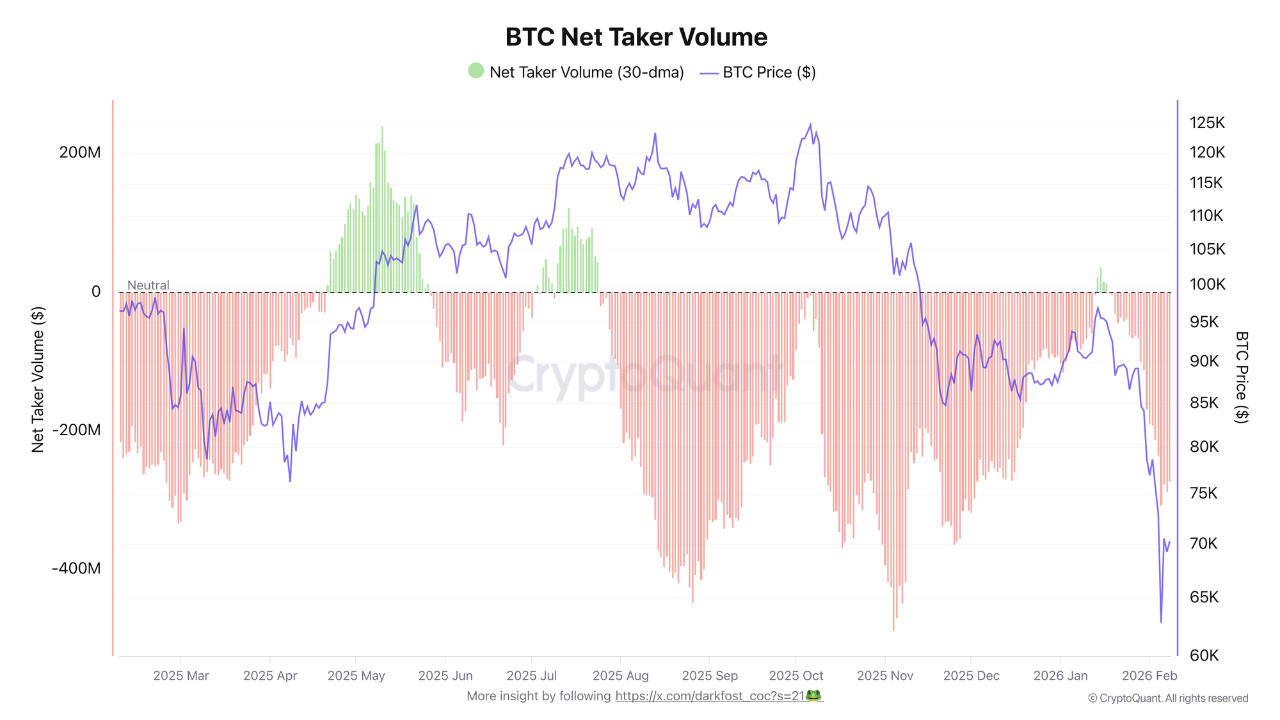
Derivatives activity further underscores ongoing caution. Crypto analyst Darkfrost noted that monthly net taker volume dropped sharply to -$272 million.

Meanwhile, Binance’s taker buy-sell ratio fell below 1, indicating that selling activity is currently outpacing buying interest. Futures volumes continue to outweigh spot market activity, suggesting that sustained upside may require renewed spot demand. Until that shift materializes, recovery attempts could remain fragile.

Longer-Term Levels Stay in Focus

Looking beyond the near term, Bitcoin investor Jelle pointed to historical behavior around Fibonacci retracement levels. Specifically, in prior cycles, bear market bottoms frequently formed below the 0.618 retracement level.

In the current cycle, that level is positioned near $57,000, with deeper downside projections extending toward $42,000 if historical patterns repeat. For now, however, these levels serve as longer-term reference points rather than immediate targets.

As February unfolds, attention remains fixed on whether Bitcoin can uphold its historical tendency toward recovery. 

What Could Happen as Cardano Fails to Reach Descending Channel Resistance

0

Cardano has failed to reclaim higher resistance levels as weak momentum persists, potentially paving the way for further price declines.

Cardano trades within a descending channel and has repeatedly made lower highs and lower lows. After dropping to the structure’s lower support level following its February 6 crash to multi-year lows, the coin has yet to show recovery signs.

Key Points

  • Cardano has failed to reclaim higher resistance levels as weak momentum persists, potentially paving the way for further price declines.
  • Technical analysis points to repeated lower-high rejections for ADA in the channel, dating back to the early November high of $0.6069.
  • The momentum remains bearish after dropping to $0.22, as it has not shown the strength to even reclaim the descending resistance zone.
  • Unless conditions change, ADA might decline further to the $0.220 lows.

Cardano Looks Bearish

Technical analysis points to repeated lower-high rejections for ADA in the channel, dating back to the early November high of $0.6069. The cryptocurrency has seen its price action contained within the channel as it slides consistently to lower prices.

Recently, Cardano dropped to the channel’s support at $0.220 last week before rebounding slightly. The momentum remains bearish, as it has not shown the strength to even reclaim the descending resistance zone.

Cardano Descending Channel

Unless conditions change, ADA might decline further. Analysis suggests that support at $0.22 remains a key level to watch if the coin slides further. The move would culminate in a 16% correction from the current price of $0.262.

However, if Cardano regains momentum from here, it could retest the channel’s upper resistance. A breakout makes things a bit more interesting and sets it on course to reclaim the $0.34 resistance level. Holding here invalidates bearish scenarios for ADA.

Good Entry for Long Positions

A separate analysis still aligns with a bearish bias for Cardano in its current state, but remains optimistic. Specifically, ADA could drop below the $0.25 area to grab liquidity and could rebound if it shows a reaction from there.

Under these circumstances, $0.25 would be an optimal entry point for a long position, as ADA would complete a double bottom if the rebound materializes. This could push the coin toward $0.30, above which there is more liquidity to capture.

Cardano Targets Liquidity at $0.25

Notably, data from Coinglass supports this. At $0.25, there would be a large-scale long liquidation on the ADA/BTC chart on Binance, with up to $424,350 at risk of being wiped out. The next area on the chart with such dense leverage liquidation value is at $0.28, where $735,890 worth of shorts would be forced to exit the market.

ADA/USDT Liquidity Heatmap/Coinglass
ADA/USDT Liquidation Heatmap/Coinglass

Solana Prediction for Feb 10: Can SOL Breach $89 Supertrend Resistance for a Move Up?

0

Solana trades below key trend resistance as momentum stabilizes, with traders watching whether weakening downside pressure can turn into a sustained recovery.

The Solana (SOL) price action is flashing mixed signals as volatility tightens across the market, raising a key question about the near-term direction. SOL is trading at $85.42, down 0.8% over the past 24 hours, with the daily range stretching from $82.99 to $88.27. 

Market capitalization stands at $48.48 billion, while 24-hour trading volume reached $4.19 billion, pointing to sustained participation despite the pullback. On a relative basis, SOL shows resilience against Bitcoin, gaining 0.9% versus BTC, even as broader timeframes remain pressured, including -18.3% over seven days and -31.2% in the past 14 days. 

With volatility compressing and relative strength against BTC emerging, traders are now watching closely to see whether this range resolves into continuation or sets up the next decisive move.

What’s Next for Solana

Solana is currently trading under clear technical pressure, with $70–$83 acting as the immediate support zone on the 4-hour chart. This area has absorbed multiple pullbacks following the sharp sell-off that briefly pushed the price below $76, forming a short-term base. If this support fails, downside risk opens toward the $67 level, which aligns with the prior reversal area. 

Solana 4-Hour Chart
Solana 4-Hour Chart

On the upside, resistance is firmly defined by the Supertrend, which sits near $88.99 and continues to cap recovery attempts. Price remains below this level, keeping the broader structure bearish. A sustained move above the Supertrend would be necessary to shift momentum and expose higher resistance zones around the $94–$98 area, where previous breakdowns accelerated selling pressure.

Meanwhile, momentum indicators show early stabilization. Specifically, the MACD remains below the zero line, with the signal and MACD lines still negative, though the histogram has started turning green, suggesting downside momentum is weakening. Also, the MACD line has finally crossed above the signal line, another positive signal.

Solana’s Bottom Signal?

Elsewhere, market intelligence firm Santiment reports that Solana ETFs recorded $11.9 million in net outflows on Feb. 6. This marked the second-largest single-day outflow on record, trailing only the December 3 figure.

Solana ETF Dashboard

Meanwhile, further data shows that over the past four months, SOL has shed roughly 62% of its market capitalization, reflecting sustained selling pressure across both spot and institutional-linked products. 

Santiment notes that this scale of capital exit often coincides with late-stage sell-offs, suggesting traders may be nearing capitulation territory. Historically, similar spikes in ETF outflows have aligned with market bottoms, as forced selling exhausts downside momentum and sets the stage for stabilization.

XRP Rips Every Time the Ratio Drops as Bitcoin Dominance Ratio Now Compressing

0

With Bitcoin dominance now compressing, market data shows that XRP often rips whenever the ratio witnesses a decline.

Amid the multi-month downtrend that has stifled price action across the crypto market, the Bitcoin dominance ratio has continued to decline over the past few months. Since July 2025, Bitcoin’s dominance has collapsed from 65.2% to the current ratio of 59.3%, representing a 9% decline in seven months.

Interestingly, as consolidation emerges, the Bitcoin dominance now appears to be compressing on the weekly timeline, hinting at a potential volatility spike to the upside or downside. Notably, if the dominance drops to the downside, XRP could “rip,” according to historical price action.

Key Points

  • While the ongoing downtrend has impacted the broader crypto market, Bitcoin seems to be performing worse than the altcoin market.
  • This difference in performance has led to a decline in the Bitcoin dominance, with a sharp drop from 65.2% in July 2025 to the current 59.27%.
  • The Bitcoin dominance now faces a long consolidation phase, with the Bollinger Bands indicating a current compression.
  • Compressions often lead to increased volatility to the upside or downside, and if dominance drops to the downside, altcoins could record gains.
  • XRP, being one of the most liquid altcoins in the market, has historically benefited from such declines.

Bitcoin Dominance Performance

This is according to a recent market exposition from CryptoInsightUK, a notable chartist. For context, Bitcoin appears to be suffering some of the steepest declines in the ongoing downward trend that has persisted over the past few months.

Notably, the altcoin market cap (TOTAL2 on TradingView) has dropped 17.7% from $1.15 trillion in July 2025 to the current figure of $946 billion. However, Bitcoin’s market cap has declined by a more substantial 35% from $2.13 trillion to $1.38 trillion today. This confirms that Bitcoin has underperformed compared to altcoins.

As a result, the Bitcoin dominance ratio has continued to see declines since July 2025, with altcoins holding up better than the premier crypto asset during the downtrend. Specifically, Bitcoin’s dominance stood at 65.2% in July 2025. However, today, it has dropped to 59.3%, marking a 9% crash.

Bitcoin Dominance Crash

Bitcoin Dominance Now Compressing

Meanwhile, CryptoInsightUK confirmed that following this crash, the Bitcoin dominance ratio has now begun consolidating, leading to compression, as indicated by the tightening of the Bollinger Bands.

According to the analyst, the Bollinger Bands around Bitcoin’s dominance appear to be the tightest they have ever been in history. This points to an unprecedented compression scale. He expects the compression to also pick up on the monthly timeframe. 

Bitcoin Dominance Tight Weekly Bollinger Bands CryptoInsightUK
Bitcoin Dominance Tight Weekly Bollinger Bands | CryptoInsightUK

Typically, when the Bollinger Bands tighten in this manner, what follows is increased volatility to either the upside or the downside. CryptoInsightUK remains uncertain which direction it could take, but he stressed that if it resolves to the downside, altcoins like XRP could skyrocket.

XRP Could “Rip”

In a subsequent disclosure, he confirmed that when the Bitcoin dominance collapsed about 11% from 61.53% to 54.56% in late 2024, this coincided with an XRP spike of 490% to $2.9 within the same period. This confirms the suggestion that a decline in the Bitcoin dominance ratio could translate to a spike in XRP’s price.

CryptoInsightUK noted that if Bitcoin’s dominance does witness high volatility as expected, investors should prepare for what’s to come. “On EVERY occasion BTC.D has dropped, XRP has ripped,” the market watcher concluded.

Shiba Inu Risks Slide to $0.0000055 as Sellers Dominate Price Action

0

As the broader crypto market endured another pullback yesterday, analysts are now assessing what lies ahead for Shiba Inu. 

Market watchers believe Shiba Inu remains in a vulnerable position with sellers dictating its short-term price action.

Key Points

  • Shiba Inu remains technically vulnerable, with sellers firmly controlling short-term price action.
  • A descending trendline near $0.0000065 defines SHIB’s latest weakness and may cap upside attempts.
  • If this resistance holds, analysts warn that SHIB risks sliding toward $0.0000055.
  • A decisive breakout above the trendline would invalidate the bearish outlook and signal a shift in momentum.

Shiba Inu Still Within a Bearish Structure

In a recent commentary, analyst HolderStat examined the 30-minute SHIB/USDT chart and noted that Shiba Inu continues to trade within a bearish structure defined by a descending trendline. This setup, reinforced by a sequence of lower highs and lower lows, confirms sustained selling pressure.

Recently, SHIB suffered a sharp sell-off alongside the broader market, which dragged the price to around $0.0000055 before a bounce from the local low. However, the recovery lost momentum and failed to break above the descending resistance near $0.0000065.

As a result, HolderStat stresses that price is now consolidating below the main descending trendline. In addition, the analyst suggested that a weak rising support line is forming beneath the price, creating a tightening compression zone that reflects fading bullish strength.

image

Further Downside for SHIB

Per HolderStat’s analysis, the sloping trendline continues to act as dynamic resistance, reinforced by multiple prior rejection areas. If this level holds, HolderStat warns that SHIB is likely to resume its downward move, with price potentially revisiting the $0.0000055 zone seen last week.

Conversely, a decisive breakout and sustained close above resistance would invalidate the bearish bias and signal a short-term trend shift. Until then, SHIB remains technically fragile, with sellers maintaining structural control and downside pressure still favored.

Next Move

HolderStat’s analysis comes amid a recent market pullback. After trading near $0.0000062 yesterday, SHIB quickly lost momentum and slipped to around $0.0000060. This reinforced the view that the bearish trend has dominated recent sessions.

At $0.000006018, the token is down 1.69% over the past 24 hours, extending its weekly decline to 12%. At the same time, SHIB posts losses of 30.24% over the past 30 days and 13.2% year-to-date.

Technically, SHIB faces immediate resistance at $0.0000065, with higher barriers at $0.00000705 and $0.00000847. Meanwhile, $0.00000562 stands as the nearest support zone.