Home Blog Page 270

Cardano Already Back to the Previous Bear Market Lows: What’s Next

0

Barely a few months after the crypto market peaked, Cardano has already reached the lows seen during the previous bear market.

Notably, Bitcoin topped in October after an ATH of $126,200, but Cardano peaked a few months earlier. ADA reached a lower high of $1.019 in August, which was its highest price of 2025, a year historically marked by bullish expansion in previous cycles.

Since then, Cardano has been on a downtrend, joining a broader market move. The downward movement now places it 74% below the yearly high and close to the previous cycle’s bear market low.

Key Points

  • Barely a few months after the crypto market peaked, Cardano has already reached the lows seen during the previous bear market.
  • On February 6, ADA dropped to a low of $0.2205 as prices continued to trend southwards.
  • The last time the coin dropped to this price level was in June 2023, when it reached $0.2200, aligning with the 2022/2023 bear market bottom.
  • Another concerning trend is that Cardano visited this previous cycle low without making a new all-time high.
  • In the meantime, ADA stands at a critical price support level, and if the bear market unfolds as seen previously, prices could drop further to new record lows.

Cardano Hits Multi-Year Lows

On February 6, ADA dropped to a low of $0.2205 as prices continued to trend southwards. Meanwhile, this low was notable, as it was the coin’s lowest price in several years.

The last time the coin dropped to this price level was in June 2023, when it reached $0.2200. Interestingly, this marked its bear market bottom, as ADA consolidated slightly before starting a recovery phase that pushed it to $1.326 over a year later.

Cardano Reach Previous Cycle Bottom

What is interesting about the recent drop to bear-market lows is how fast it happened. From the August 2025 high, ADA dropped to this level in five months, 17 months earlier than the previous cycle. For context, from the August 2021 peak, it took Cardano 22 months to correct to the June 2023 low, following an elongated correction.

However, some might argue it took longer. While Bitcoin peaked in October and other major assets reached new ATHs and multi-year highs a few months earlier or later, Cardano’s highest price this cycle was 15 months ago, at $1.326 in December 2024.

No New All-Time High Before Dump

Another concerning trend is that Cardano visited this previous cycle low without making a new all-time high. Surprisingly, it didn’t even come close to its 2021 peak price, unlike some other major altcoins. At its peak of $1.326 this cycle, it was roughly 134% away from its ATH of $3.10.

Notably, it is not alone in this plight, as most other altcoins also didn’t make new ATHs this cycle. Aside from Ethereum, BNB, and contentiously XRP, other top altcoins struggled to rise explosively as seen in the past cycle. This comes as the “altcoin season” did not materialize, with capital not largely rotating to smaller coins as previously seen.

In the meantime, ADA stands at a critical price support level, with concerns that if the bear market unfolds as seen previously, it could drop further to new record lows. However, analysts argue that as the market did not experience the heavy rallies seen in previous cycles, it may not correct as much as before.

Dogecoin Founder Slams Strategy for Buying Bitcoin at Elevated Prices

0

Dogecoin co-founder Billy Markus has taken a public swipe at Strategy’s latest Bitcoin purchase, questioning the timing amid the company’s growing unrealized losses.

His remarks surfaced shortly after Strategy disclosed another major Bitcoin acquisition, reigniting debate around its aggressive accumulation strategy amid heightened market volatility.

Key Points

  • Dogecoin co-founder Billy Markus criticized Strategy for buying Bitcoin at high prices amid market volatility.
  • Strategy purchased 1,142 BTC for $90 million, raising total holdings to 714,644 BTC.
  • The company faces over $5 billion in unrealized losses on its Bitcoin portfolio.
  • Company leadership has reiterated that it has no plans to sell Bitcoin despite ongoing losses and market pressure.

Dogecoin Founder Reacts to High-Cost Bitcoin Buy

Markus, who posts under the name Shibetoshi Nakamoto on X, responded pointedly to Strategy’s announcement. In a sarcastic post, he said it “took talent” to buy Bitcoin at such elevated prices, given current market conditions.


The comment quickly gained traction, coming on the heels of fresh statements from Strategy founder Michael Saylor. Specifically, Saylor confirmed that the company had completed another scheduled Bitcoin purchase, maintaining its long-standing accumulation approach despite recent price weakness.

Strategy Pushes Ahead With Bitcoin Accumulation

According to Saylor, Strategy acquired 1,142 Bitcoin for roughly $90 million, paying an average price of $78,815 per coin. The purchase brings the company’s total Bitcoin holdings to 714,644 BTC.

In total, Strategy has invested approximately $54.35 billion into Bitcoin, with a blended average acquisition price of about $76,056 per coin.

However, with Bitcoin now trading below that level, the company is facing mounting pressure. Indeed, data from DropsTab show that Strategy is currently sitting on unrealized losses of more than $5 billion.

Moreover, additional details disclosed in an SEC filing revealed that the purchase was funded through equity issuance. Strategy sold 616,715 MSTR shares last week, generating net proceeds of around $89.5 million.

The transaction occurred during a challenging reporting period for the firm. Strategy recorded a $12.4 billion loss in the fourth quarter of 2025, with company filings attributing part of the decline to unrealized digital asset losses under fair-value accounting rules.

Analysts and Markets React

Alongside Dogecoin founder, market analyst Maartunn has questioned the timing of the buy, noting that Strategy is already down roughly 10% on its most recent Bitcoin purchase. He further suggested that the company buy near the peak of last week’s price action.

Meanwhile, Strategy’s stock has reflected Bitcoin’s swings. According to Yahoo Finance, MSTR shares opened Monday at about $128, down more than 5% from the prior week’s close of $135.

This pullback followed a sharp rally late last week, when the stock surged as much as 26%. The move coincided with Bitcoin briefly rebounding above $70,000 from a recent low near $60,000. As Bitcoin struggled to hold those gains, renewed selling pressure emerged in Strategy’s shares.

At the time of writing, Bitcoin was trading around $69,505, down approximately 2.1% over the past 24 hours.

Leadership Downplays Liquidation Risk

Even as losses and volatility persist, Strategy’s leadership has sought to reassure investors. During a recent earnings call, CEO Phong Le said the company would only consider liquidating its Bitcoin holdings if prices fell to $8,000 and remained at that level for five consecutive years.

He explained that this scenario relates to obligations tied to Strategy’s convertible notes, which extend through 2032. In line with that view, both Le and Saylor reiterated that the company plans to continue accumulating Bitcoin despite the current market downturn.

XRPL Developer Says 100% Taking Profits on XRP at $10, $27

0

An XRPL developer has stirred discussion around profit-taking levels well above today’s price, prompting mixed reactions from XRP holders who favor a never-sell approach.

Bird, an XRPL developer, shared on X that he was questioned by several people over why he would consider selling XRP at $27.

Key Points

  • XRPL dev Bird sparked debate after saying he’d sell XRP at $27, challenging the never-sell mindset.

  • Bird plans to ladder profits at $10, $27, and higher, citing life goals and past regrets.

  • With XRP near $1.43, some questioned the timing, while others backed profit-taking as risk management.

  • Many community voices favor selling small portions while holding most XRP for the long term.

XRPL Developer Explains His XRP Exit Strategy

According to Bird, taking profits is a deliberate and necessary decision. He said he plans to ladder out of his XRP holdings at $10, $27, and higher targets, stressing that crypto has dominated his life for the past 5 years.

He explained that moving portions of his holdings into cash and RLUSD is about reconnecting with the real world—buying a home, caring for family, and building outside crypto—while still keeping an XRP position.

Bird highlighted that one of his biggest regrets over the years was not taking profits earlier. In his view, securing gains is not betrayal but discipline. The goal is to improve real life, not just watch numbers rise on a screen.

XRP Still at $1.43

Meanwhile, as of today, XRP is trading around $1.43, making the idea of selling at $27 feel distant to many holders.

Some community members questioned why selling targets are being discussed when XRP’s price has not yet reclaimed levels like $4 or $10. However, some others saw Bird’s comments as a healthy reminder about risk management.

Long-Term Bull, Short-Term Discipline

Community figure Arthur supported the idea of taking profits, even while remaining extremely bullish.

He said taking profits at $10 makes sense, despite his belief that XRP could reach $100 over the next 5–10 years. For him, locking in gains along the way doesn’t contradict long-term conviction.

X user Majiq Mat pointed to recent market behavior as a reason to be cautious. He noted that over the last six months, prices have often retraced. In his view, tiered profit-taking is wise because it can allow investors to buy back tokens later if prices fall again.

Selling Small, Holding Big

X user JRBeast shared a more structured approach. He said he plans to sell 10% of his XRP at four different price points, while keeping more than 60% of his holdings for the long term.

This strategy would allow him to more than triple his initial investment while still maintaining a large XRP position.

Another commentator, Saint Street, echoed this view, saying there’s nothing wrong with holding 80% of XRP indefinitely while taking profits on the remaining 20% or any ratio that suits an individual’s goals.

XRP community reactions

Yield Could Change the Equation

Meanwhile, user @naivetyisbliss introduced another angle, asking whether yield-based services could reduce the need to sell.

He suggested that holding 10,000 XRP at $25 and earning a 3% annual return could be appealing, adding that higher price levels, around $50 and above, might be even more compelling for long-term holders.

Garlinghouse Says XRP Will Always Be Top of Mind for Ripple

0

Ripple CEO Brad Garlinghouse has once again reaffirmed Ripple’s long-standing commitment to XRP and its community. 

In an X post, he directly addressed discussions over XRP’s long-term role, emphasizing that XRP remains central to Ripple’s strategy.

Key Points

  • CEO Brad Garlinghouse reaffirmed Ripple’s long-standing commitment to XRP and its community.
  • He stressed that the XRP family will remain top of mind for the company.
  • Ripple reinforces this commitment by holding significant XRP and backing a major corporate XRP treasury initiative.
  • The company recently unveiled an institutional DeFi blueprint for the XRP Ledger, highlighting XRP as the center of the vision.

XRP Family Remains High Priority for Ripple

In the tweet, Garlinghouse welcomed what he described as growing clarity within the community about Ripple’s view of XRP. He stressed that the XRP family has always been, and will continue to be, “top of mind” for the company.

This signals that Ripple continues to prioritize XRP and its broader community as it expands across custody, payments, and real-world asset tokenization. His remarks followed a message from a prominent XRP community figure who observed that the company has stayed true to its original vision of XRP as a bridge asset, despite years of speculation to the contrary.

In the past, concerns emerged that Ripple’s expansion into the stablecoin market and enterprise products could dilute XRP’s role. However, his message underscores continuity rather than a shift in direction.

Garlinghouse has repeatedly reinforced XRP’s importance, describing it as Ripple’s “north star” and the heart of its strategy. These commentaries stress that XRP remains foundational to the company’s long-term vision.

XRP Sits at the Center of Ripple’s XRPL Transformation

Last week, Ripple unveiled its institutional DeFi roadmap for the XRP Ledger (XRPL). The roadmap expands XRPL’s scope far beyond simple payments, redefining it as a comprehensive financial infrastructure capable of supporting complex operations such as collateral management and foreign exchange trading.

Within this framework, XRP will facilitate cross-border settlements, enable the movement of collateral, and serve as the network’s transaction fee asset.

Ripple’s Actions Confirm XRP’s Priority

Last year, Ripple joined firms such as Kraken and SBI in a $1 billion initiative to build the world’s largest corporate XRP treasury. Notably, both Ripple and its co-founder, Chris Larsen, have already contributed more than 250 million XRP to the effort.

Meanwhile, Ripple holds nearly 40 billion XRP across escrow and on-chain wallets. Analysts view XRP as critical to Ripple’s financial health as price appreciation directly strengthens the company’s balance sheet, and vice versa.

In addition, Ripple Prime’s roadmap includes integrating XRP into liquidity operations, collateral, and settlement for institutional clients. The company also supports the XL-66 amendment, which seeks to enable native, non-custodial lending on the XRPL.

XRP Could Flip Ethereum and Challenge Bitcoin This Cycle: Analyst

0

XRP has maintained strength against Bitcoin and Ethereum, with the potential to flip Ethereum and challenge Bitcoin this cycle.

The crypto market continues to struggle after months of selling pushed prices to new yearly lows, with XRP, Bitcoin, and Ethereum suffering large losses. However, XRP’s strength against both assets indicates it may outperform them in a recovery push, possibly flipping Ethereum.

Key Points

  • XRP shows conditions that may help it outperform Ethereum and Bitcoin this cycle, possibly flipping Ethereum.
  • As part of these conditions, the XRP/ETH pair has traded in a range since August 2025 and now changes hands at 0.0006989 after a high-volume bullish recovery.
  • Also, XRP/BTC quickly reversed a breakdown to 0.00001792, indicating that XRP has maintained strength against Bitcoin.
  • Large short-liquidity zones sit above XRP at $2.29, near the $3.60 all-time high, and heavily between $4.20 and $4.40, which could lead to potential upside acceleration.
  • XRP dominance recently defended a major support near 3.6%, rebounded with a bullish engulfing candle, and now holds around 3.654%.

Liquidity Above Price and Shifting Capital

This commentary came from CryptoInsightUK, a well-known market analyst. During his analysis, the market watcher first highlighted large pools of short liquidity above XRP’s current price. 

XRP Liquidity CryptoInsightUK
XRP Liquidity | CryptoInsightUK

Specifically, he identified the first major area near $2.29, with larger liquidity pools existing around the previous all-time high of around $3.60. Beyond that, he called attention to heavier liquidity between $4.20 and $4.40. These areas represent zones where upward moves could speed up.

CryptoInsightUK then suggested that crypto does not need huge inflows to rally. Even a small shift of capital from gold and silver could push prices higher. Notably, gold and silver only started rising slightly earlier than crypto, and the gap remains small. As so much money already sits in those markets, a rotation could happen quickly.

XRP/ETH Building Strength

The analyst then turned to the XRP/ETH pair. He pointed out that during the Feb. 5 market crash, XRP fell against Ethereum to a low of 0.0006133 ETH. However, the next day, it rebounded with a strong bullish candle, reaching a peak of 0.0007767 before pulling back. It now trades for 0.0006989 ETH, having recovered the Feb. 5 loss.

XRPETH Chart CryptoInsightUK
XRPETH Chart | CryptoInsightUK

Meanwhile, since August 2025, XRP/ETH has moved sideways in a defined range between 0.0007718 ETH and 0.0006071 ETH.  Notably, this long period of consolidation represents a sign of strength and may set the stage for a move higher against Ethereum.

XRP/BTC Reverses Lower Breakdown

In addition, XRP also shows resilience against Bitcoin. When the Feb. 5 crash happened, XRP/BTC briefly dropped below an existing Bitcoin range to 0.00001792 BTC. However, the following day, buyers stepped in and pushed the pair back above 0.00002 BTC with strong volume.

XRPBTC Chart
XRPBTC Chart

XRP/BTC now trades around 0.00002072 BTC. CryptoInsightUK stressed that this fast recovery suggests XRP’s strength against Bitcoin remains intact. While he pointed out that weekend volume stayed low, weekday trading could help clarify whether the rebound will continue.

XRP Dominance Holds Support

CryptoInsightUK also highlighted XRP dominance, which points to a bullish position. According to the analyst, the dominance recently completed an accumulation wipeout pattern followed by a breakout. It now trades between resistance around 6.127% and support around 3.6%, which acted as a previous resistance level.

XRP Dominance Chart
XRP Dominance Chart

Although dominance briefly dipped below that support and retested a short-term downtrend, buyers quickly defended the level. Interestingly, a bullish engulfing candle formed with strong volume. XRP dominance now sits at 3.654%, holding above support.

With sentiment bearish and momentum stretched to the downside, he believes XRP may be forming a bottom. Based on its strength against Ethereum and Bitcoin and strong volume response, he argued XRP could outperform Ethereum this cycle and possibly challenge Bitcoin during the next major rally. At the current price of $1.43, XRP would need to increase 184% to $4.07 to flip Ethereum, which currently has a market cap of $247.4 billion.

Every Time XRP Hit the Current Extreme Oversold Levels, a 15-40% Bounce Followed

0

XRP recently slipped into an extreme oversold level that has often preceded a 15-40% rebound from the prevailing downtrend.

The cryptocurrency market has not fared well since Q4 2025, and XRP remains one of the biggest victims. Notably, since Q4 2025, XRP has lost nearly 50% of its value, collapsing from $2.84 to the current price of $1.43. However, market data indicates that the persistent downtrend has resulted in extremely oversold RSI readings.

Specifically, the XRP relative strength index (RSI) on the daily timeframe recently slipped to an extreme low of 17, as prices crashed to the $1.11 area. This marked a 12-year floor, representing only the second time the RSI has hit such lows. Interestingly, whenever the RSI dropped to extreme lows, analysts expect a 15-40% rebound.

Key Points

  • XRP has been in the middle of a turbulent market over the past few months, collapsing with the rest of the crypto market.
  • Since Q4 2025, XRP has lost nearly 50% of its value, having dropped from $2.84 in October 2025 to the current price of $1.43.
  • The ongoing downtrend intensified on Feb. 5, 2026, when XRP crashed by more than 19%, leading to a sharp drop in the RSI.
  • The XRP RSI collapsed to an extreme low of 17 on Feb. 5, marking the lowest reading in 14 years and representing only the second time in history that XRP saw such lows.
  • Each time XRP’s RSI drops to extreme lows, analysts typically expect a 15-40% rebound as buyers step into the market.

XRP Slumps Amid Market Downturn

This commentary came from Ripple Bull Winkle, a self-acclaimed crypto researcher, as XRP and the broader crypto market eye a recovery from the ongoing downturn. For context, after hitting the $3.66 peak in July 2025, XRP slipped into a downward-sloping consolidation phase, but largely held above $3.

This changed in Q4 2025, as the Oct. 10 (10/10) market crash kick-started an extensive downward trend that has lingered till today. Notably, from its October 2025 opening price of $2.84, XRP has now dropped 49.6%, as it changes hands at $1.43. This means XRP has lost nearly half of its value since Q4 2025.

The Feb 5 Slump and Its Impact on XRP RSI

Amid this downtrend, XRP and the crypto market recorded their worst day on Feb. 5, 2025, when the global crypto market lost $311 billion. Notably, on this day, XRP slumped 19.6%, marking its largest intraday decline in five years. 

XRP 1D Chart Ripple Bull Winkle
XRP 1D Chart | Ripple Bull Winkle

This sudden crash had a visible impact on the daily RSI, pushing it to an extreme low of 17.07. The Crypto Basic previously confirmed that the RSI across multiple timelines, such as the monthly and weekly, also suffered similar slumps, hitting record lows. Notably, this 17.07 reading on the daily RSI marked the lowest figure since 2014.

“A 15-40% Bounce Followed Within Two Weeks”

In his latest commentary, Winkle suggested that whenever XRP hit such extreme lows in its RSI, what typically follows is a 15-40% rebound within two weeks. “Not sometimes, every time,” the market pundit added, seeking to call attention to the reliability of the momentum signal.

Notably, market data confirms this trend, as XRP has historically rebounded considerably each time the RSI dropped below 30. The last time this occurred was on Oct. 10, when the daily RSI hit 26.43, coinciding with an XRP price low of $1.58. From here, XRP recovered 70% to $2.69 thirteen days later.

Before now, the daily RSI dropped to 26.14 on July 5, 2024, aligning with a price of $0.3825. When the rebound came, XRP soared 65% to $0.63 after twelve days. Another occurrence on April 13, 2024, saw the RSI reach 28.2. What followed was a 35% price rebound from $0.42 to $0.57 in nine days.

This consistent price action has led to Winkle’s confidence that a recurrence could occur this time. He suggested that if XRP followed the pattern, a rebound could push prices to the $2.2 to $2.5 range, with the higher mark representing a new yearly high for XRP. However, investors should be cautious as this remains speculative and may not play out as expected.

What Is a Prop Firm? Your Complete Guide to Trading With Capital

0

If you’ve been trading cryptocurrency with your own money, you’ve probably wondered how professional traders access the capital needed to generate serious returns. The answer often lies in working with a prop firm, short for proprietary trading firm. These companies provide skilled traders with substantial funding to trade financial markets, allowing you to keep most of the profits without risking your personal savings.

But here’s the reality check: prop firms aren’t charities. They profit primarily from evaluation fees, which creates an interesting alignment of incentives. Understanding this business model is crucial before you invest time and money into any challenge.

How Prop Firms Actually Work

The process follows a straightforward structure designed to identify consistently profitable traders while protecting the firm’s capital.

First, you pay an evaluation fee (typically $29 to $500, depending on account size and firm) to enter a challenge. This grants you access to a demo or simulated account ranging from $5,000 to $100,000 or more. Your goal is to hit specific profit targets while respecting strict risk management rules.

Many firms operate two-phase evaluations, though one-phase and no-challenge options are widespread. Phase 1 might require a +10% profit target, while Phase 2 demands +5%. Throughout both phases, you’ll face daily drawdown limits (often 5% of your account balance) and maximum loss thresholds (typically 10% total). Break these rules once, and your evaluation ends immediately.

Pass both phases, and you receive a funded account with real or live-market capital. This is where the model gets interesting for crypto traders specifically. While some firms use simulated environments even after funding, others connect you directly to live exchange order books, meaning your trades execute on actual platforms with real liquidity.

The Profit Split That Changes Everything

Once funded, you trade with the firm’s capital and split profits according to your agreement. Entry-level traders typically start at 70/30 or 80/20 splits in their favor, while top performers can earn 90% of their profits.

Here’s a practical example: you receive a $200,000 funded account, generate $10,000 in profit during your first month, and have an 80/20 split. You keep $8,000, the firm takes $2,000. No personal capital was risked beyond your initial evaluation fee, which many firms refund after your first successful payout.

Payouts vary dramatically by firm. Traditional operations may process withdrawals monthly via bank transfer, while crypto-focused providers offer on-demand stablecoin payouts processed within 12 to 24 hours. For active traders generating consistent profits, this speed difference matters enormously.

The Business Model You Need to Understand

Prop firms generate revenue through two primary channels, and transparency about this helps you evaluate whether a program is legitimate or predatory.

The first and primary revenue stream is evaluation fees. If 100 traders each pay $300 for a challenge and only 10% pass, the firm collects $30,000 while funding just 10 accounts. This math works even if those funded traders are profitable, because the firm already covered costs through failed attempts.

The second stream is profit sharing. When funded traders earn money, the firm takes its percentage. However, this typically serves as secondary revenue for most modern retail-focused firms.

This structure isn’t inherently problematic. It creates alignment because firms benefit when traders succeed and continue generating profits. The red flag appears when firms make evaluations unreasonably difficult, use manipulated spreads, or create arbitrary rule violations to disqualify passing traders before payouts.

Advantages That Make Prop Trading Attractive

Access to substantial capital remains the obvious primary benefit. Individual traders with $5,000 in personal funds can suddenly trade positions sized for $200,000 accounts, dramatically amplifying potential returns without corresponding personal risk.

You’re also protected from catastrophic losses. Blow a funded account by violating drawdown rules, and you lose the opportunity, but not your life savings. This psychological safety lets you trade more objectively without the emotional weight of personal money on the line.

Advanced traders benefit from leverage offerings, access to premium platforms and data feeds, and structured scaling programs. Consistent performers can grow from $25,000 in managed capital to $1,000,000 over time.

For cryptocurrency specialists, the advantages extend further. Crypto markets operate 24/7, and quality firms allow you to hold positions overnight and through weekends without forced closures. You can trade hundreds of pairs across perpetuals, spot, and options, often with no restrictions on strategies like scalping, high-frequency trading, or algorithmic systems.

The Challenges and Realistic Expectations

Strict rules create the primary friction point. Daily drawdown limits mean a single bad trade or unexpected volatility spike can end your evaluation immediately. In crypto markets, where assets can move 10% in minutes, this demands exceptional risk management and sometimes smaller position sizes than you’d prefer.

Evaluation fees represent real costs with no guaranteed return. Most traders don’t pass on their first try, and when you factor in multiple attempts, your total investment before reaching profitability can exceed $1,000 with mid-range fees, though affordable options reduce this risk.

Time investment is substantial. Even with unlimited evaluation periods, developing the consistency required to pass challenges while respecting rules takes most traders several months of focused effort.

Not all funded accounts are equal. Some firms provide simulated capital even after you “pass” meaning your trades never touch real markets. For serious traders, this defeats much of the purpose, making due diligence about live execution critical.

Choosing the Right Fit for Crypto Traders

Asset class specialization matters significantly. Many traditional firms focus on forex or futures, with crypto offerings tacked on as an afterthought. For cryptocurrency traders, working with a crypto-first operation like HyroTrader offers advantages such as robust stablecoin infrastructure, an understanding of 24/7 market dynamics, and platforms built for perpetual contracts and spot pairs.

The evaluation structure deserves close examination. Time-limited challenges create artificial pressure that doesn’t reflect actual trading conditions. Unlimited evaluation periods let you trade your normal strategy without rushing into poor decisions.

Payout speed and currency directly impact your experience. Monthly bank transfers in fiat might work for forex traders, but crypto traders generating regular profits need fast stablecoin withdrawals to maintain capital flexibility.

Platform connectivity determines your actual trading experience. Direct integration with live exchanges through proper interfaces ensures your orders interact with real order books, benefiting from actual liquidity and market conditions.

When evaluating crypto-focused providers, look for those offering unlimited evaluation time, fast stablecoin payouts, and connectivity to live exchange order books. This infrastructure matters when you’re trading volatile assets where execution quality and payout speed directly affect your bottom line.

Getting Started: Your Realistic Roadmap

Before entering any evaluation, ensure you have a proven profitable strategy with at least six months of consistent demo results. Prop firm challenges aren’t where you learn to trade; they’re where you prove existing skills under specific constraints.

Allocate a budget for multiple attempts, setting aside sufficient funds for three to five evaluation fees, while recognizing that mastering profitable trading within strict drawdown constraints necessitates practice, even for seasoned traders.

Begin with smaller account sizes. The disparity between a $25,000 and a $200,000 funded account is predominantly psychological. Demonstrate your process with a smaller capital amount initially, then expand through the firm’s programs instead of incurring higher evaluation fees upfront.

Optimistically, you may pass evaluations and receive your first payout within two to three months. Realistically, plan for four to six months from the commencement of your initial challenge to the receipt of consistent funded account payouts. This consideration includes the time needed to learn the specific rules, account for potential failed attempts, and the duration of evaluation completion.

Allocate a total of $100 to $1,500 for evaluation fees across various attempts prior to achieving profitability, noting that entry fees are generally lower at budget-friendly firms. Additionally, consider your time investment, as this process demands focused effort.

Bitcoin Unrealized Loss Reaches 16% of Its Market Cap—What Does It Mean for Bulls?

0

The latest Bitcoin correction has pushed unrealized losses to levels similar to those seen during severe bear market phases.

This data is worth watching for market enthusiasts, especially bulls, as it reflects the current state of the market cycle. Specifically, unrealized losses have reached 16% of the crypto market cap, suggesting that a considerable number of Bitcoin holders are holding at a loss.

Key Points

  • The latest Bitcoin correction has pushed unrealized losses to levels similar to those seen during severe bear market phases.
  • Specifically, unrealized losses have reached 16% of the crypto market cap, suggesting that a considerable number of Bitcoin holders are holding at a loss.
  • The recent spike suggests that stress is building across the market.
  • The current structure echoes that in early May 2022, another period marked by heavy selling and deteriorating sentiment.

Bitcoin Unrealized Losses at 16%

On-chain data from the market intelligence platform Glassnode has tracked how much of the market is sitting on paper losses.

A shared chart highlighting Bitcoin’s relative unrealized loss shows that at $70,000, unrealized losses account for roughly 16% of total market capitalization. This means that about one-sixth of Bitcoin’s value is currently held at a loss.

Bitcoin Relative Unrealized Loss/Glassnode

The unrealized losses followed a period of severe price correction in Bitcoin. The pioneering cryptocurrency has retraced 11% and 23% in the past seven and 30 days, respectively, as whale sell-offs and market uncertainty heightened. This has wiped billions off the crypto market cap, affecting holders.

Interestingly, that figure marks a sharp shift in sentiment compared to just months ago, when unrealized losses were relatively lower. Notably, the Glassnode tweet was in response to an October 30 post that noted unrealized losses then were 1.3% of BTC’s market cap.

At the time, analyst “CryptoVizArt” argued that the market had not yet experienced the kind of pain typically associated with a true bear phase. According to him, mild downturns historically push unrealized losses above 5%, while deeper bear markets can push the metric above 50%. With losses rising to 16%, the market may be cloer to a bear market.

What Does It Mean for Bitcoin?

Relative unrealized loss measures the share of Bitcoin’s supply that is underwater compared to the current price. When this metric rises, it usually means more holders are trapped above their cost basis, which increases market pressure and the risk of capitulation.

The recent spike suggests that stress is building across the market. Long-term holders are still relatively resilient, but shorter-term participants are feeling the strain as prices trend lower. This growing pool of unrealized losses often appears during transitional periods when bullish momentum fades, and fear starts to dominate.

A Familiar Pattern From 2022

Glassnode noted that the current structure echoes that in early May 2022, another period marked by heavy selling and deteriorating sentiment. Back then, Bitcoin peaked around $40,032 before sliding sharply to $29,451 within weeks. 

That drop triggered a noticeable rise in unrealized losses, similar to what is unfolding today. Notably, the correction didn’t immediately signal the end of the downturn, as Bitcoin slid further before reaching its bottom in November 2022.

While this doesn’t guarantee further declines, it suggests Bitcoin may already be in the early stages of a broader bear market. Historically, these periods take time to unfold before a clearer recovery begins.

Strategy’s Latest 1,142 Bitcoin Buy Already at an $11M Loss

0

Strategy has expanded its Bitcoin holdings again, but the latest purchase has already moved into a loss as Bitcoin continues to struggle below the $70,000 level. 

The company disclosed that it bought 1,142 Bitcoin in early February, but market prices declined shortly afterward, reducing the value of the investment by more than $11 million at the time of disclosure. Notably, this purchase is part of a larger accumulation strategy in 2026, which has so far resulted in sizable unrealized losses. 

Key Points

  • Strategy bought 1,142 Bitcoin between Feb. 2 and 8, 2026, for $90 million at an average price of $78,815 per BTC, including fees.
  • At Bitcoin’s price of about $68,700, the new purchase is worth roughly $78.54 million, leaving an unrealized loss of around $11.46 million.
  • A Form 8-K filed on Feb. 9, 2026, confirmed the transaction and reported total Bitcoin holdings of 714,644 BTC.
  • Strategy has spent about $54.35 billion to acquire its Bitcoin holdings, with an average cost basis of about $76,056 per BTC.
  • In 2026 alone, the company has bought 42,144 Bitcoin for $3.925 billion, which is now worth about $2.895 billion, indicating an unrealized loss of over $1.03 billion.
  • At current prices, Strategy’s total Bitcoin holdings are valued near $49 billion, translating into an overall unrealized loss of roughly $5.06 billion.

Details of the Latest Bitcoin Purchase

According to its Form 8-K, Strategy executed the latest purchase between Feb. 2 and 8, 2026. During this period, the company acquired 1,142 BTC for a total cost of $90 million. Specifically, the company paid an average price of $78,815 per Bitcoin.

After completing the transaction, Strategy’s total Bitcoin holdings rose to 714,644 BTC as of Feb. 8, 2026. According to the Form 8-K, the company has now spent about $54.35 billion to build its entire Bitcoin position. This cements Strategy’s position as the largest corporate holder of Bitcoin globally.

Based on this cumulative investment, Strategy’s average purchase price across all its Bitcoin holdings stands at about $76,056 per BTC, including fees and expenses. With Bitcoin currently trading well below that level, the company’s exposure to short-term price swings has become visible.

Meanwhile, the timing of the latest purchase drew market reactions. For instance, Maartunn, a CryptoQuant analyst, noted that the value of the purchase dropped by roughly 10% almost immediately after the firm announced the acquisition.

Strategy’s 2026 Bitcoin Performance

The recent purchase adds to an aggressive buying streak that Strategy has maintained throughout 2026. So far this year, the company has acquired 42,144 Bitcoin, spending $3.925 billion to do so. 

At Bitcoin’s current price of $68,700, those tokens now carry a market value of about $2.895 billion. This gap leaves Strategy with an unrealized loss of more than $1.03 billion on its 2026 Bitcoin purchases alone. 

Overall, Strategy’s 714,644 BTC, bought for $54.35 billion, now holds a market value of $49 billion, translating into an unrealized loss of about $5.06 billion. Despite this, Michael Saylor, the company’s Chairman, has continued to advocate for the orange pill, urging investors never to sell.

XRP Stands Strong with Biggest Weekly Inflow While Bitcoin Bleeds $264M

0

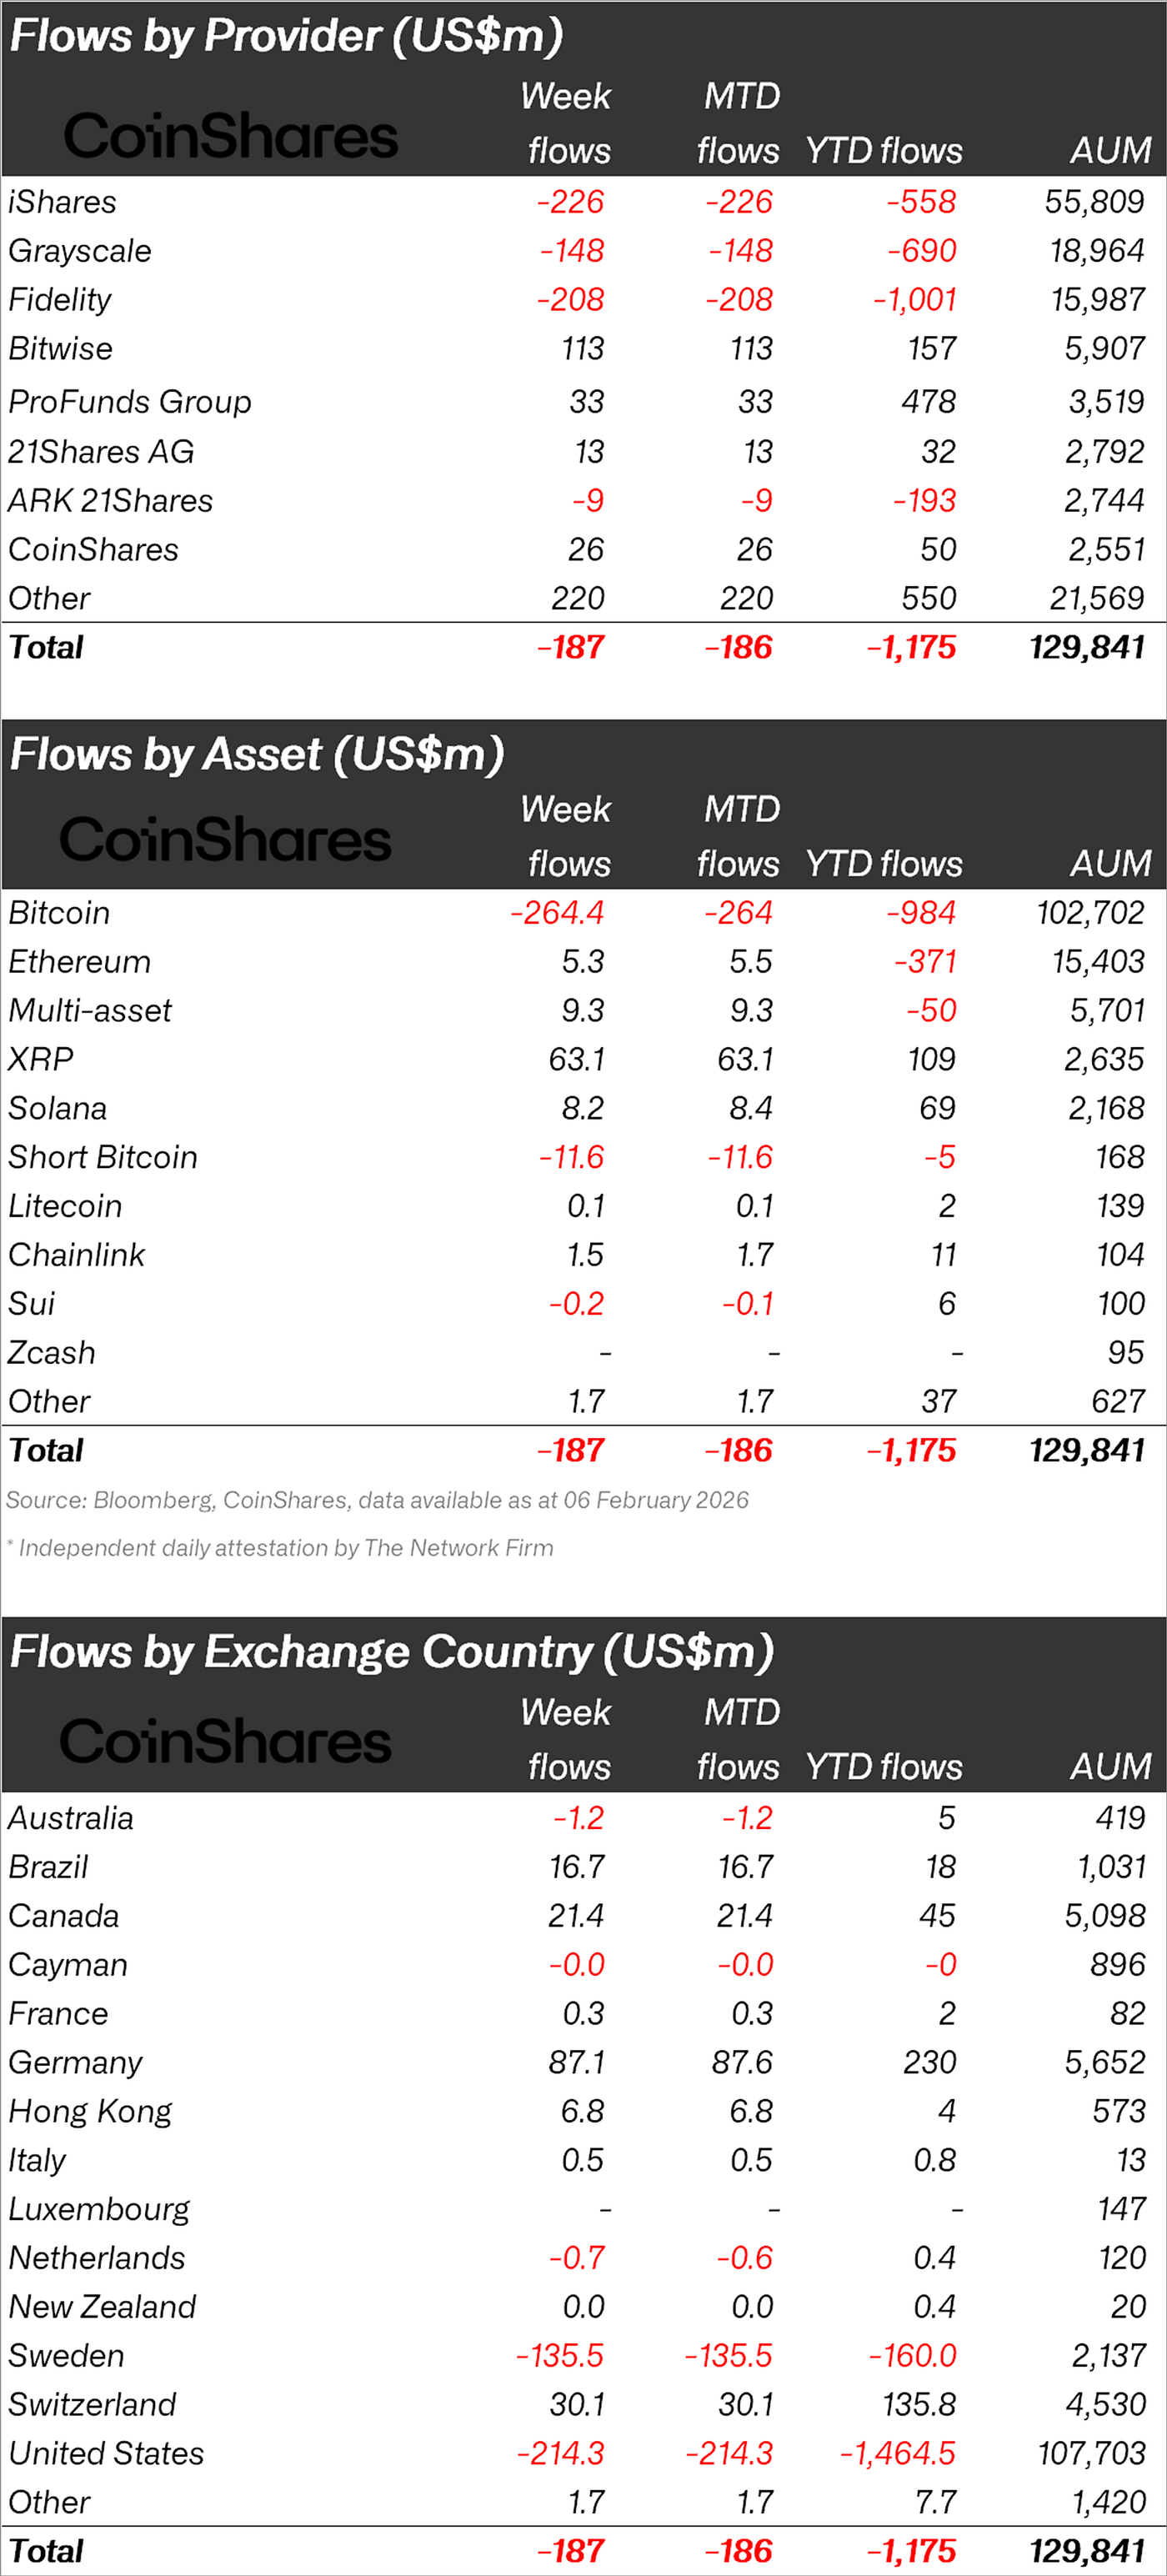
XRP defied market conditions as Bitcoin and other crypto asset investment products recorded $187 million in outflows last week.

The latest figures mark a noticeable slowdown compared to previous weeks. While Bitcoin dominated withdrawals, XRP stood out as one of the strongest performers, attracting fresh inflows even as the broader market remained under pressure.

Key Points

  • XRP posts largest weekly inflow while Bitcoin suffers $264M in outflows.

  • Crypto outflows slow to $187M, signaling stabilizing investor sentiment.

  • XRP leads year-to-date inflows with $109M, outperforming other altcoins.

  • US sees $214M outflows, but Europe and Canada record strong inflows.

Outflows Slow

Notably, the $187 million in cumulative outflows comes after the spot market witnessed a historic downturn, with Bitcoin, XRP, and other crypto assets hitting price levels last seen in 2024. In particular, Bitcoin touched $60,000, while XRP hit $1.11. Despite these losses, outflows for the week slowed compared to previous records.

In its latest weekly report, CoinShares noted that crypto fund flows usually follow price movements, but changes in the pace of outflows are more revealing. The recent slowdown suggests investor sentiment is stabilizing, hinting that the market could be near a short-term bottom.

The recent price drop cut total assets under management (AuM) to $129.8 billion, the lowest since March 2025. Despite lower prices, trading activity surged, with crypto ETP volumes reaching a record $63.1 billion for the week, surpassing October’s previous high.

Bitcoin Sees Heavy Withdrawals

Bitcoin remained the main source of negative sentiment, recording $264 million in weekly outflows. This made BTC the only major asset to see significant withdrawals during the period.

Bitcoin products’ year-to-date flows now sit at $984 million in outflows, while their AuM is $102 billion.

XRP Leads Inflows, Tops Year-to-Date Rankings

In contrast, XRP posted $63.1 million in inflows, outperforming other major altcoins. Solana followed with $8.2 million, while Ethereum attracted $5.3 million in new investments.

Notably, XRP is now the most successful digital asset year-to-date, with total inflows reaching $109 million. This highlights sustained institutional interest even during market weakness.

Europe and the Americas Show Strength

Regionally, several markets recorded solid inflows, led by:

  • Germany: $87.1 million
  • Switzerland: $30.1 million
  • Canada: $21.4 million
  • Brazil: $16.7 million

Meanwhile, the United States continued to see notable outflows of $214 million year-to-date. Outflows from U.S.-based crypto asset products have reached $1.464 billion. Yet, AuM remains strong at $107.7 billion, far ahead of its closest regional competitor, Canada, which has $5.1 billion.

Source: CoinShares
Source: CoinShares

While overall crypto investment products remain under pressure, XRP’s resilience stands out amid the slowdown in outflows.