Home Blog Page 278

Bitcoin Dips to $70K as $840M in Liquidations Hit Crypto Traders

0

The cryptocurrency market reeled after a sharp sell-off sent Bitcoin toward $70,000, triggering a cascade of forced liquidations.

Key Points

  • Bitcoin broke below key January support levels, falling more than 7% to near $70,100.
  • Total crypto market capitalization dropped 6.8% in one day to about $2.49 trillion.
  • Roughly $900 billion has been erased from the crypto market over the past 22 days.
  • Derivatives liquidations totaled about $840 million over 24 hours, driven by long positions.
  • Major altcoins, including Ethereum and XRP, fell between 7% and 9% amid broad-based selling.

Bitcoin Breaks Key Levels Amid Broad Market Decline

Bitcoin fell more than 7% over the past 24 hours, trading near $70,582 at the time of reporting. During the sell-off, it briefly dipped to $70,140, its weakest level since November 2024, according to TradingView data.

Consequently, the move pushed Bitcoin decisively below trading ranges that had underpinned prices for most of January, confirming a technical breakdown and thereby intensifying selling pressure.

Bitcoin Price Chart
Bitcoin Price Chart

Weakness in Bitcoin quickly reverberated across the market. Total cryptocurrency market capitalization slid to $2.49 trillion, representing a 6.8% decline over the day.

Viewed in a broader context, the scale of the downturn is striking: over the past 22 days, the crypto market has shed roughly $900 billion in value, marking the largest sell-off on record.

Altcoins Extend Losses Across the Market

Losses were even more pronounced among major altcoins, underscoring a widespread risk-off shift rather than isolated weakness. Ethereum dropped 7.4% to around $2,097, while XRP fell 9% to $1.44, according to CoinGecko.

Similarly, other large-cap tokens followed suit. Solana declined 6%, Cardano slid 5%, and BNB sank 9%. In addition, meme tokens were not spared: Dogecoin fell 5%, whereas Shiba Inu slipped just over 3%. Overall, the breadth of the decline highlighted broad-based selling across the sector.

Liquidations Accelerate as Leveraged Bets Unwind

The downturn was amplified by heavy activity in derivatives markets. CoinGlass data shows that approximately 172,826 traders were liquidated over the past 24 hours, with total losses reaching about $839.5 million.

Notably, the bulk of the damage came from bullish bets. Nearly $700 million in long positions, largely tied to Bitcoin and Ethereum, were wiped out as prices fell. Liquidations accelerated after Bitcoin broke below the $75,000 and $73,000 levels in quick succession, thereby compounding downside momentum.

Large liquidation clusters were reported on major exchanges, including Binance, Bybit, and Hyperliquid. In contrast, short liquidations remained relatively limited, indicating that the move was driven primarily by overleveraged optimism rather than a sudden reversal against bearish positions.

Crypto Liquidations in the Last 24 Hours

From Late-2024 Optimism to Renewed Caution

The latest sell-off stands in sharp contrast to the rally seen late last year. Following Donald Trump’s election victory, Bitcoin rallied as investors anticipated a more accommodating regulatory environment for digital assets.

That optimism was reinforced by U.S. monetary policy. Interest rate cuts beginning in December 2024 boosted appetite for riskier assets, lifting cryptocurrencies alongside other speculative markets and supporting strong gains into year-end.

Geopolitics and Policy Uncertainty Shift Sentiment

More recently, however, market sentiment has shifted. Gold and other traditional safe-haven assets rallied on Wednesday as tensions between the United States and Iran intensified. This move signaled a broader shift toward caution among investors.

At the same time, uncertainty surrounding U.S. monetary policy has weighed on crypto markets. President Trump’s nomination of former Federal Reserve governor Kevin Warsh as the next Fed chair has raised concerns over future liquidity conditions. Warsh is widely viewed as hawkish, which has fueled fears that tighter financial conditions could lie ahead.

Cardano Nears Entry Into World’s Biggest Derivatives Marketplace

0

The world’s largest derivatives marketplace, CME, has teased the imminent launch of new cryptocurrency futures products, including Cardano.

Set to go live in less than a week, the introduction of ADA futures signals institutional recognition and provides Cardano with new hedging and professional trading tools.

Key Points

  • Cardano futures are scheduled to launch on the CME derivatives marketplace in less than a week.
  • Cardano will debut with both standard and micro futures contracts, expanding access for traders of different profiles.
  • CME will also introduce Stellar and Chainlink futures.
  • These futures will join CME’s existing crypto lineup, which already includes Bitcoin, Ethereum, Solana, and XRP.

Cardano Futures Set for February 9 Launch on CME

In a recent X post, CME urged traders to prepare for the launch on February 9, 2026, as it expands its regulated crypto derivatives lineup. Notably, Cardano will debut with both standard and micro futures contracts on CME.

The standard ADA futures will represent 100,000 ADA per contract, while the micro ADA futures (MCA) will represent 10,000 ADA per contract.

CME to Launch Stellar and Chainlink Futures

In addition, CME plans to roll out futures on Stellar and Chainlink alongside Cardano. Stellar’s standard contract (XLM) will hold 250,000 XLM, with a micro version (MXL) of 12,500 XLM. Meanwhile, Chainlink’s contracts will feature 5,000 LINK for standard futures (LNK) and 250 LINK for micro futures (MLN).

Pricing for the new futures will track the CME CF New York Variant Index, enhancing transparency and aligning ADA, XLM, and LINK with the same institutional benchmarks used for leading crypto derivatives.

Once launched, the contracts will join CME’s existing crypto futures lineup, which includes Bitcoin, Ethereum, Solana, and XRP.

CME Group
CME Group

A Major Institutional Milestone for Cardano

The launch of ADA futures represents a significant milestone for institutional investors. It offers regulated exposure for funds unable to hold spot ADA, improves liquidity, and provides robust risk-management tools. The micro contract reduces capital barriers, broadening access while maintaining regulatory standards.

Notably, some Cardano community figures have described the initiative as ADA’s strongest institutional validation to date, given CME’s stature in global derivatives.

With CME posting 278,300 contracts in average daily volume, worth $12 billion in notional value, and $26.4 billion in open interest last year, Cardano futures are widely expected to gain meaningful adoption on the platform.

Historical XRP Pattern Suggests When the Ongoing Price Fall May End

0

XRP appears to be following an ABC correction pattern from the 2021 cycle, which may suggest when and where the asset could form a bottom.

Notably, the XRP downturn has lingered for longer than most investors expected. After the 35.39% decline in the last quarter of 2025, XRP began 2026 with an aggressive recovery attempt, soaring 31% from $1.84 on Jan. 1 to a high of $2.41 five days later, as investors believed the downturn was over. However, this rally met resistance quickly.

XRP has since corrected 41% from the $2.41 high, currently trading for $1.42, a low last seen in November 2024. As the downturn extends to its fifth month, historical data from XRP’s performance in 2021 has hinted that the current bear phase could end in March 2026 at a bottom price of $1.2.

Key Points

  • After a turbulent Q4 2025, which led to a 35% drawdown in XRP’s price, a rebound ensued earlier this year, resulting in a 31% recovery.
  • While investors believed this marked the end of the downturn, resistance at $2.41 pushed the XRP price back to new lows.
  • XRP now changes hands at $1.42, representing its lowest price since the Trump-led rally in November 2024.
  • With the downward trend now entering its fifth month, historical data suggests an end could come in March 2026 at a low of $1.2.

XRP Now Close to Multi-Year Support Trendline 

Market watcher Charting Guy suggested this during a recent market exposition. The analyst shared an XRP chart indicating that XRP has been trading above a multi-year ascending trendline on the 1-week chart since 2020, after it started recovering from the cycle bottom of $0.1140 in March 2020.

This trendline has acted as a solid dynamic support for XRP in times of sustained bearish pressure, sloping higher to present a reasonable cushion at higher lows over the years. Notably, XRP broke below the support trendline when it dropped below $0.6 in April 2024. However, it recovered and soared above it following the November 2024 rally beyond $1.

After this rally, XRP maintained a position far above the support trendline throughout 2025 despite occasional price declines. However, now that the Q4 2025 downtrend has spilled into 2026, leading to lower prices, XRP trades closer to the trendline that it has been since November 2024.

XRP 1W Chart Charting Guy
XRP 1W Chart | Charting Guy

XRP Could Bottom at $1.2 in March

Currently, the trendline aligns with the price range around $1.05 to $1.1, while XRP changes hands at $1.43, having dropped by more than 22% this year alone. Interestingly, Charting Guy believes XRP could slope further to actually retest the trendline support, but he suggests that a breakdown may not occur.

According to him, the trendline could push toward the $1.2 price by March 2026, with XRP dropping further to this level. However, he believes this development would mark the bottom for XRP, expecting the multi-year trendline to act as the reliable support that could break the ongoing downtrend.

Notably, for XRP to reach $1.2, it would need to decline by an additional 16% from the current price, a move that would take its year-to-date loss to 34.7%. Nonetheless, if Charting Guy’s suggestion proves true, XRP could recover from this level.

Historical Data from XRP’s 2021 Performance

The analyst’s projection was inspired by historical data from XRP’s 2021 performance. Specifically, during the correction that began in 2021 after XRP collapsed from the $1.96 high in April, the prices saw consistent declines for months. However, when XRP retested the trendline at $0.28 in June 2022, this marked the bottom.

From here, XRP recovered, but only saw gradual price upticks that lasted for two years instead of an explosive run. While Charting Guy believes XRP would see a similar bottom at $1.2 in March 2026, he says it is “unlikely” that XRP sees another mild uptick for two years before soaring to new highs.

Data from his chart also points to a similar ABC correction that existed in 2021. Specifically, XRP concluded the C wave in June 2022 at the $0.28 bottom. The chart shows XRP currently trades within another C wave, and could end at $1.2, representing the bottom. This aligns with a previous report from The Crypto Basic.

Shiba Inu Bulls and Bears at Loggerheads Over Crucial Support—What Does Analysis Suggest?

0

Shiba Inu sits at a local support level following the recent downtrend, with bulls and bears fighting to push prices their way.

The token is down 4% in the past 24 hours, a much lower decline than those seen from Bitcoin (-8%), Ethereum (-8.3%), and XRP (-10%). Amid the ongoing downturn, Shiba Inu now stands at a make-or-break support level.

Key Points

  • Shiba Inu trades around a local support level following the recent downtrend, with bulls and bears fighting to push prices their way.
  • Recent data indicate accumulation rather than distribution around this support level, supporting bulls.
  • Key market indicators back the narrative that Shiba Inu might have bottomed.
  • Shiba Inu would have to reclaim moving averages, such as the 100-day MA at $0.000008290 and the 200 EMA at $0.00000992, to confirm bullish momentum.

SHIB At Crucial Support

Currently trading at $0.00000647, SHIB sits at a key local support area. An earlier analysis suggests that support between $0.0000067 and $0.00000521 has marked historical bottoms, and the meme coin has never fallen below that level, further reestablishing its importance.

Meanwhile, bulls and bears are now at loggerheads over this support. This is largely because market participants know that how SHIB reacts in the area will determine whether it hits new record lows or rebounds to retest higher resistance levels.

Notably, recent data indicate accumulation rather than distribution around this support level. For context, CryptoQuant data shows that Shiba Inu has recorded a negative exchange netflow of 5.18 billion SHIB in the past 24 hours, suggesting that more of the token is leaving trading platforms than entering. This signals accumulation as bulls step in to defend the support level.

The SHIB exchange reserve has also dropped from 81.5 billion tokens on February 4 to 81.4 billion today, supporting the accumulation trend. The move suggests buying pressure, as bulls withdraw more of the token’s supply from exchanges for long-term holding.

Shiba Inu Exchange Reserve/CryptoQuant

Is Shiba Inu Nearing Bottom?

Market watcher SwallowAcademy is among some of the analysts suggesting that the meme coin has bottomed. According to his recent TradingView analysis, he sees no “strong logical reason” for SHIB to continue dipping.

Key market indicators back this narrative. For one, the daily RSI stands at 31.45, very close to the oversold territory. The red MACD bars are also receding, indicating slowing bearish momentum. Shiba Inu also has a funding rate of 0.0042%, showing a slightly bullish tone.

As a result, SwallowAcademy expects buyers to take over the market proceedings from here and push the token upwards. His first target for this is the 200-exponential moving average, currently standing at $0.00000992.

Shiba Inu at Support/SwallowAcademy

To achieve this, SHIB would have to reclaim lower moving averages, such as the 100-day MA at $0.000008290, where its price faced selling pressure during the early January run. However, there is no guarantee of this, as price weakness might persist.

XRP Was Created As a New Bitcoin 15 Years Ago: Former Ripple Director

0

A new debate over Bitcoin scalability and decentralization has flared up on X, bringing the XRP Ledger (XRPL) back into the spotlight.

It began after Marshall Hayner, CEO of Metallicus and an early Bitcoin developer, said that Bitcoin has yet to live up to its original technical vision.

Key Points

  • Bitcoin’s scalability debate reignites, putting XRP Ledger back in the spotlight.

  • XRPL seeks to solve Bitcoin’s speed, fee, and transaction limits.

  • Critics dispute XRPL’s decentralization despite independent validators.

  • Institutional interest grows as XRP gains credibility and high-profile investors.

Bitcoin Scaling Problem Returns to the Spotlight

In a tweet, Hayner remarked that Bitcoin still doesn’t have a fully decentralized and scalable version, and that the timing would be perfect if one emerged now.

His comments carried weight because he is an early Bitcoin developer who built one of the first Bitcoin wallets for Facebook in 2009. He framed Bitcoin’s scaling challenge as unfinished business, not a solved problem.

Former Ripple Director: Bitcoin Developers Already Built the Alternative

Former Ripple director Matt Hamilton joined the conversation, arguing that Bitcoin’s scaling issues were solved years ago with the creation of the XRP Ledger.

He suggests early Bitcoin developers intentionally designed XRPL to address Bitcoin’s limits on speed, fees, and transaction capacity, making it a direct response to Bitcoin’s architecture rather than an accidental competitor.

Notably, history supports that claim. Jed McCaleb, one of Bitcoin’s earliest developers and the founder of Mt. Gox, co-created the XRP Ledger in 2011 alongside Arthur Britto and David Schwartz. McCaleb later co-founded Ripple, then known as OpenCoin, before eventually leaving to start Stellar.

Decentralization Debate Resurfaces

Meanwhile, critics challenged the narrative, claiming that XRP is not decentralized. Hamilton pushed back, questioning why decentralization is still disputed when XRPL operates with independent validators and no central mining authority.

Other critics say XRPL is just another base-layer blockchain with its own trade-offs and corporate influence, rather than a true solution to Bitcoin’s problems.

Some commentators accept that XRPL exists because Bitcoin couldn’t scale but wonder why Bitcoin has not adopted a similar model in 15 years.

XRP and Bitcoin Rivalry

Regardless of whether XRPL exists to complement Bitcoin, a strong rivalry persists between the two communities. Bitcoin pundits often warn against investing in XRP, claiming it is centralized and destined to fail. Similarly, XRP proponents often argue that XRP will replace Bitcoin and become the “global standard.”

But a growing number of commentators see XRP and Bitcoin playing complementary roles in finance. For instance, in January, The Crypto Basic reported that Franklin Templeton said XRP is steadily earning institutional credibility like Bitcoin and Ethereum due to ETF activity, real-world utility, and global adoption.

Bitcoin Trader James Wynn Calls XRP a Banking Game-Changer

Back in October 2025, prominent Bitcoin trader James Wynn joined the XRP community by investing $25 million into XRP. Known for making and losing over $100 million in leveraged trades, Wynn called the move a gamble but said he believes XRP could “revolutionize banking.”

His post underscores growing institutional and high-profile interest in XRP, signaling renewed momentum beyond Bitcoin-focused investors.

BNB Replaces Cardano in Grayscale CoinDesk Crypto 5 ETF

0

Grayscale has removed Cardano from its flagship CoinDesk Crypto 5 ETF (GDLC) and replaced it with BNB. 

The recent decision to remove ADA from the GDLC ETF has sparked discussion about the implications for the future of Cardano-focused ETFs. 

Key Points 

  • Grayscale has removed Cardano from its flagship CoinDesk Crypto 5 ETF and replaced it with BNB. 
  • The move follows Grayscale’s quarterly fund rebalance, which aligns the GDLC fund with the updated CoinDesk 5 Index. 
  • Grayscale has now sold its ADA holdings and reweighted the portfolio to add BNB. 
  • Despite the setback, ADA remains included in other basket funds such as BITW and NCIQ. 

BNB Replaces ADA in GDLC ETF 

Earlier this month, Grayscale completed its quarterly rebalance of the Grayscale CoinDesk Crypto 5 ETF, aligning the fund with the updated CoinDesk 5 Index. Following the review, CoinDesk Indices confirmed that Bitcoin, Ethereum, XRP, Solana, and BNB met the index’s inclusion criteria, according to an SEC Form 8-K filing. 

For context, CoinDesk Indices uses a strict, rules-based methodology to determine which assets are included in its indices. Specifically, it evaluates assets based on market cap, liquidity, and custodial support. At the moment, BNB ranks fourth globally among cryptocurrencies, while Cardano ranks 11th. 

Based on the latest update, Grayscale sold ADA and proportionally adjusted other holdings to add BNB to the portfolio. As a result, BNB officially replaced Cardano in the ETF.

Current GDLC ETF Components and Weightings 

After the rebalance, as of February 2, 2026, the fund held 74.21% Bitcoin, 13.34% Ethereum, 4.97% BNB, 4.68% XRP, and 2.80% Solana. Each share now provides fractional exposure to all five assets based on these updated weightings.

Grayscale GDLC ETF components

Implications for Cardano ETFs

Cardano’s removal has stunned many community members, prompting questions about its impact on future Cardano ETFs.

While ADA’s exclusion from GDLC does not rule out a dedicated Cardano ETF, it weakens the token’s near-term institutional narrative. ETF issuers typically favor assets with deep liquidity, sustained demand, and clearer regulatory pathways.

In the meantime, ADA remains included in other basket funds, such as the Bitwise 10 Crypto Index ETF (BITW) and the Hashdex Nasdaq Crypto Index US ETF (NCIQ). Meanwhile, Cardano continues to pursue a standalone spot ETF, with Grayscale’s application still under SEC review. 

XRP Adds 500,000+ Wallets Since Q4 2025 Despite 49% Price Drop

0

While the XRP price has declined by more than 49% since Q4 2025, XRP has welcomed over 500,000 more wallets within this timeframe.

Notably, the ongoing downturn has impacted the broader market, with the global crypto market cap losing $1.43 trillion since Q4 2025, and XRP has not escaped the bloodbath. For context, XRP has dropped 49% since October 2025, on par with Ethereum (-49%), but underperforming Bitcoin (-38%) and outperforming Solana (-56%).

Despite the bearish spell, the XRP ecosystem’s growth has not halted, as adoption continues amid a wave of new amendments. Specifically, since Q4 2025, the XRP ecosystem has added more than 500,000 wallets, pushing total hosted wallets beyond the 7.5 million mark. 

Key Points

  • XRP has suffered a 49% price downturn since Q4 2025, as the broader crypto market enters one of its most bearish phases, losing $1.43 trillion.
  • Despite the ongoing struggles, the XRP ecosystem has continued to grow, adding more than 500,000 wallets within the same period.
  • With the recent uptick, total hosted wallets in the XRP ecosystem have increased beyond the 7.5 million mark, less than six months after hitting the 7 million milestone.
  • While the growth has been undeniable, data confirms it has slowed mildly when compared to the adoption recorded in similar periods last year.

XRP Struggles Alongside the Broader Market

Data from a community-driven XRP Rich List platform confirms this trend, pointing to sustained adoption at a time when the price has struggled. Notably, XRP began Q4 2025 with a price of $2.84 in October after recovering by 2.55% the month before. However, after an initial rise to $3.1, the asset collapsed 11.89% in October 2025, with the downturn kick-started by the 10/10 market crash.

XRP Down 49 Since Q4 2025

Since then, XRP has been on a downward spiral alongside the rest of the crypto market, which has lost $1.43 trillion in value within this period. Currently trading for $1.44 amid a 49% decline, XRP has recorded four consecutive monthly losing candles for the first time since late 2019 and is now on track to make it five for the first time since 2016.

XRP Adds 500K+ Wallets

However, on-chain data confirms that the XRP ecosystem has continued to see growing adoption. Notably, while the price has struggled, the XRP Rich List reveals that the ecosystem has added exactly 526,446 XRP wallets since Q4 2025, when the ongoing downturn began.

For context, after XRP hit the 7 million-wallet milestone in September 2025, it added 50,000 more wallets in the days leading to Oct. 1, 2025, bringing total hosted wallets to 7,050,037. Since then, new accounts created on the ledger have ranged from 2,500 to 5,000 a day, with occasional spikes, per data from XRPScan. 

Three such spikes occurred on Oct. 30, 2025, when the network welcomed 9,900 XRP wallets in a day, on Nov. 2, 2025, when 11,242 new wallets entered the ecosystem, and on Nov. 11, 2025, when 13,300 new wallets were created, marking the largest daily increase in history. These all contributed to the current total XRP wallet count of 7,576,446, an addition of 524,446 wallets since October 2025.

XRP Wallets Cross 75M
XRP Wallets

Adoption Has Slowed Mildly

While the current trend confirms investors have maintained resilience at a time when prices have struggled, further data indicates that adoption has slowed compared to similar periods in the past. For context, from October 2024 to February 2025, XRP wallets grew from 5,330,427 to 6,105,025. This marked an increase of 774,598 wallets in less than five months.

The recent slowdown is expected, considering how periods of downturns often discourage new investors from entering the market in droves. However, XRP welcoming over 500,000 wallets during this time confirms that adoption has continued to grow despite the market struggles.

Shiba Inu Team Says SHIB Will Make a Come Back

0

Lucie, the marketing lead of the Shiba Inu ecosystem, struck an optimistic tone on SHIB’s future, insisting the token will eventually stage a comeback. 

As the broader crypto market continues to face sustained downturns, Lucie issued words of encouragement to investors. Her bold remarks drew mixed reactions from analysts, who questioned SHIB’s recovery prospects after a prolonged slump.

Key Points

  • Shiba Inu’s marketing lead, Lucie, reiterated that SHIB will eventually make a comeback despite ongoing market weakness.
  • Lucie argues that strong, community-driven projects like SHIB will survive and outperform weaker, influencer-backed tokens.
  • Lucie hinted that new opportunities to make money may emerge, teasing an upcoming update from developer Kaal Dhairya.
  • Despite consistent words of encouragement, Shiba Inu has continued to drop lower.

SHIB Will Make a Comeback

Shiba Inu fell to a multi-year low of $0.000006359 over the weekend amid persistent macro-driven bearish pressure. Despite this, Lucie reaffirmed confidence in SHIB’s long-term outlook, arguing that SHIB and other strong, community-driven projects will rebound and deliver significant gains. In contrast, she warned that weaker projects reliant on paid key opinion leaders (KOLs) will eventually fade.

She further expects more sustainable projects, especially those focused on artificial intelligence, to emerge, while predicting a renewed wave of interest in NFTs. This view aligns with lead developer Shytoshi Kusama’s ongoing push into AI initiatives to strengthen the broader Shiba Inu ecosystem, including SHIB, TREAT, BONE, and LEASH.

New Investment Opportunities May Emerge

Meanwhile, Lucie urged the community to stay alert for upcoming opportunities to make money. Although she did not specify whether these involve new ecosystem-related launches, integrations, or products, she hinted in a follow-up post that an update from top developer Kaal Dhairya is “brewing.”

Nonetheless, she cautioned investors to commit only spare funds and stressed that her comments should not be taken as financial advice.

Analyst Criticizes Lucie’s Assertion

Some community figures, including Zach Humphries, pushed back on Lucie’s comments, arguing they were overly optimistic while ignoring market pressures on SHIB, including the prolonged underperformance of altcoins since 2021.

While Humphries still sees recovery potential, he urged investors to stay realistic, diversify, and avoid relying solely on the team’s bullish projections.

Notably, during the ongoing downturn, Lucie has continued to issue public encouragement for SHIB holders. After Shiba Inu dropped to $0.00001270 in March 2025, erasing much of its post-election gains, she reaffirmed confidence in the project, noting that SHIB will succeed.

However, SHIB has continued to fall ever since, adding another zero and sliding to around $0.000006359, highlighting the gap between encouragement and market reality.

Bitcoin Loses Support Levels at the Halving AVWAP, the ATH AVWAP, and the SMA50

0

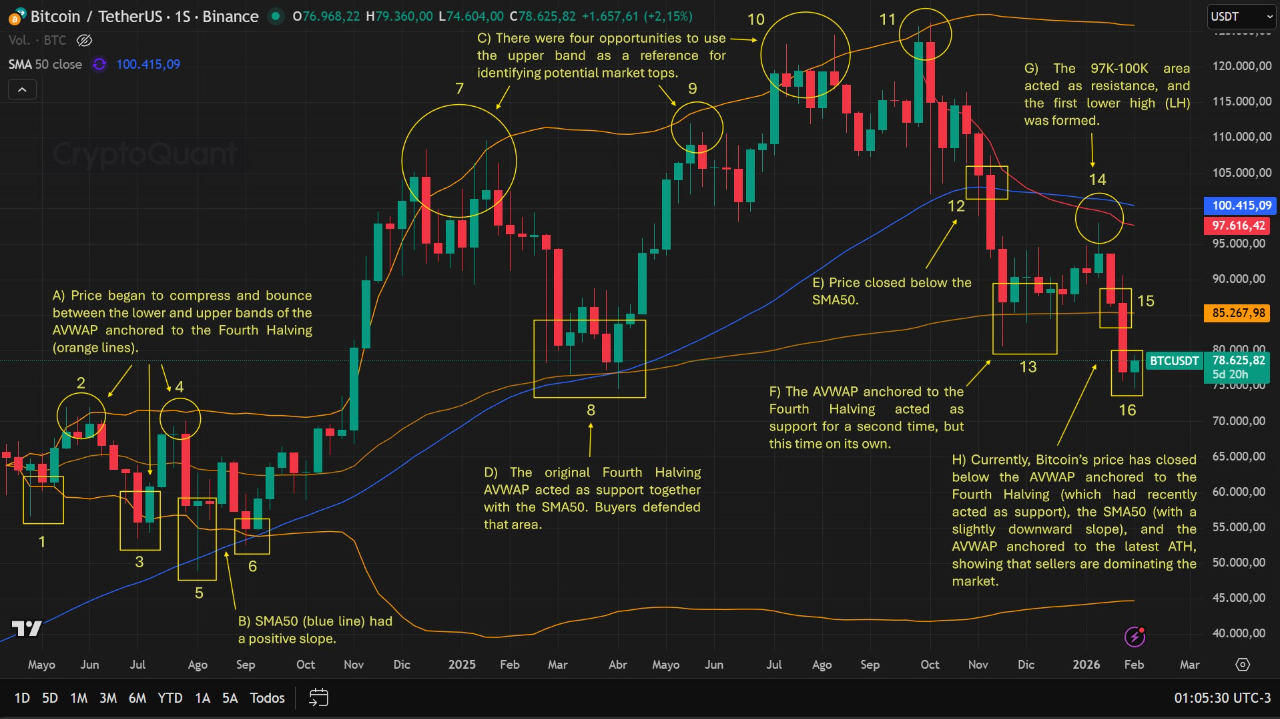
Amid the ongoing downturn, Bitcoin has dropped below three critical price markers: the halving AVWAP, the ATH AVWAP, and the SMA50.

Bitcoin has continued to weaken over the past several days, pushing its price down to $74,890. The latest level places the asset nearly 15% lower for the year so far, following a 6.3% decline recorded in 2025.

The ongoing downturn has now pushed the price below several major technical support levels, including the AVWAP anchored to the Fourth Halving, the AVWAP anchored to the latest all-time high, and the weekly SMA50. This confirms increasing bearish control.

Key Points

  • Bitcoin continuously interacted with three important price markers from 2024 to late 2025: the Fourth Halving AVWAP, the ATH AVWAP, and the weekly SMA50.
  • These price markers acted as support and resistance levels throughout 2025, guiding Bitcoin’s price action.
  • As Bitcoin crashes to the current price of $74,890, it currently trades below all three critical price markers, flipping them from support to resistance.
  • This confirms that sellers have taken full control of the market, with further downside risk emerging.

The Crucial Bitcoin Price Markers

This is according to a recent analysis from Onchain, a pseudonymous CryptoQuant analyst. During his commentary, Onchain called attention to the AVWAP anchored to the Fourth Halving, the AVWAP anchored to the most recent all-time high, and the 50-week simple moving average, all of which recently flipped from support into resistance.

Onchain explained that these tools worked together to track Bitcoin’s trend from mid-2024. Specifically, between May and August 2024, Bitcoin’s price compressed within the upper and lower bands of the Fourth Halving AVWAP while closing above the SMA50, which maintained a positive slope. 

During this period, Bitcoin climbed to peaks of $71,958 and $70,000 while holding above the $57,000 level, which acted as a strong structural support. 

Bitcoin 1W Chart Onchain
Bitcoin 1W Chart | Onchain

Bitcoin Rally Above $100K and the Formation of Repeated Market Tops

In September 2024, Bitcoin surged from $54,000 and continued climbing until it reached $108,000 by December 2024. As the price pushed upward, the AVWAP bands expanded and moved far from the average price zone.

Onchain noted that the upper band of the Fourth Halving AVWAP repeatedly marked major market tops. Bitcoin touched approximately $109,000 in January 2025, $112,000 in May 2025, $124,000 in August 2025, and eventually printed an all-time high of $126,000 in October 2025. 

Each of these levels aligned with the AVWAP’s upper boundary, representing market tops and resistance levels. During this period, the original Fourth Halving AVWAP and the SMA50 continued acting as a support zone during pullbacks.

Bitcoin Breaks Below All 3 Price Markers

Notably, when Bitcoin dropped from $109,000 in January 2025, buyers defended the AVWAP and SMA50 region as the price fell to $74,000 by April 2025. However, after the October 2025 all-time high at $126,000, the trend weakened further. In mid-November 2025, Bitcoin closed a weekly candle at $94,000, marking its first move below the SMA50.

The decline continued into late November and December 2025, when Bitcoin slipped into a range between $84,000 and $80,000, once again depending on the Fourth Halving AVWAP as temporary support.

A brief recovery emerged, but the $97,000 to $100,000 zone turned into resistance. Bitcoin also formed a lower high at $93,000, confirming weakening momentum. This resistance cluster contained several technical levels, including the UTXO Age Bands for six- to twelve-month holders, the SMA50, and the AVWAP anchored to the latest all-time high.

Now, with Bitcoin trading at $74,890, Onchain pointed out that the price has closed below the Fourth Halving AVWAP at $85,257, beneath the SMA50 at $100,415, which has started sloping downward, and under the ATH AVWAP at $97,616. This suggests sellers have taken control of the market.

Other Analysts Warn of Broader Market Weakness

Meanwhile, other analysts have warned of a broader Bitcoin market weakness. For instance, technical analyst Rekt Capital highlighted that Bitcoin recently produced a bearish monthly close below the base of a long-term Macro Triangle pattern. According to him, the market now stands on the edge of a full structural breakdown that could trigger a bearish decline phase of the cycle.

Bitcoin 1M Chart Rekt Capital
Bitcoin 1M Chart | Rekt Capital

Another analyst, Aralaz, warned that Bitcoin may be preparing for a sharp decline toward the $32,000 region. He compared previous cycle peaks and crashes, noting the 2017 high near $19,000 followed by an 84.1% collapse in 2018, the 2021 peak at $69,000 followed by a 77.4% drop in 2022, and the 2025 peak at $126,000, which he believes could lead to a potential 72.2% downturn into 2026.

Binance FUD Resurfaces, but On-Chain Data Tells a Different Story

0

Fresh concerns around the solvency of the Binance exchange have resurfaced on social media this week.

However, on-chain data suggests the exchange is not showing the distress signs typically seen before major crypto collapses.

Crypto analyst Axel Bitblaze addressed the renewed fear, uncertainty, and doubt (FUD) in a detailed post on X. He pointed to reserve data, withdrawal velocity, and historical comparisons with failed platforms like FTX and Celsius.

Key Points

  • Binance FUD resurfaces, but on-chain data shows no major liquidity stress.

  • Current reserves of 659K BTC remain stable, with no mass withdrawals observed.

  • Reserve movement sits at just 0.6%, far below past collapse levels like FTX or Celsius.

  • Analysts stress verifying data on-chain and practicing self-custody: “Not your keys, not coins.”

Bitcoin Reserves Remain Stable

According to Bitblaze, Binance currently holds approximately 659,000 BTC in reserves. Crucially, that figure has remained stable for weeks, with no sharp drawdowns or sudden reserve drops. “There’s no sign of a mass exodus,” the analyst noted.

In other words, reserve balances are consistent with normal exchange operations rather than panic-driven withdrawals.

Notably, Binance’s latest proof of reserve report for January 2026 shows it holds 636,535 BTC in net balances.

Binance Proof of Reserves

Withdrawal Velocity Shows No Stress

Meanwhile, another key metric is reserve movement, which tracks how quickly assets are leaving an exchange. Citing CryptoQuant data, the analyst observed that Binance has shown only 0.6% movement as of today.

Meanwhile, FTX, before its collapse, exhibited a massive 12% decline in its holdings. Similarly, Celsius saw 80% of reserves drained before withdrawals froze.

At 0.6%, Binance’s reserve movement sits at what Bitblaze described as “noise level,” far below thresholds historically associated with liquidity crises or bank runs.

Netflows Appear Normal

Furthermore, daily netflows, the balance between deposits and withdrawals, also remain within normal ranges. Bitblaze said that Binance’s current activity looks similar to any routine trading day, with no abnormal spikes or sustained outflows.

“There are no bank-run signals,” he said, contrasting the data with patterns seen during past exchange failures.

How This Compares to Past Collapses

Bitblaze drew direct comparisons to previous high-profile failures to illustrate what genuine exchange distress looks like on-chain.

FTX (November 2022):

  • Over $6 billion withdrawn within 72 hours
  • Reserve movement reached -12%
  • Withdrawals were eventually halted

Celsius (June 2022):

  • Reserves fell from $20 billion to $4 billion
  • Withdrawal freeze announced
  • Bankruptcy followed weeks later

Binance (Current):

  • 659,000 BTC in reserves
  • 0.6% reserve movement
  • Withdrawals processing normally

The analyst stressed that when exchanges are truly in trouble, the warning signs appear in on-chain data days before any public announcement.

“The Chain Shows It First”

Bitblaze stressed that blockchain transparency makes it difficult to hide liquidity issues at scale. When exchanges face serious trouble, such as massive outflows, reserve drains, and processing delays, these issues become visible on-chain. Accordingly, he noted that if Binance were in trouble, “the chain would show it.”

He also encouraged users to independently verify the data using public analytics platforms such as CryptoQuant, Glassnode, and Nansen.

While defending Binance against what he described as unfounded panic, Bitblaze still stressed the importance of self-custody. “Not your keys, not your coins,” he said, calling self-custody a best practice regardless of market conditions.

Essentially, based on current on-chain indicators, Binance is not showing the liquidity-stress signals that preceded past exchange collapses.