Home Blog Page 307

Bitcoin Analysis for Jan 21: BTC Defends Key Support as Analyst Sites Temporary De-Risking

0

Bitcoin defends key support amid short-term volatility, with an analyst indicating that recent pullbacks are a result of temporary de-risking.

Bitcoin (BTC) is currently trading just above $89,000, experiencing a notable 5% drop in the past 24 hours. The daily chart shows significant volatility with BTC moving in a range between $87,901 and $92,258 during the day.

The recent decline is attributable to geopolitical risks and a bond market selloff, which have contributed to investor caution across various asset classes, including cryptos. As a result, BTC has faced some downward pressure, and despite a brief recovery from the low, it is still holding below the $90,000 psychological mark.

Bitcoin has decreased 6.6% over the past 7 days, signaling ongoing challenges in the market despite strong fundamentals. However, the crypto firstborn has remained resilient in the longer term, up 0.7% over the past 30 days.

Traders will be keeping an eye on the $89,000 to $90,000 range for signs of support and whether Bitcoin can regain momentum. Where next for Bitcoin?


What’s Next for BTC?

Notably, CryptosRus, an analyst on X, recently analyzed the Bitcoin pullbacks between 2025 and 2026, emphasizing that these price drops align with macro-level shocks related to tariffs and trade tensions. The key examples cited by CryptosRus include the April 2025 drop, where sweeping tariffs triggered a 12% decrease in Bitcoin’s price.

Bitcoin Exchange Netflow

Similarly, in October 2025, the escalation of the U.S.–China trade conflict caused another significant pullback, with Bitcoin dropping around 8%. Lastly, the January 2026 decline occurred amid rising trade risks between the U.S. and Europe, leading to a 7% drop in Bitcoin’s price. 

These occurrences highlight Bitcoin’s sensitivity to broader economic policies. They position it as a macro-sensitive risk asset impacted by changes in growth expectations, interest rates, and liquidity.

However, despite these price movements, CryptosRus points out an important detail: exchange netflows have not shown sustained dumping during these sell-offs. While there were temporary bursts of inflows during market drops, these were short-lived, indicating that the market quickly absorbed the selling pressure. 

CryptosRus suggests that this behavior reflects temporary de-risking by market participants rather than a structural breakdown in demand for Bitcoin. If exchange inflows were to remain consistently high, this would signal a more significant shift in market sentiment. For now, the volatility appears to be driven by macro-level policy shocks, rather than an indication of the end of the Bitcoin cycle. 

Bitcoin Technical Analysis

Looking at TradingView, price action has been testing the Bollinger Bands, with the price recently approaching the lower band around $87,645 and subsequently bouncing before touching it. The Relative Strength Index is currently at 43.07, indicating that Bitcoin is now moving towards neutral territory. 

Bitcoin 1-Day Chart
Bitcoin 1-Day Chart

If the price manages to hold above the support found at $87,800 and break through the middle band near $92,367, it could be a signal for renewed buying pressure. Conversely, if Bitcoin fails to maintain its support at these levels, the downside risk remains, potentially testing the $87,645 and lower levels.

As the price moves above the middle band, it would indicate that buying momentum is gaining strength, potentially pushing the price toward the upper Bollinger Band near $97,081.

XRP ETFs Record Largest Daily Outflow in History

The XRP ETFs recently recorded their largest daily outflow figure in history after the markets returned from the Monday hiatus.

According to market data, the XRP-linked ETF products witnessed over $53 million worth of outflows on Tuesday, Jan. 20, representing their second-ever daily capital outflow and the largest outflow figure since they began trading in November 2025.

However, the recent underwhelming performance was not specific to XRP funds. Rather, it reflected a broader downturn in sentiment across U.S. markets, driven largely by renewed concerns following President Donald Trump’s tariff threats targeting Europe and Greenland. 

With U.S. markets closed on Monday in observance of Martin Luther King Jr. Day, the market postponed its reaction to these developments, ultimately unfolding on Tuesday.

Key Points

  • XRP ETFs recorded more than $53 million worth of outflows on Tuesday, Jan. 20.
  • This marked the products’ second-ever daily outflow and the largest since they began trading in November 2025.
  • Cumulative total net inflows have dropped to $1.22 billion, representing levels from Jan. 9.
  • Bitcoin and Ethereum ETFs saw larger outflows, with only Solana and Chainlink products bucking the trend.
  • The latest performance was largely due to President Trump’s tariff threats, which led to an adverse reaction across U.S. markets.

XRP ETFs Record Largest Daily Outflow 

According to market data provided by Sosovalue, the XRP ETFs saw exactly $53.32 million in capital outflows on Jan. 20, marking their largest daily outflow ever. This comes after the products recorded seven consecutive days of inflows from Jan. 8 to 16, pulling in around $70.48 million within this period.

XRP ETFs Largest Outflow in History Sosovalue
XRP ETFs Largest Outflow in History | Sosovalue

With the latest performance, the XRP ETFs now boast a cumulative inflow figure of $1.22 billion, representing levels last seen on Jan. 9. The $53 million outflow came solely from the Grayscale XRP ETF (GXRP), which lost $55.39 million worth of capital on Tuesday. In contrast, Franklin’s XRPZ saw $2.07 million in inflows, reducing the overall outflow figure. Other products saw no flows.

How Other Crypto ETFs Performed

The recent bearish spell was not unique to XRP, as most other crypto ETFs also saw outflows. Specifically, the Bitcoin ETFs recorded $426.52 million worth of outflows on Jan. 20, building on a previous outflow figure of $394 million on Jan. 16. These outflows began after four consecutive days of inflows from Jan. 12 to 15.

Meanwhile, Ethereum ETFs witnessed $229.95 million in capital outflows on Jan. 20, ending a five-day inflow streak that also began on Jan. 12. Only Solana ETFs (+$3.08 million) and Chainlink ETFs (+$4.05 million) recorded inflows on Jan. 20, as they bucked the overall bearish trend.

What Triggered These Outflows?

Further, the bearish trend cut across the entire U.S. market, as investors reacted adversely to President Donald Trump’s latest tariff threats against Europe and Greenland, which led to trade tensions between Europe and the United States.

According to Reuters, after the market closed on Monday in observance of Martin Luther King Jr. Day, Tuesday was the closest opportunity for investors to act on their risk aversion. Specifically, data confirms that the U.S. market witnessed its largest intraday decline since October 2025.

Traders Turn Bullish In GeeFi (GEE) After Announcing New Bonus System, Leaving Phase 3 With Only 3M Tokens

0

GeeFi is taking the lead in the decentralised evolution with recent announcements of critical updates to its ecosystem, which boosted its presale momentum. With $GEE token presale now more than $2.6 million in funds raised, the project is well on its way to ending Phase 3. This spike in interest is in direct correlation to the announcement of major updates to its wallet, security improvements and its road map of future financial features.

Wallet Update Integrates Access To Pre Sale

The first and most immediate change for the users, is the direct integration of the $GEE token presale in the GeeFi wallet app. Now, the process is entirely contained into the app, enabling users to buy tokens with AVAX or USDT or via standard bank cards. With this update, the entry point for new investors becomes far easier. With only 3 million tokens left in the current phase, this accessibility update comes at exactly the right time for those trying to get in before the price jump from the current $0.10 mark.

Investment Potential and Outlook of the Market

The numbers behind the GeeFi presale are a clear opportunity for early investors. Currently, the $GEE token is as low as $0.10. Its listing price will be $0.40, giving early participants a potential 300% ROI immediately at public launch. However, market experts have even longer-term prospects, with predictions of $3 or more as the ecosystem continues to develop. An initial investment of $1,500 at the current price could potentially experience a growth to $45,000, an impressive return of 2900%.

Financial Roadmap: DEX and Cryptocards

The success of the presale is helping the GeeFi team fast-track development of powerful new features that aim to create an all-in-one financial tool. High on the priority list is a native Decentralized Exchange (DEX) and integrated Cryptocards. The DEX will enable secure and efficient asset swapping directly within the GeeFi wallet, negating the requirement for third party platforms. The Cryptocards will bridge the gap between digital currency and real-world commerce, giving its users a tangible way to easily use their digital currency. These add-ons are intended to make GeeFi a valuable addition to a user’s digital life.

Maximizing Returns- Staking and Referrals

To encourage long-term holding and community growth, GeeFi has introduced reward systems. The platform has a staking feature enabling token holders to create passive income from their holdings, which will deter quick selling of the tokens and help stabilize the economy. Additionally, the project includes a 5% referral commission on purchases made on unique user links. Combined with an upcoming bonus system for early participants, these mechanisms provide multiple ways for investors to maximize their holdings.

Improved Privacy and Security Protocols

While utility is a major focus, the GeeFi team has improved safety of its community. The latest update in the application features is seen as a robust improvement to the privacy and security protocols. By strengthening the security of the wallet, GeeFi is showing dedication to sustainable reliability. This focus on security is a fundamental requirement for any platform that is looking to deal with financial transactions and personal data, and that provides peace of mind to the growing community of holders.

Conclusion

GeeFi is standing out from the crowd thanks to steady product updates, as well as its clarity regarding utility and security. A combination of an easily accessible wallet, strong security mechanisms and effective financial ecosystem has clearly impressed investors, as the time to be able to participate at the current entry price is closing quickly.

Learn More

Website

Buy $GEE Token

Download App

Disclaimer: This Press release article is provided by the Client. The Client is solely responsible for this page’s content, quality, accuracy, products, advertising, or other materials. Readers should conduct their own research before taking any actions related to the material available on this page. The Crypto Basic is not responsible for the accuracy of info and any damage or loss caused or alleged to be caused by the use of or reliance on any content, goods, or services mentioned in this press release article.

Please note that The Crypto Basic does not endorse or support any content or product on this page. We strongly advise readers to conduct their own research before acting on any information presented here and assume full responsibility for their decisions. This article should not be considered investment advice.

Bitcoin Targets $200K by Year-End but Could Struggle Short-Term: Jack Mallers

0

Twenty One Capital CEO Jack Mallers says Bitcoin could hit new all-time highs before the end of 2026, but might see lower prices in the short term.

Mallers explicitly projected a rally to between $150,000 and $200,000, surpassing its October 2025 peak price of $126,200. Despite his bullish stance, however, he sees BTC chopping further downward in the near term before this move.

Key Point

  • Twenty One Capital CEO Jack Mallers says Bitcoin could hit between $150,000 and $200,000 before the end of 2026, but might see lower prices in the short term.
  • Mallers noted that Bitcoin would struggle again if the tariff fracas persists, calling it the only freely traded market globally and, as such, a true reflection of market sentiment.
  • Despite these short-term impediments, Mallers believes Bitcoin would perform exceptionally in the longer term, as the market catches up with narratives.
  • Other prominent industry figures also share a similar outlook on Bitcoin’s price.

Macros to Hamper Short-Term Bitcoin Growth

During the Monday episode of “The Jack Mallers Show” on YouTube, Mallers was asked whether the Donald Trump tariff ruling would affect Bitcoin.

For the uninitiated, the US president renewed his tariff brandishing with a new levy hike on eight new European countries, effective February 1. However, the Supreme Court could rule on Trump’s use of tariffs as early as today, creating tension in the markets.

In response, Mallers noted that Bitcoin would struggle again if the tariff fracas persists. He believes this is so because the BTC market is the only freely traded market globally and, as such, a true reflection of market sentiment.

He went on to highlight his earlier comments that Bitcoin lacks sufficient “follow-through strength” to withstand macroeconomic developments. As a result, it is one announcement away from intense volatility, mainly targeting leveraged market participants.

Bitcoin Will Reach New Highs in the Longer Term

Despite these short-term impediments, Mallers believes Bitcoin would perform exceptionally in the longer term. He highlighted that while the narratives currently front-run the market, the latter would catch up with time.

For perspective, he noted that there would be a lot of money printing, which would cause inflation and favor safe-haven assets like Bitcoin. Again, he mentioned that the Federal Reserve would cut rates, increasing fiat circulation and hence, investor risk appetite.

However, none of this is happening at the moment. Nonetheless, one cannot rule out the possibility. Citing these instances, Mallers predicted that BTC would hit between $150,000 and $200,000 before the end of this year.

“But we might dip a little before we go higher,” he reiterated.

Growing Conviction Bitcoin Will Reach $150K-$200K

Interestingly, other prominent industry figures also share a similar outlook on Bitcoin’s price. For context, Binance co-founder Changpeng “CZ” Zhao predicted that the crypto leader would reach $200,000, calling it the most “obvious thing in the world.”

Furthermore, Standard Chartered expects Bitcoin to reach $150,000 by the end of 2026. Haseeb Qureshi, the managing partner at Dragonfly, also predicts that BTC will surpass the $150,000 mark this year.

Peter Brandt Confirms Bitcoin Has Now Become a Diagonal Pattern: What Next?

Peter Brandt recently confirmed that Bitcoin has moved into a diagonal pattern, a structure he prefers to stay away from. 

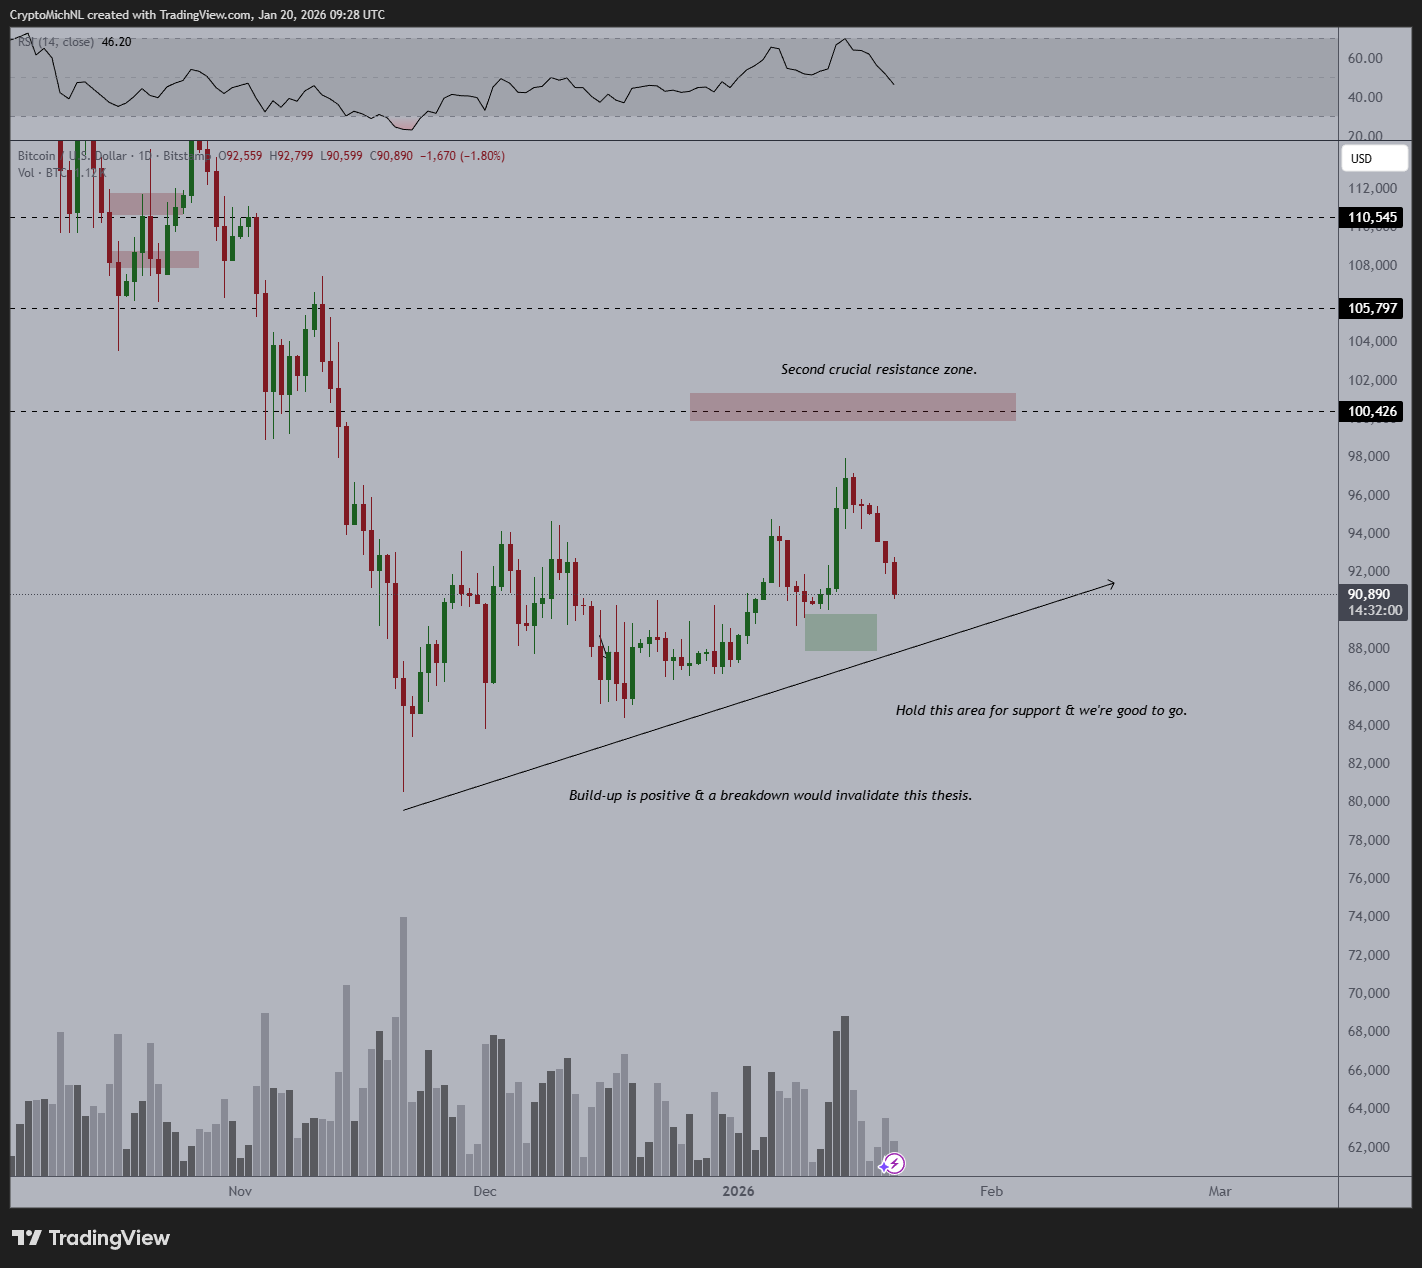
His comment comes as Bitcoin shows weaker price action. Data from his chart reveals BTC changing hands at $91,070 after losing $1,526 on the day. This decline follows several weeks of uneven movement that started in November 2025.

Around that time, Bitcoin set a major low at $81,014. Notably, this level acts as the anchor of the entire structure on the chart. From this low, the price rebounded but failed to form a strong uptrend. Instead, BTC moved within two rising trendlines that slowly narrowed, forming the diagonal pattern.

Key Points

  • Bitcoin trades near $91,070 following weeks of choppy movement that started after the $81,014 low in November 2025.
  • Price has formed a rising diagonal pattern, with support climbing from $81,014 and resistance building between $99,000 and $100,000.
  • Multiple rallies into the high $90,000s failed, pushing Bitcoin below the 8-day and 18-day moving averages and strengthening short-term bearish pressure.
  • Peter Brandt sees potential downside toward the $58,000–$62,000 range but stresses flexibility if price moves differently.

Bitcoin Enters Diagonal Pattern

This diagonal began shortly after the November 2025 low of $81,000 and has dictated the price action ever since. The lower trendline connects higher lows from $81,014 through late December and into January, rising toward the upper $89,000 area. 

Meanwhile, the upper trendline formed in late November 2025 around $94,000 to $95,000 and now extends toward the $99,000 to $100,000 range. Bitcoin has tested this resistance several times, including a push into $97,900 on Jan. 14, 2026, but sellers stopped every attempt.

Bitcoin 1D Chart Peter Brandt
Bitcoin 1D Chart | Peter Brandt

Each rejection at the top of the diagonal pushed the price lower. Specifically, the most recent pullback has dragged Bitcoin back to the current price of around $91,000, which is below both the 8-day and 18-day moving averages. These short-term averages have turned lower, confirming growing downside pressure in the near term.

What Are the Different Possibilities for Bitcoin?

Looking ahead, Bitcoin’s next direction depends on how the price reacts at the edges of the diagonal pattern. As long as BTC continues to trade within the rising channel that formed after the $81,014 low, its price action is likely to remain choppy and directionless. The market needs a clear break to resolve the structure.

On the upside, Bitcoin must reclaim and hold above the upper diagonal resistance, which currently sits between $99,000 and $100,000. A strong daily close above that area, followed by follow-through, would invalidate the diagonal and suggest renewed bullish momentum.

Conversely, a decisive daily close below the rising support line in the high-$80,000 region would indicate a breakdown of the diagonal. Such a move would shift momentum firmly bearish and expose lower levels, with the December low near $81,014 coming back into focus. 

Meanwhile, earlier in the day, Brandt also shared a downside view on Bitcoin. He said he sees the price moving toward the $58,000 to $62,000 range. However, the market veteran admitted that he may be wrong.

What Other Analysts Expect

Notably, other analysts remain split on Bitcoin’s next direction. For one, Michaël van de Poppe called attention to the asset’s short-term weakness, noting that Bitcoin briefly tested $96,000 and saw a quick rejection.

Bitcoin 1D Chart Michael van de Poppe
Bitcoin 1D Chart | Michael van de Poppe

He said this rejection triggered a wider market drop and pushed many altcoins to new cycle lows. To him, Bitcoin needs to form a clear higher low and reclaim the 21-day moving average to regain upside momentum. He also warned that holding the 50-day moving average is important to avoid deeper losses.

However, Crypto King believes Bitcoin remains in an uptrend on the weekly chart and has tested the same rising support line three times without breaking it. He noted the recent bounce near $93,000 as evidence that buyers continue to step in. As long as Bitcoin stays above that trendline, he believes the broader trend remains bullish.

Flare CEO Says Viral Ripple Insider WhatsApp Chat is “Clearly Nonsense”:

0

As the crypto market attempted to recover from a recent downturn, investor attention shifted to a viral screenshot that allegedly captured a conversation between two Ripple insiders. 

The image, presented as a WhatsApp screenshot, shows unnamed participants claiming insider knowledge of Ripple and the Flare ecosystem. In particular, the messages allege that Ripple insiders are quietly accumulating FLR, seeking strategic control over Flare, and deliberately suppressing FLR’s price to gain leverage.

Meanwhile, Flare CEO Hugo Philion has debunked the WhatsApp conversation, describing the screenshot as “clearly nonsense.”

Key Points

  • Hugo Philion publicly dismissed the viral WhatsApp conversation alleging insider manipulation as “nonsense.”

  • The claims lack verifiable identities, evidence, or supporting documentation.

  • Several community members have echoed Philion’s assessment.

  • Flare positions itself as a core DeFi layer for XRP, with FXRP adoption exceeding 89 million tokens.

Just Some “Wild Conspiracies”

As the screenshot continued to trend, Philion reacted swiftly to dismiss the claims. He stressed that the screenshot is “clearly nonsense” and among “wild conspiracies” circulating in the crypto community.

Similarly, several commentators have dismissed the WhatsApp conversation, with some suggesting it was staged to generate engagement.

The viral WhatsApp conversation

Flare’s Prominence in the XRP Community

Launched in 2022, Flare has steadily gained traction across the broader crypto ecosystem. Developers built the network to extend smart contract functionality and decentralized finance capabilities to assets such as XRP, which lack native programmability.

Although Flare has grown particularly prominent within the XRP community, largely due to its FAsset initiative, the network operates independently and is not controlled by Ripple.

Meanwhile, Flare is positioning itself as a core DeFi layer for XRP. Its wrapped asset FXRP, minted by locking XRP in Flare’s vaults, has reached a circulating supply of 89.03 million tokens, valued at approximately $170.98 million at current prices.

Philion has emphasized that retail participants have driven this growth, noting that institutional players have yet to enter. Given FXRP’s expanding adoption, he added that the asset is gradually evolving from a simple digital token into a yield-bearing financial instrument.

Bitcoin Wallet Dormant Since 2013 Awakens With 13,900x Gains

0

A Bitcoin wallet dating back to the network’s earliest years has become active after more than a decade of inactivity, transferring its entire balance to a new address.

On-chain analysis by Arkham Intelligence shows the wallet first received Bitcoin in 2013, when the asset was still in its early adoption phase and priced around $7. For more than 13 years, the address remained untouched.

This week, the wallet transferred its full balance of 909.38 BTC, roughly $84.6 million, to a newly created Bitcoin address. Despite the size of the transaction, the destination does not appear linked to any known exchange.

Key Points

  • 909.38 BTC transferred from a wallet inactive since 2013
  • The total value of the transfer is about $84.6 million at current prices
  • Original value in 2013 was around $6,400, with Bitcoin priced below $7
  • Bitcoin price at press time is about $90,970, down 27.9% from its 2025 high

Snapshot of Bitcoin’s Long-Term Growth

The wallet’s history also highlights Bitcoin’s extraordinary long-term price trajectory. Its original holdings, worth about $6,400 in 2013, have appreciated dramatically over 13 years.

By comparison, a similar investment in a low-cost S&P 500 index fund would now be valued at roughly $37,000, representing a 481% gain. Meanwhile, gold, as a traditional store of value, rose about 150% over the same period. Overall, Bitcoin’s growth, which has increased roughly 13,900-fold, underscores its remarkable scale.

Early Holders Reemerge During Market Milestones

This reactivated wallet is part of a broader pattern. Dormant addresses often reappear following major market milestones, such as Bitcoin’s rally past $100,000 last year.

One notable example occurred in July 2025, when an early investor sold over 80,000 BTC via Galaxy Digital, an institutional crypto firm. The holder had retained the coins for 14 years and reportedly realized about $9 billion in profits. Such transactions reinforce the trend of early adopters returning during key market shifts.

Market Volatility Frames the Timing

Meanwhile, these movements are unfolding amid heightened price volatility. Bitcoin set a record above $126,000 in early October 2025, but then reversed course.

At press time, the asset trades near $90,970, down more than 27.9% from its peak. The drop followed renewed tariff tensions between the United States and Europe.

Specifically, those tensions follow remarks by President Donald Trump about Greenland, which in turn pushed investors toward traditional safe-haven assets, triggering a broader crypto sell-off.

Nevertheless, some analysts argue market dynamics are evolving, leaving room for further gains in 2026 despite recent corrections.

Cardano Forecast for Jan 20: ADA Tests Lower Range Even as Bullish Commentary Surges: Where Next?

0

Cardano faces selling pressure, testing lower levels, while social sentiment turns bullish. Where’s ADA headed?

Looking at the charts, Cardano (ADA) is changing hands around $0.3589, down about 2.8% over the past 24 hours, as selling pressure intensified during the latest session. The intraday chart shows ADA trading within a daily range between roughly $0.3586 and $0.372, with price holding relatively stable earlier before a sharp late-session drop pushed it toward the lower end of the range.

From a broader perspective, ADA’s recent performance shows sustained weakness across multiple time frames. The token is down 8.6% over the past seven days and 13.5% over the last 14 days, indicating persistent downside pressure rather than a brief pullback. While the 30-day decline of 2.4% is less severe, the structure still reflects a market struggling to regain upside momentum.

Traders are watching closely for signs of either stabilization or further continuation to the downside.

Where’s ADA Headed?

From a technical perspective, ADA is trading within the Ichimoku Cloud, with the price sitting just below the conversion line at $0.3859, acting as a dynamic resistance. The baseline is also positioned near $0.3837, further emphasizing a bearish short-term outlook as ADA remains below both key moving averages.

Cardano Technical Analysis

The price is also moving downwards, further away from the lower boundary of the Cloud, which typically signals increased selling pressure. As the market tests lower levels, there is a risk of further downside if the price fails to break into the cloud, with its base at $0.3848.

Meanwhile, the Relative Strength Index is hovering around 39.74, which is below the neutral 50 level, indicating that ADA is in slightly bearish territory. The RSI’s downward momentum could suggest further weakness in the short term, but if it begins to trend upward, it could signal potential buying interest.

Traders must watch for any sign of strength above the $0.3848 level or a recovery back into the Ichimoku Cloud, which could signal a shift in momentum. Until then, ADA is at risk of continued pressure.

Cardano’s Social Discussion Turns Decisively Bullish

Elsewhere, Cardano has recorded a sharp shift in market sentiment, according to new data from Santiment shared by TapTools. The data shows social media discussion around ADA turning decisively bullish.

Cardano Bullish vs Bearish Commentary

The update indicates that positive commentary has surged to more than 27 bullish comments for every single bearish one, highlighting a strong imbalance in favor of optimism. The sentiment spike follows heightened attention around Cardano founder Charles Hoskinson.

‘Structure Over Noise’: Why XRP Daily Chart Still Looks Strong

0

XRP continues to trade within a well-defined range on the daily timeframe, and one analyst says the overall structure matters more than short-term price moves.

The chart shows XRP respecting key levels and remaining within its range, rather than breaking down suddenly.

Key Points

  • XRP trades within a clear daily range, showing structure matters more than short-term noise.
  • Strong buyer support holds firm at $1.82–$1.90 despite repeated downside tests.
  • Price compression below moving averages suggests a larger move may be building.
  • Analysts say XRP could shift into a new uptrend as early as next week.

XRP Respects a Clear Daily Range

Notably, this analysis came from EGRAG, a well-known XRP bull who took to X to share a chart and ask, “What do you see?”

He stressed that traders should focus on structure, not market noise. The most important zones include:

  • Strong support around $1.82–$1.90
  • A mid-range level near $2.24
  • Upper resistance between $2.75 and $2.80

Despite several attempts to move lower, XRP has held above its base support, suggesting stability rather than weakness.

XRP chart by EGRAG
XRP chart by EGRAG

Buyers Continue to Defend the Same Support Zone

One of the key takeaways from EGRAG’s chart is the repeated reaction from the same support area. XRP has formed multiple rounded bottoms near the $1.82–$1.90 zone, indicating that buyers are consistently stepping in at these levels.

Meanwhile, the chart shows XRP is still trading below its daily moving averages, which are acting as resistance. However, the gap between price and these averages is shrinking, signaling increasing compression.

This type of setup often precedes a larger move, especially when the price continues to hold above key support.

Fibonacci Levels

Key Fibonacci retracement levels align closely with XRP’s current trading range:

  • The 0.0 level near $1.82 continues to act as a strong floor
  • The 0.5 level around $2.24, defines the middle of the range and immediate resistance
  • The 1.0 level near $1.96 serves as a short-term pivot area

“Structure > Noise”

EGRAG’s point is that traders should not get distracted by short-term volatility or false moves. As long as XRP holds key support and remains within its range, the overall setup stays intact.

Rather than reacting to every daily candle, the focus should be on how the price behaves around important levels. Notably, this analysis comes as XRP’s price has dipped 6% over the past seven days to $1.92.

XRP Nightmare vs. Conviction Scenario

In an earlier post, EGRAG outlined a worst-case, or “nightmare,” scenario for XRP if market weakness persists. He said further pullbacks of 31% to 47% could occur before the uptrend resumes.

Even so, the analyst noted that his long-term bullish outlook on XRP remains unchanged. He expects double-digit XRP prices in the mid-term.

Breakout Next Week

Separately, a CryptoQuant-verified analyst, CW, says XRP has already broken out of a multi-year consolidation pattern. With selling pressure easing and price holding above the breakout level, CW argues that XRP is transitioning from consolidation into a new upward trend as early as next week.

Other analysts add that XRP breakouts are often sudden and unpredictable, typically rewarding traders who position early.

Can Shiba Inu Revisit Its March 2024 High of $0.00004534 From $0.000008?

0

As 2026 begins, traders are questioning whether Shiba Inu can erase a zero from its price and potentially reclaim its 2024 high. 

In early 2024, SHIB surged from roughly $0.000008 to $0.000045, a 462% gain fueled by renewed meme-coin speculation and a broader crypto market recovery. Currently, market participants wonder if similar conditions could spark another major rally.

Key Points

  • Shiba Inu delivered a 462% gain in 2024, soaring from around $0.000008 to $0.00004534.
  • SHIB currently trades near $0.000008, roughly the same level as January 2024, just before its explosive rally.
  • Potential catalysts for an upsurge include massive SHIB withdrawal from exchanges and expectations of a broader market rally.
  • Concerns about internal ecosystem issues remain key obstacles to a sustained SHIB rally.

Shiba Inu Impressive Performance in March 2026 and Current Status

Despite bullish expectations for 2025, Shiba Inu ended the year significantly lower, dropping 67.35% from $0.00002115 on January 1 to $0.000006904 by December 31. This contrasts with 2024, when the token reached a multi-year high of $0.00004534 on March 5. It recorded another rally in December 2024, when it climbed to $0.00003329.

Currently, Shiba Inu trades around $0.000008—the same level as January 2024, just before its remarkable rally to $0.000045 in March. So far, the token has soared 14.1% year-to-date, with each token currently worth $0.000007905. Hitting the $0.00004534 target from the current level would require a considerable price surge.

Can SHIB Reclaim $0.00004534 by March 2026?

While it remains uncertain whether Shiba Inu will reach its March 2024 high, several prediction platforms have projected potential upside in the coming months.

Crypto trading platform Changelly anticipates SHIB climbing to a maximum of $0.00000990 by March 2026. This target is still 78.16% below the $0.00004534 peak recorded in March 2024.

Shiba Inu Price Prediction for March 2026 Telegaon

Similarly, Coincodex set a conservative target of $0.000009598, marking a 21.41% gain from the current price, yet 78.83% below Shiba Inu’s 2024 high.

Shiba Inu prediction for March 2026 Coincodex

In contrast, Telegaon offered a more optimistic projection, suggesting SHIB could surge to $0.0000543 in 2026, surpassing the March 2024 peak. However, Telegaon did not provide a monthly timeline, implying it expects SHIB to reach this level at any point during the year.

Shiba Inu Price Prediction for March 2026 Telegaon
Shiba Inu Price Prediction for March 2026 | Telegaon

Potential Factors for a SHIB Rally

In the meantime, Shiba Inu has risen over 14% this year, fueling optimism for further gains. Bullish projections from institutions like Grayscale suggest Bitcoin is shifting from a 4-year to a 5-year cycle, a move that could trigger a major bull run and possibly lift the prices of SHIB and other tokens.

Additionally, investors have been reducing SHIB supply on exchanges by withdrawing tokens into on-chain wallets. The Crypto Basic reported that roughly 361 billion SHIB tokens were removed yesterday, reducing selling pressure on the asset.

Meanwhile, speculation about a standalone U.S. spot ETF for Shiba Inu is growing, as T. Rowe Price named SHIB in its ETP basket. Interestingly, Grayscale highlighted the token as being eligible for approval under the SEC’s GLS framework.

Despite these potential catalysts for an upsurge, a rally is not guaranteed. SHIB faces key ecosystem challenges, including the team’s evasive behavior and continued focus on other tokens, which could impact market momentum.