Home Blog Page 308

XRP Market Structure Shows Familiar Patterns That Many Investors Ignore

0

XRP appears to be repeating a bullish rectangular structure on the 1-month chart, which preceded a 617% price spike in 2017.

The current rectangular structure started taking shape in December 2024, right after the November 2024 breakout that allowed XRP to rally from the $0.5 range to $2. After soaring to a peak of $3.4 by January 2025, XRP faced resistance at this level, witnessing a pullback. However, it held strong, consolidating within a range between $1.6 and $3 throughout 2025.

XRP has maintained this range into the new year, 2026, leading to the formation of a multi-month bullish rectangular structure on the monthly chart. Interestingly, data from the monthly chart indicates that XRP traded within a similar multi-month rectangular structure before it surged 617% in 2017.

Key Points

  • XRP currently trades within a bullish rectangular structure on the 1-month chart, which has the potential to break to the upside.
  • This structure began forming after XRP soared to $3.4 in January 2025 and pulled back, leaving prices to consolidate between $1.6 and $3.
  • The current structure resembles a similar triangular consolidation that XRP observed in 2017, which led to a 617% rally.

XRP Bullish Triangular Structure

EGRAG Crypto, a skilled chartist, highlighted this rectangular structure in a recent analysis. According to him, the patterns have appeared “everywhere,” but most market participants have refused to look.

Data from his chart shows that XRP has continued to consolidate within a range of $1.6 and $3 since it collapsed from the $3.4 peak in January 2025. While the altcoin has witnessed occasional upswings to prices such as $3.66, attained in July 2025, it spent most of 2025 trading within the $1.6 and $3 range.

This range-bound phase has sustained the price action within the bullish rectangular structure. The XRP price attempted to engineer a breakout above the upper trendline during the July 2025 rally to $3.66, but the resistance at this trendline forced a pullback. EGRAG expects a successful breakout to lead to outsized gains.

Historical Context

EGRAG’s optimism comes from the historical context surrounding XRP’s interactions with past bullish rectangular structures. Specifically, data from the 1-month chart indicates that this structure first appeared during the 2015 to 2017 period. Notably, within this period, XRP traded between $0.009 and $0.028 from February 2015 to February 2017.

By March 2017, XRP staged a breakout above the structure, leading to a price run. This price run pushed XRP from $0.00555 in March 2017 to $0.3988 by May 2017. This represented a 617% increase in price within three months. 

XRP 1M Chart EGRAG Crypto
XRP 1M Chart | EGRAG Crypto

Interestingly, XRP also saw a smaller bullish rectangular structure in 2024. Specifically, from February to October 2024, the XRP price traded within a range of $0.4 and $0.74. However, the November 2024 upsurge, which emerged on the back of President Trump’s election victory, pushed XRP from $0.5 to $3.4 by January 2025, a 580% rise within three months.

Next Week Could See the Start of an XRP Rally

0

XRP may be approaching a fresh upside move as early as next week, according to a new technical outlook.

The bullish commentary comes as bearish pressure around XRP continues after the coin broke below $2. At press time, XRP is trading around $1.93, down 2.34% on the day and 6.13% over the week.

Meanwhile, based on long-term chart structure, some market commentators suggest the market could be setting up for the early stages of a new XRP rally as soon as next week.

Key Points

  • XRP is consolidating above key support, setting up a rally as early as next week.

  • A multi-year compression has resolved, confirming XRP’s long-term bullish structure.

  • Selling pressure is fading as momentum stabilizes, a classic sign of base-building.

  • History suggests XRP breakouts often occur suddenly, rewarding traders who position early.

Multi-Year Compression Has Already Resolved

Notably, this bullish outlook comes from CW, a widely followed analyst and CryptoQuant-verified author. His analysis highlights that XRP spent years trading within a tightening range, with prices forming lower highs and higher lows.

The pattern reflects long-term consolidation and reduced volatility. Crucially, XRP has already broken out of this structure to the upside, confirming that the long compression phase is complete.

CW's XRP long-term chart
CW’s XRP long-term chart

Breakout Strength

When XRP broke out of the wedge, the rally was strong and decisive. Specifically, XRP’s price moved from around $0.50 in November 2024 to above $3.60 in 2025.

The price also held above the breakout level instead of quickly reversing, supporting the view that the move was technically solid.

Importantly, after the pullback phase, XRP did not fall back into its old range near $0.50. Instead, it has spent the past few months consolidating above its former resistance around $2. Analyst sees this as a healthy pause within an uptrend, forming a base before another move higher.

Notably, momentum indicators show selling pressure gradually fading, with momentum drifting back toward neutral. With price structure holding and momentum rebuilding, conditions appear favorable for a potential upside move.

Breakout Next Week?

CW notes that XRP is consolidating, but this time above a confirmed breakout level. With limited resistance overhead and stabilizing momentum, the setup suggests a directional move could occur soon.

While an immediate surge is not guaranteed, the structure indicates that the early phase of a new rally could begin as early as next week.

“Nobody Can Predict XRP Next Breakout”

Separately, some analysts argue that XRP’s next major move is unlikely to come with advance warning. Past cycles suggest XRP tends to trade quietly, drain confidence, and then break out suddenly, catching most traders off guard.

Technical analyst ChartNerd notes that by the time momentum becomes obvious, price is often already well above key levels.

Commentator Moon Lambo adds that timing the breakout matters less than having exposure beforehand. He says XRP historically rewards early positioning, while late buyers often end up chasing near local tops.

XRP last surged from $0.50 in November 2024 to a peak near $3.66 in mid-2025 before entering a deep correction. Now trading near $1.90, it sits in a familiar zone where optimism is low.

If history repeats, XRP’s next major breakout may arrive when few expect it, and those already positioned could benefit the most.

Cardano Needs This Level to Confirm End of Consolidation in Valid 1-2 Wave Pattern

0

Cardano could be following a well-structured bullish pattern, and its price action around two key levels would either confirm or invalidate this.

The recent price development for Cardano (ADA) mirrors a 1-2 wave in a broader Elliot Wave Theory structure. However, Cardano needs to reach an identified price level to confirm the structure and the end of the wave 2 correctional push.

Key Points

  • Cardano could be following a well-structured bullish pattern, and its price action around two key levels would either confirm or invalidate this.
  • The recent price development for Cardano mirrors a 1-2 wave setup in a broader Elliot Wave Theory structure.
  • The January 6 peak price of $0.43 was the first wave of the structure.
  • Wave 2—typically corrective—started after the end of the early January bullish session, steering Cardano to drop to its January 19 low of $0.34.
  • Cardano would confirm the Elliot Wave pattern when it breaks above $0.404, representing a 10% growth from here.
  • ADA can also invalidate this Elliot Wave structure formation if it drops to $0.328. 

Cardano in a Valid 1-2 Wave Pattern?

Research firm More Crypto Online identified in its recent X post that Cardano is in a valid 1-2 wave pattern. An accompanying chart provides further context, showing what appears to be an Elliott Wave pattern on the 30-minute timeframe.

Cardano 1-2 Wave Pattern/More Crypto Online

The chart labelled the January 6 peak price of $0.43 as the end of the first wave of the structure. For context, this first wave began at the $0.32 lows on December 31, 2025, spurring a 34% surge to the early January high.

Notably, the chart suggested that wave 2—typically corrective—started after the end of the bullish session. This has led Cardano to drop to its January 19 low of $0.34 before rebounding to its current market standing.

Confirmation and Invalidation Points

Furthermore, the validity of this formation remains in contention, and More Crypto Online has shared points to confirm whether it is actually an Elliott Wave structure in the works. The platform highlighted that Cardano would confirm this pattern when it breaks above $0.404.

Reaching this price level, which aligns with the lower high formation on January 17, would also confirm that ADA has formed the low for the wave 2 corrective phase. Nonetheless, the analyst also identified the potential for further correction to retest the $0.34 low, which aligns with the 78.60% Fibonacci retracement level.

Meanwhile, Cardano can also invalidate this Elliot Wave structure formation if it drops to $0.328. This would imply a decline below recent lows, a move that would further add pressure on ADA’s price.

If wave 2 forms completely, the next is a bullish wave 3 phase, which typically is the largest uptrend in the Elliott Wave Theory. However, this move remains speculative and would depend on several market conditions to materialize.

Weekly Bullish Shiba Inu Reversal Wedge Valid as SHIB Back at Yearly Demand Zone

0

The earlier upward momentum for the prominent meme coin Shiba Inu has decayed, pushing prices back to the yearly demand stronghold.

Shiba Inu (SHIB) dropped to the support level following its Trump tariff-inspired decline to $0.00000745 yesterday, in line with broader crypto market trends. While this has cut down the asset’s year-to-date profitability from 46% to 13.9%, it could be part of a broader bullish formation.

Key Points

  • Shiba has collapsed to the yearly support from which it bounced on January 1.
  • The recent SHIB consolidation also aligns with a trend within a tightening descending channel on the weekly chart.
  • Two scenarios are possible here: further decline to retest the wedge’s lower support trendline or a bullish reversal to target its neckline resistance.
  • Further downsides will see SHIB retest multi-year lows, while reclaiming the channel’s neckline fuels the prospect of a breakout to retest multi-year highs

Shiba Inu Bullish Reversal Wedge Still Valid

Shiba has collapsed to the yearly support from which it bounced on January 1. The token held this higher-timeframe demand zone despite the abysmal performance in the last quarter of last year, underscoring its importance for subsequent price action.

Notably, the recent consolidation also aligns with a trend within a tightening descending channel on the weekly chart. Shiba Inu has remained trapped within this structure since its May 2025 high of $0.00001765, and multiple attempts to break free have failed.

Shiba Inu Descending Wedge

The recent drop to the yearly support still aligns with the trend within the channel. Meanwhile, two scenarios are possible here: further decline to retest the wedge’s lower support trendline or a bullish reversal to target its neckline resistance. Each outcome depends on the prevailing momentum around Shiba Inu and the broader crypto market mood.

Specifically, further downsides will see SHIB retest multi-year lows. However, reclaiming the channel’s neckline fuels the prospect of a breakout to retest multi-year highs.

Lower Timeframe Confirmation

On the daily chart, this accumulation within the descending channel remains in place. The January 5 swing to $0.00001009 saw Shiba Inu make its closest reach for the upper resistance trendline since September 2025.

If Shiba Inu recovers from the recent price rejection and resumes another northward push, it could target the upper resistance trendline at $0.0000110. However, an opposite price trend may occur, and prices could continue to trend lower. 

Hence, this outlook is based solely on data and technical developments and provides no certainty, nor is it financial advice.

XRP Price Prediction for Jan 20: Bulls Need to Break Above $2.08 or Retest $1.86 Support

0

XRP must break above key resistance levels to trigger a bullish shift, while failing to do so could lead to a retest of critical support.

XRP is currently trading at $1.95, down about 0.3% in the last 24 hours. The price action has been relatively negative within this period, with a daily range between $1.94 and $2.02. The 24-hour trading volume remains significant at $2.84 billion; however, the volume has dropped 19.03%.

Over higher time frames, XRP’s recent performance has been a mix of volatility and a general decline, with a 5.5% drop over the last 7 days and 17.9% loss in the past 14 days. However, XRP has shown some resilience over the last 30 days, up by 1.6%, indicating that the asset faces near-term downward pressure.

Where’s XRP Headed?

On the technical end, the Bollinger Bands indicator shows the price is approaching the lower band, currently set at $1.8687. This could signal a potential reversal or at least a temporary support area, but the price is still clearly under pressure as it remains below the middle band around $2.0830.

XRP 1-Day Chart
XRP 1-Day Chart

Elsewhere, the Average Directional Index at 23.29 indicates that the market’s trend strength is moderate but moving to the downside. While this suggests some trend activity, the relatively low reading points to a lack of strong directional momentum.

Traders may need to wait for the price to either break above the middle band or retest support near the lower band to determine the next move. If XRP can break above the $2.08 level and hold above it, there may be potential for a bullish shift. Otherwise, failure to recover could bring further downside risk.

XRP Approaches a Bullish Cross

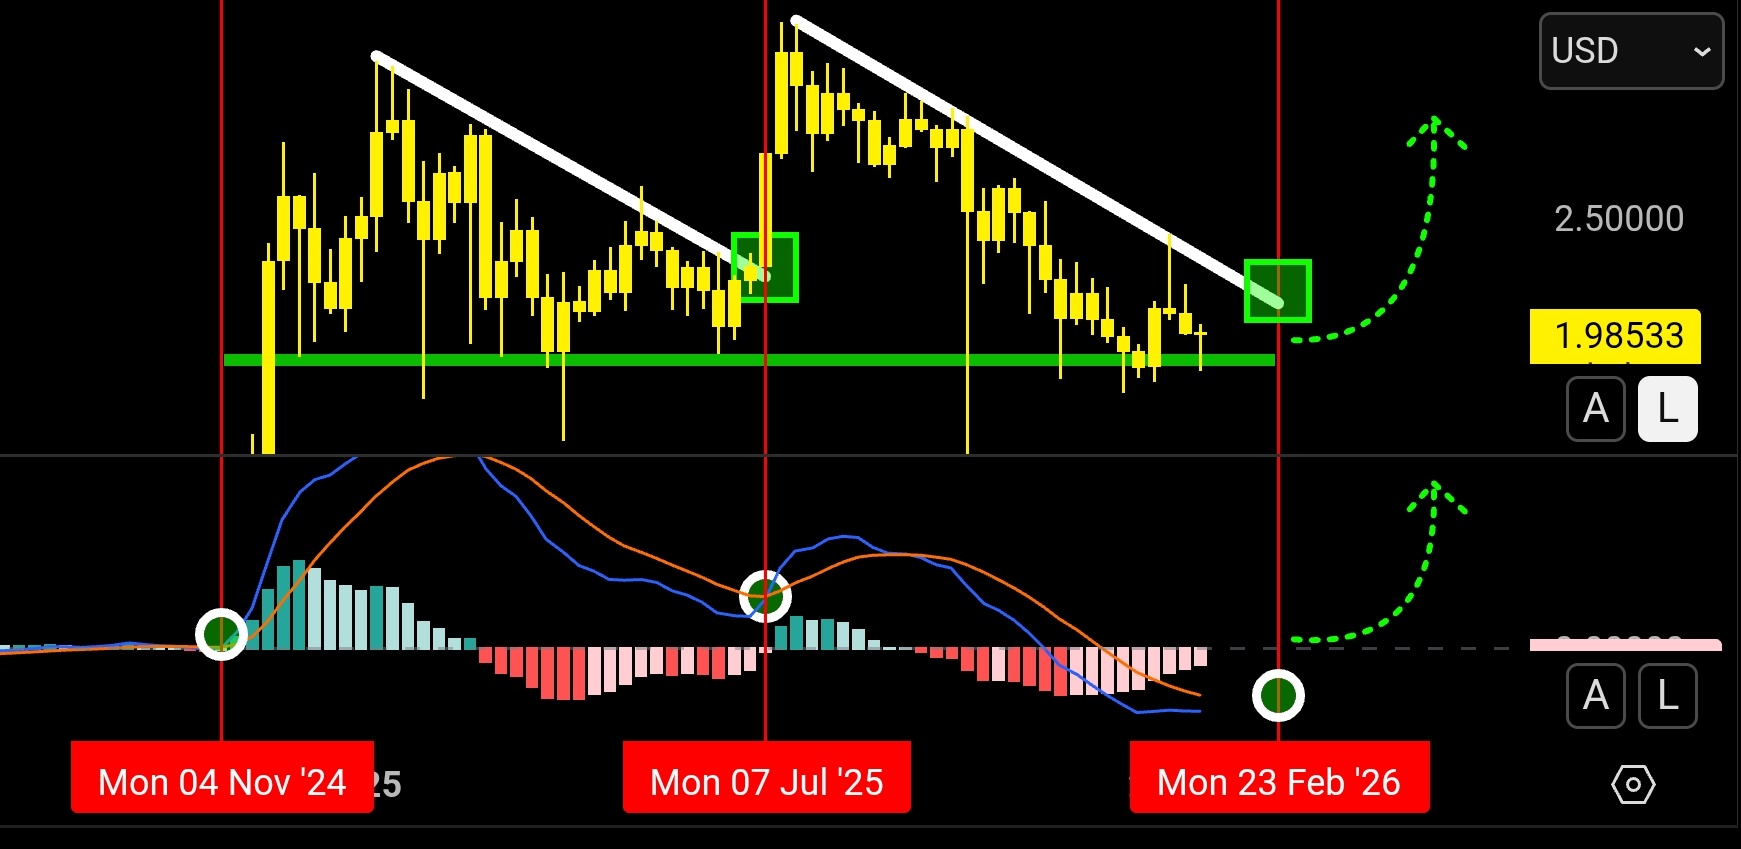
Per a recent chart by ChartNerd, XRP is showing potential for a bullish breakout in the coming weeks. The price is nearing a key level where it could break its descending resistance, forming a bullish cross on the weekly MACD.

XRP Prediction
XRP Prediction

If this occurs, it could signal the start of a strong upward movement, similar to the previous bullish cross that drove XRP to new all-time highs. As XRP approaches this critical juncture, market watchers are closely monitoring these indicators, with the expectation that a clean break above current resistance levels could lead to a surge in price.

Bitcoin Price Glitch Takes BTC to $0 on Paradex

0

A technical failure on Paradex, a decentralized derivatives exchange built on Starknet, briefly displayed Bitcoin as being priced at zero.

The erroneous data, caused by a database migration issue, was rapidly picked up by algorithmic systems across the platform. As leveraged positions were liquidated en masse, Paradex suspended trading and initiated a rollback to contain the damage.

Although services were later restored, the incident has reignited debate over the operational resilience and governance practices of decentralized finance (DeFi) infrastructure.

Key Points

  • Paradex reported a database migration error that caused Bitcoin’s price to hit $0.
  • The derivatives exchange resumed trading after an emergency rollback.
  • Users reported widespread liquidations caused by the zero-price feed.
  • Starknet’s STRK token fell roughly 5% following the incident, according to CoinMarketCap.
  • Bitcoin traded below $93,000 globally at the time of the disruption.

Database Error Triggers Automated Liquidations

The disruption began during a routine database migration on Paradex. During the process, Bitcoin was incorrectly set to zero in the exchange’s internal systems.

That false price was immediately picked up by automated trading programs. Consequently, leveraged positions were automatically closed without human intervention, amplifying losses across the platform.

Once the anomaly was identified, Paradex limited further damage by halting all trading activity.

Trading Suspension and Rollback Response

Following the suspension, Paradex initiated a rollback to restore accurate records and system integrity. Most open orders were canceled as part of the recovery process, while take-profit and stop-loss instructions were left active to maintain basic risk controls.

Trading access was restored around 12:10 UTC on January 19, according to the exchange. Paradex assured users that all funds remained secure, noting that the recovery process was technically complex and ongoing.

The incident also weighed on sentiment around Starknet more broadly. Its native STRK token declined about 5% shortly after the disruption, according to CoinMarketCap.

Bitcoin prices on other venues remained relatively stable. As of press time, Bitcoin is trading at $91,076, down 1.8% over the past 24 hours.

Analysts at CryptoQuant attributed recent selling pressure to U.S. investors outside of ETF products, noting that U.S. Bitcoin ETFs were not trading during the incident.

Meanwhile, Bitfinex analysts pointed to gradual improvements in market structure but warned that selling pressure persists amid macroeconomic and geopolitical uncertainty.

User Backlash and Governance Questions

Reactions on X were largely negative following the rollback. Several users questioned whether a decentralized exchange should reverse on-chain activity at all.

Others raised concerns about Starknet’s maturity as a layer-2 network. While some acknowledged Paradex’s timely communication, many said the incident had damaged confidence in both the platform and the broader ecosystem.

XRP Grinding Sideways for 1+ Year That Could Open Door to $9

0

XRP now trades close to a critical pivot level that could decide its next major push, with long-term chart data suggesting a path toward the $9 region.

Currently changing hands at $1.96, XRP has continued to trade in a tight range between $1.9 and $2 after more than a year of sideways movement. Interestingly, XRP maintained this level throughout 2025 while most of the market lost ground.

Today, XRP now eyes a potential push toward $3, specifically at $3.09, which it last saw in early October 2025. Once the altcoin recovers this pivot and transforms it to support, its next target lies at the $9 price, representing a new all-time high.

Key Points

  • The XRP price has remained range-bound for more than a year while many altcoins declined, signaling relative strength.
  • Historical data confirms XRP reclaimed and held above former cycle highs from the 2021 period, confirming a bullish shift in structure.
  • The weekly chart identifies $3.09 as a major pivot level that must convert into support to lead to the next expansion phase.
  • Weekly Fibonacci extensions identify the $9.00194 region as the next long-term target once the pivot is resolved.

XRP’s Historical Breakout

This target came up during the latest market commentary from prominent market watcher Matt Hughes (The Great Mattsby). According to Hughes, XRP has maintained a position within the $1.9 to $2 price range over the past year, while the rest of the market sees losses.

Data from his chart shows XRP struggled below $1 and $2 before this range-bound phase. Specifically, after trading at lower prices from 2014 to 2016, XRP witnessed an expansion that began in 2017 when it broke out above the $0.005 area and surged into early 2018. 

The price climbed to the $3.3 mark, setting one of the highest levels in its history. This peak later became the reference point used by Hughes for the Fibonacci extension levels on his chart. After topping out, XRP entered a sharp correction that led to a prolonged bear market.

XRP Consolidates Below $1

From 2018 through 2020, XRP trended lower and moved sideways, spending most of its time between $0.20 and $0.50. Volatility dropped compared to the prior cycle, and repeated failures to reclaim higher levels confirmed that sellers controlled the market. 

A recovery push in 2021 led to $1.96, but this rally was short-lived. Notably, XRP was only able to rebound from the $0.2-$0.5 levels in November 2024, when it soared from $0.5 on the back of the U.S. elections to reclaim the 2018 peak of $3.3 by January 2025.

The Critical Pivot Level

This set the tone for what the analyst calls a grinding phase that lasted more than a year. Throughout 2025, XRP held a narrow range between $1.9 and $2 while many altcoins declined sharply. Its price action looked similar to accumulation rather than exhaustion. 

While XRP still trades within the range, the price now holds above nearly all prior cycle highs except for the extreme peak set in 2018. Amid this price action, Hughes has now called attention to the next major technical barrier at the 2.272 Fibonacci extension, located at $3.09882. XRP last saw this price level in early October 2025.

XRP 1W Chart The Great Mattsby
XRP 1W Chart | The Great Mattsby

The analyst called this level the key pivot for the market. Specifically, a decisive move above it, followed by sustained support, would mark a change from consolidation into expansion.

Beyond that point, the chart presents the next long-term objective at the 2.618 Fibonacci extension around $9.00194. This level does not come from speculation or guesswork. Instead, it stems directly from historical price behavior and the same extension framework that defined prior cycles.

Peter Schiff Says Bitcoin Could Move ‘In Reverse’ as Silver Rallies to All-Time High

0

Economist and market commentator Peter Schiff has renewed his warning on Bitcoin, arguing that its price path may soon diverge from silver as pressure builds on the U.S. dollar.

In a post on X, Schiff pointed to silver’s recent rally as a potential signal of trouble ahead for Bitcoin. He suggested that the same macroeconomic forces driving investors toward precious metals could ultimately trigger a downturn in cryptocurrencies.

Key Points

  • Peter Schiff has reiterated his cautious stance on Bitcoin.
  • He suggests Bitcoin may stop moving in line with silver in the near future.
  • U.S. national debt has exceeded $38 trillion.
  • Interest payments on U.S. debt are now higher than annual U.S. defense spending.
  • The U.S. Dollar Index fell over 10% in 2025, its worst year in nearly a decade.
  • In 2025, Gold increased by more than 60%, while Silver increased by 140%.

Schiff Predicts Bitcoin Could Drop as Silver Climbs

In his tweet, Schiff argued that silver’s surge is not a bullish signal for Bitcoin, but rather a sign that investors are repositioning in anticipation of deeper financial stress. According to him, Bitcoin could soon mirror silver’s move only in the opposite direction.

Schiff cautioned that investors who fail to recognize the growing divergence between precious metals and Bitcoin may be misinterpreting broader market signals.

Interview Adds Broader Economic Context

The social media post followed similar remarks Schiff made last week on The Randi Hipper Show. During the interview, he said the U.S. economy is edging closer to a dollar crisis, with rising debt and currency weakness increasingly reflected in gold and silver prices.

Schiff compared current conditions to those in 2007, when early stress in financial markets preceded the subprime mortgage collapse and the 2008 financial crisis. In his view, today’s metals market is sending a comparable warning.

Bitcoin Framed as Vulnerable, Not Protective

Building on that comparison, Schiff rejected the idea that Bitcoin would benefit from a dollar crisis. Specifically, he disputed claims that Bitcoin functions as “digital gold,” arguing instead that a weakening dollar would undermine cryptocurrencies rather than support them.

He added that broader financial stress would likely spill into stocks, bonds, and real estate. However, Schiff maintained that Bitcoin would not act as a safe haven during such instability.

In contrast, Schiff expressed confidence in gold and silver. He argued that when trust in fiat currencies erodes, investors tend to gravitate toward tangible assets. Consequently, he expects continued demand for precious metals during periods of dollar weakness.

Recent performance figures reinforce that contrast. In 2025, gold rose more than 60%, while silver surged 140%. Schiff characterized these gains as early indicators of a more significant realignment in global markets.

Fiscal Strain Underpins the Warning

Schiff tied his broader warning to deteriorating U.S. fiscal conditions. The national debt has now exceeded $38 trillion, with interest payments alone surpassing annual U.S. defense spending.

Meanwhile, the U.S. Dollar Index fell more than 10% in 2025, marking its worst annual decline in nearly a decade. Taken together, Schiff argues these trends strengthen the case that precious metals and Bitcoin are heading in fundamentally different directions.

Cardano Next Big Move May Hinge on This Critical Price Level

0

Despite aggressive shorting pressure pushing Cardano lower, traders increasingly expect ADA to trade sideways before a significant upside. 

Over the past few days, Cardano has remained bearish, with ADA down 6.34% on the week. Although the token briefly climbed to nearly $0.43, it has since slipped below $0.40 and is now consolidating between $0.36 and $0.37.

Key Points

  • ADA remains bearish in the short term, down 6.34% over the past week, reflecting sustained selling momentum. 
  • $0.3711 serves as a critical consolidation level that could pave the way for massive accumulation and an upside move to $9.62. 
  • Macroeconomic risks remain a key threat and could nullify any strong upside move. 
  • Large investors continue to increase their exposure, with 210 million ADA accumulated in three weeks. 

Critical Consolidation Level That Could Fuel a Strong Rally 

In a recent commentary, analyst Emilio Bojan criticized persistent bearish positioning against ADA, suggesting that continued shorting of utility-focused projects is misguided. Rather than calling for an immediate breakout, he identified $0.3711 as the key level where he wants ADA to consolidate. 

According to Bojan, this range-bound action could support healthy accumulation and gradually set the stage for expansion. The accompanying chart supports this view, showing ADA stabilizing around the $0.3711 support zone. 

Consequently, Bojan sees the current base-building phase as a precursor to the next major expansion cycle. From this level, he projects potential rallies of 107.28%, 533.74%, 1,213%, and 2,493%, which could lift ADA to approximately $0.76, $2.34, $4.87, and $9.62, respectively.

While Cardano has previously reached the $0.76 and $2.34 targets, moves to $4.87 and $9.62 would set new all-time highs for the token. 

Cardano potential surge to $9
Cardano potential surge

ADA Faces Consistent Bearish Pressure in 2026 

Meanwhile, Cardano has faced intense selling pressure in 2026. After a weak performance in Q4 2025, ADA started the year strongly, surging 30.91% in the first six days as it climbed from $0.3328 to $0.4357. 

However, the rally quickly faded, with ADA posting steady losses and extending its intraday decline streak to 13 days. Over the weekend, renewed U.S. tariff pressure against eight countries intensified the sell-off, dragging ADA down from around $0.39 to $0.36. As a result, macro headwinds sabotaged any gains ADA could have experienced from its recent surge in bullish sentiment.  

Whales Accumulate 210M ADA

Amid the downturn, large investors took advantage of lower prices to increase their exposure to Cardano. Market analyst Ali Martinez reported that whales accumulated 210 million ADA over the past three weeks, boosting their total holdings to 13.66 billion.

Meanwhile, despite Emilio Bojan’s projection of a potential 2,493% upside, market conditions remain volatile due to mounting tariff risks. With the U.S. set to impose a 10% tariff on imports from several European countries starting February 1, analysts warn that possible EU retaliation could heighten volatility and further pressure risk assets. 

Ethereum Analysis for Jan 20: ETH Must Reclaim the $3,200 Level as Analyst Says $4K Next

0

Ethereum must reclaim key resistance levels to stabilize and avoid further downside, with analysts expecting a potential surge toward higher targets.

Notably, Ethereum (ETH) is trading near $3,115, down about 2.3% over the past 24 hours, reflecting renewed selling pressure across the broader crypto market. The intraday chart shows ETH spending much of the session consolidating above $3,200 before a late-session drop pushed the price toward the $3,100 region.

From a broader performance view, Ethereum’s weakness is mostly short-term. The asset is nearly flat over the past 7 days (-0.1%) and down 3.4% over 14 days. However, ETH remains up 4.8% in the last 30 days, indicating that the broader trend still leans constructive despite the current pullback. The key question now is whether buyers step in to defend the $3,100 level, or if this pullback marks the start of a deeper correction.

Ethereum Price Analysis

Ethereum’s daily chart shows growing short-term weakness as price slips below key Alligator indicator levels. ETH is trading at the lower end of its trading range, with the Jaw around $3,168, Teeth near $3,206, and Lips around $3,230, all positioned above the current price. 

Ethereum Price Analysis

This alignment signals a bearish phase, as price is trading below all three moving averages, indicating sellers remain in control. The Alligator lines are also starting to fan out slightly, which often suggests the market is transitioning from consolidation into a directional move, currently biased to the downside.

Moreover, momentum indicators add to this cautious outlook. The MACD has turned negative, with the histogram printing red bars and the MACD line crossing below the signal line. This reflects fading bullish momentum following the early-January rebound and confirms that recent selling pressure is not just price noise but supported by momentum deterioration. 

Taken together, the indicators suggest Ethereum is in a short-term corrective phase. A recovery would likely require ETH to reclaim the $3,200–$3,230 zone, where the Alligator’s Lips and Teeth could converge, to signal renewed bullish control. Until then, downside risk remains elevated, with traders closely watching whether ETH can stabilize above the psychological $3,100 level or faces further pressure toward lower support zones.

Ethereum’s Push Towards $4K?

On the commentary end, analyst Merlijn The Trader says Ethereum is currently in an uptrend compression phase, forming an ascending triangle. Bears continue to attempt lower moves, but each dip meets buying pressure, creating higher lows along the ascending trendline. 

Ethereum Prediction
Ethereum Prediction

This consistent buying at lower levels is building pressure, setting up ETH for a potential breakout through the resistance trendline. The $3,400 resistance remains key; once ETH breaks above this level, the price is expected to surge toward $4,000 and beyond, marking the start of a faster upward move.