Home Blog Page 329

Ethereum and Solana 2025 Roundup: $18.8T in Stablecoin Transfers, $99B in DeFi, 244M Wallets

0

Ethereum and Solana have each released annual reviews framing 2025 as a pivotal year in their development.

Though their strategies diverge, both networks portrayed the past year as laying essential groundwork for a shared ambition: becoming the dominant blockchain platform for users and institutions.

The reports, published Tuesday by the Ethereum Foundation and the Solana Foundation, detailed gains in usage, revenue, and infrastructure. Together, they offer a snapshot of two distinct visions competing to shape the future of the blockchain ecosystem.

Ethereum Emphasizes Stability, Scale, and Institutional Trust

Ethereum’s year-end review underscored its focus on reliability and long-term resilience. Instead of pushing experimental features, the Ethereum Foundation characterized 2025 as a year of consolidation.

Development followed 12 guiding themes to strengthen institutional participation and improve interoperability with other blockchain networks. According to the foundation, this approach reinforced Ethereum’s role as the industry’s most established settlement layer.

Consequently, Ethereum maintained its lead in decentralized finance (DeFi). By the end of the year, more than $99 billion remained locked across its DeFi protocols, far exceeding totals on other Layer 1 networks.

Ethereum also continued to dominate prediction markets. Activity across the main chain and its Layer 2 networks generated roughly $20 billion in total betting volume during the year.

Network Upgrades Support Ethereum’s Long-Term Vision

Infrastructure improvements played a central role in Ethereum’s progress. For instance, in 2025, the network processed $18.8 trillion in stablecoin settlements.

Moreover, two major upgrades, Pectra and Fusaka, were rolled out during the year. These upgrades increased throughput, improved data availability, and streamlined cross-network communication.

The Ethereum Foundation stated that the upgrades also simplified wallet architecture, reducing friction for both everyday users and institutional participants. Specifically, Fusaka was described as laying the groundwork for mobile-first applications, which Ethereum expects to support broader consumer adoption in 2026.

Solana Highlights Rapid Expansion and User Activity

While Ethereum leaned into stability, Solana emphasized speed and momentum. The Solana Foundation described 2025 as a year of record-breaking engagement across its ecosystem.

Application revenue reached $2.39 billion, up 46% from the prior year, driven by a wide range of platforms. Notably, seven applications generated more than $100 million each, including trading venues such as Jupiter and Raydium, as well as memecoin platform Pump.fun.

Image

Additionally, stablecoin activity surged. The total supply issued on Solana doubled year-over-year to $14.8 billion, facilitating $11.7 trillion in stablecoin transfers.

However, despite these gains, the foundation noted a decline in memecoin trading. Volumes in that segment dropped by about 10% during the year.

Image

Trading and Token Creation Drive Solana’s Momentum

Solana’s trading infrastructure remained a key engine of growth. For instance, decentralized exchange aggregators processed a combined $922 billion in volume, according to the foundation.

Meanwhile, token launch activity expanded sharply. Revenue from launchpad platforms doubled to $762 million, while roughly 11.6 million tokens were created during the year. Of these, approximately 105,000 advanced beyond early bonding stages, indicating sustained developer and user engagement.

Usage Metrics Reflect Divergent Architectures

User activity continued to rise across both ecosystems, though comparisons remain complex. Solana averaged 3.2 million daily active wallets in 2025, with approximately 725 million new wallets executing at least one transaction.

Ethereum reported activity on a different scale. Base-layer applications recorded more than 244 million unique active wallets over the year.

Throughput figures further highlight architectural differences. Ethereum’s rollups averaged roughly 5,600 transactions per second combined, while Solana averaged about 1,054 non-vote transactions per second. Both foundations cautioned that the metrics are not directly comparable.

Falling Transaction Costs Support Broader Adoption

Despite their contrasting designs, both networks shared a common priority in 2025, which was reducing transaction costs. Solana lowered its average transaction fee to $0.017, down from the previous year. Similarly, Ethereum also saw significant fee reductions. Base-layer costs reached five-year lows, while Layer 2 fees dropped below one cent.

Both foundations argued that declining fees improve accessibility and usability, even as they questioned the relevance of traditional revenue metrics for evaluating blockchain networks.

As they enter 2026, Ethereum and Solana present contrasting strengths. Ethereum is focusing on security, decentralization, and institutional trust. In contrast, Solana is highlighting speed, scale, and consumer-facing growth.

Through their 2025 retrospectives, both networks position themselves as central players in the next phase of blockchain adoption — each advancing a different vision of how decentralized technology should evolve.

Two Major Reasons Cardano Is Poised to Target Higher Prices From Current Levels

0

An analysis has highlighted two major reasons why Cardano is poised to target higher prices from the current market level.

Cardano has rallied over 23% YTD, spurred by a broader market resurgence. Despite this, a January 6 TradingView analysis from a pseudonymous market commentator suggests the coin could see higher prices.

Cardano Holds Channel Support

Notably, one of the reasons for this bias is ADA’s firm grip of a channel support on the daily chart. The analysis highlighted that the cryptocurrency has formed a base at a multi-month demand zone around $0.35.

Cardano visited this area in December, but buying pressure from the region cushioned weak price action. Consequently, it bounced from this region to a high of $0.43 this week before a slight correction.

In a broader context, an accompanying chart shows that ADA broke below an ascending channel in November 2025, as the market turned bearish from August 2025 onward. While the asset broke below the lower support trendline, the multi-month support just below the zone has held, with multiple bullish reversal signals pointing to a bounce to much higher prices.

Cardano Holds Channel Support

ADA to Grab the Liquidity Above the Current Price

Furthermore, the analyst identified a liquidity cluster above the current market price. Usually, these clusters are price magnets, and whales push an asset to grab them before subsequent moves.

The analyst expects nothing different from Cardano, predicting that it will rally further to claim these visible liquidity pockets ahead. Interestingly, he identified these areas in his analysis and highlighted what would invalidate a possible uptrend to attain them.

Cardano Take-Profit Areas

First, he placed his entry between $0.34 and $0.37. At the time of writing, ADA has moved past these areas, changing hands at $0.41.

His first take-profit target is $0.44, which he identified as the first supply zone. His second and third TP areas are $0.50 to $0.55 and $0.60 to $0.65. He called the former a liquidity shelf and the latter the “small sell order” region.

Finally, he highlighted the $0.73-$0.78 range as the maximum target. The supply zone, identified as the golden Fibonacci level, represents a 78% and 90% increase from the current market price.

However, the market analyst emphasized that a drop to $0.245 invalidates this move. The stop loss aligns with a break below the channel’s structural lows.

Bitcoin and Ethereum Must Stay Stable

Notably, the analyst also hinged this rally on the stability of Bitcoin and Ethereum, the two largest cryptocurrencies by market cap. A sharp downtrend in these assets could undermine the potential bullishness in ADA.

Cardano would also benefit from the liquidity rotation to layer 1 tokens. Notably, most altcoins have outperformed BTC recently, and the market commentator suggests investors would switch towards large-cap coins for better gains rather than hold BTC.

Ethereum Analysis for Jan 7: Can Ethereum Close Above $3,303 Overhead Resistance?

0

Ethereum is facing key resistance, with strong bullish momentum, while liquidation data highlights ongoing market volatility.

The first week of 2026 has seen Ethereum (ETH) trading at $3,253.44, down a modest 1.2% in the last 24 hours. With a market cap steady at $392.7 billion and a robust 24-hour volume of $28.85 billion, ETH holds its no. 2 rank firmly.

Ethereum has gained 9.5% over the past 7 days and 11% in the last 14 days, reflecting strong positive momentum.

A CoinGecko chart shows a positive momentum, particularly from January 6, with a sharp price increase before stabilizing above $3,240. Given the bullish trend, Ethereum’s price could continue to rise, particularly if it breaks the immediate resistance levels above $3,300.

Ethereum Price Analysis

Ethereum is currently testing key Fibonacci retracement levels as it approaches potential resistance at $3,303, which aligns with the 0.786 Fibonacci level. The recent price action shows a strong rally, but ETH is facing a challenge at this level, which could act as an overhead resistance.

Ethereum 1-Day Chart

The next significant resistance level is the $3,447 area, marking the top of the current range. If Ethereum can close above $3,303, it may confirm a breakout and could target higher levels, potentially pushing toward the $3,400–$3,600 zone.

On the downside, ETH has established $3,190 as potential support, marked by the 0.618 Fibonacci retracement level. If Ethereum experiences a pullback, this area will likely act as a critical floor, providing buying support. A drop below this level would open the door for further declines towards $3,100 or $2,980, the next key Fibonacci levels.

The Awesome Oscillator also supports this, with green bars indicating bullish momentum as long as the market remains above these support zones.

Ethereum Liquidation Data

Ethereum’s futures market, albeit punishing the bulls, continues to show strong volatility and potential for price swings. Over the past 24 hours, $101.83 million in total liquidations occurred, with $56.65 million coming from long positions and $45.18 million from short positions.

Ethereum Liquidation

In shorter time frames, long positions consistently lead the liquidations, such as in the 4-hour and 1-hour windows, where $7.60 million and $7.21 million worth of long positions were liquidated, respectively. The significant pressure on long positions suggests a bullish bias in Ethereum’s price action, but the high liquidation figures are a sign of caution.

Cardano Could Follow XRP Playbook as Technical Setup Points to a Possible 40% Upside

0

Cardano appears to be setting up for a move similar to XRP recent breakout, which could propel its price toward the $0.60 level.

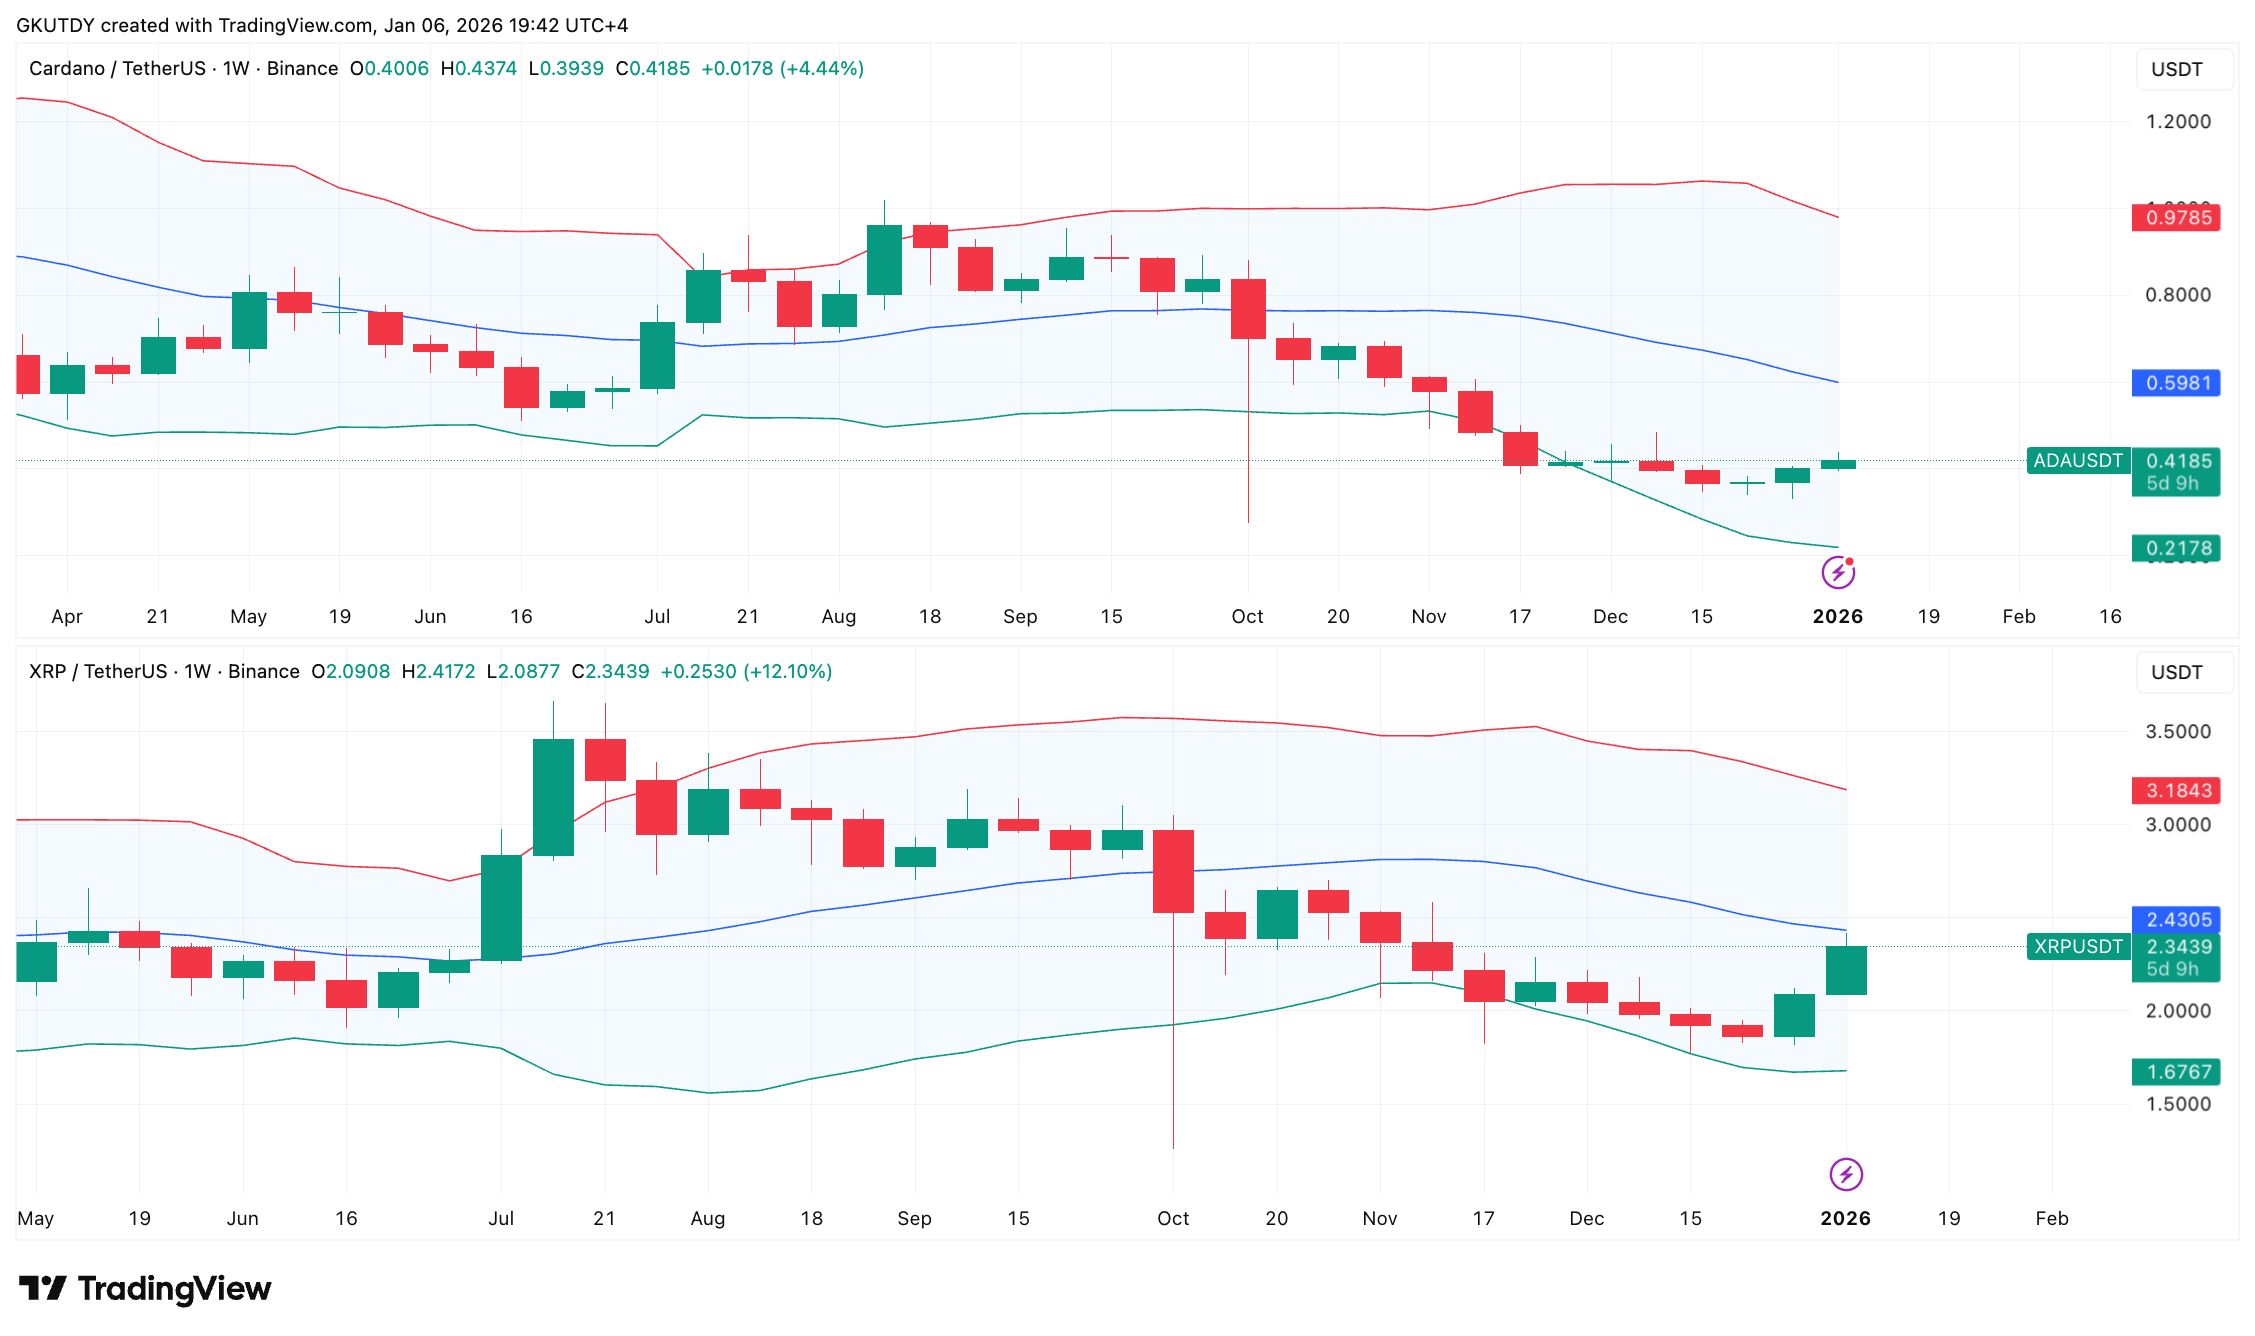
For context, XRP reclaimed its weekly mid-Bollinger Band this week after recording steady gains over the first six days of the year. The token surged more than 30% from its $1.84 opening price, reaching around $2.43. This level aligns with its weekly mid-band, which corresponds to the 20-week simple moving average.

Before this bullish breakout, XRP had remained stuck below the weekly Bollinger midline. During that period, the market largely overlooked the token, which traded near the lower band amid lingering uncertainty. 

Possible Action If Cardano Follows XRP Playbook 

Interestingly, Cardano now appears to be in a near-identical position to XRP before its upward move. At its current price of $0.4198, ADA trades roughly 30% below its weekly midband, which sits near $0.60. 

Notably, its broader technical structure closely mirrors XRP’s earlier setup, including a prolonged weekly downtrend, a rebound from the lower Bollinger Band, and early signs of re-entering the trading channel. 

Article image

If ADA follows XRP’s trajectory, a move back toward the mid-band could lift the token to approximately $0.5986, representing a gain of more than 40% from current levels. Such a rally could unfold quickly, as mid-band reversion moves often attract momentum traders as confidence returns. 

Meanwhile, Cardano has already delivered an impressive performance this week. ADA rallied to $0.4357 yesterday, marking a 30.91% jump from its 2026 opening price of $0.3328.

Although the token has since pulled back below $0.42, the move still produced Cardano’s first green weekly candle in several months, reinforcing the improving short-term outlook. 

Potential Next Move

While the technical structure supports a strong upside move, execution remains the key uncertainty. The psychological $0.50 level could attract renewed buying interest, while a move above $0.525 may act as the trigger for ADA’s next impulse wave. 

Although XRP’s decisive breakout has provided a clear roadmap, Cardano must still prove it can follow through. 

Positive Start 

Meanwhile, the year has started on a good note for ADA. The recent price spike helped the cryptocurrency record its first golden cross of 2026, a development that has already fueled speculation about further upside.

Moreover, Cardano founder Charles Hoskinson remains bullish on ADA’s outlook this year. He believes the token could replicate some of its strongest historical performances in 2026.

Further, Hoskinson highlighted several upcoming developments, including the launch of Leios, the Midnight mainnet, and continued improvements to Cardano’s DeFi ecosystem. These efforts could further support the token’s growth this year. 

XRP Analysis for Jan 7: Momentum Fades but ETF Clients Keep Stacking, Where Next?

0

XRP could see a pullback as momentum fades, but institutional demand remains strong. Can XRP make a comeback?

As of January 7, XRP is trading at approximately $2.26, reflecting a decline of about 5.4% over the past 24 hours. The price moved down from an intraday high near $2.39 to a low around $2.22 before recovering slightly to stabilize in the $2.25–$2.27 range. Trading volume remains robust at around $7 billion in the last 24 hours, supporting a market cap of roughly $137 billion.

This daily pullback follows a strong recent rally, with XRP posting gains of 20–25% over the past week amid broader altcoin rotation and growing institutional interest. Notable drivers include significant inflows into XRP ETFs. Despite short-term volatility, sentiment remains bullish. 

Where’s XRP Momentum Headed?

Looking at the XRP chart from TradingView, the price has shown strong upward momentum, especially with the recent sharp move above the $2.20 resistance level. This is a key point of interest, as the price is currently testing the $2.40 area, signaling a potential continuation of this bullish trend.

XRP Analysis
XRP Analysis

The RSI indicator, placed at 66.35, is declining from overbought levels, which suggests that the market has already overstretched. The RSI’s position indicates that the market is bullish, but a correction may be in store if bulls do not attack with conviction.

Elsewhere, the RSI Trend indicator, value above 75, is still showing a bullish trend, reinforcing the idea that XRP’s price action is supported by positive momentum. However, as the indicator enters overbought levels, there is a risk that the bullish trend could slow down or experience a short-term reversal if the momentum starts to wane.

XRP Investors Positioning?

Despite signs of exhaustion on the daily chart, the institutional demand for XRP is still exceptionally strong. On January 5, ETF clients purchased $46.1 million in XRP, bringing the total net assets in ETFs to a massive $1.65 billion. 

XRP ETF Flows
XRP ETF Flows

Typically, it means that investors are increasingly positioning themselves in XRP, possibly in anticipation of further price gains. As of January 6, XRP’s ETF market continues to see robust institutional demand, with a daily total net inflow of $9.22 million. This brings the cumulative total net inflow to $1.25 billion.

Crypto Founder Says Next XRP Price Update Is “Going to Blow Your Socks Off”

0

A crypto founder has suggested that XRP could be set for a bigger price surge than most people anticipate.

This comes as XRP’s price momentum builds, attracting media attention after Tuesday’s surge to $2.40.

Notably, the co-founder of Boom, known on X as TheJWKShow, sparked excitement in the XRP community with a short, confident post:

“Next XRP price update is going to blow your socks off.”

The post didn’t provide a specific price or timeline, but gained attention as XRP outperformed the broader crypto market.

XRP Outperforms the Market in Strong Rally

On Tuesday, XRP emerged as one of the top-performing large-cap cryptocurrencies. The token surged nearly 20% in 24 hours, briefly reaching $2.40, levels last seen in November 2025.

On a weekly basis, XRP was up roughly 28%, far exceeding Bitcoin’s gains over the same period. Since the start of the year, XRP has climbed more than 30%, rebounding from December lows near $1.70.

Even after a mild pullback to around $2.25, XRP remains up over 22% year-to-date, reinforcing its position as one of 2026’s strongest performers so far.

Ripple’s Former CTO Adds Humor to the Rally

As traders searched for a catalyst behind the surge, a light-hearted exchange involving Ripple’s former CTO drew attention.

Software engineer Vincent Van Code publicly questioned whether XRP’s rally was driven by news or organic demand, noting that a non-news-based move could indicate a larger breakout. In response, Ripple’s David Schwartz, now CTO Emeritus, jokingly said the pump happened because he retired.

CNBC Calls XRP the Hottest Crypto of the Year

Mainstream attention has followed XRP’s rise. On CNBC, anchor Brian Sullivan called XRP the hottest crypto asset of the year, placing it ahead of both Bitcoin and Ethereum.

CNBC highlighted XRP’s strong start to 2026, noting its rise to the third-largest cryptocurrency by market cap. According to the network, XRP’s rally is being driven by several overlapping factors. Investors quietly accumulated XRP throughout Q4 2025, even while the market remained subdued.

Unlike Bitcoin and Ethereum ETFs, XRP funds saw consistent inflows with no recorded outflows, totaling over $1 billion in net inflows during their early phase. This steady accumulation positioned XRP well for a breakout once market sentiment improved.

Analysts also point to market rotation, with investors seeking less crowded trades that offer higher upside potential. XRP’s speed, low transaction costs, and established role in cross-border payments continue to support its long-term narrative.

Analysts Eye Higher Price Targets

With momentum building, price projections in the XRP community are becoming increasingly bold. Some analysts believe XRP could revisit prior highs near $3.66, while others see $4 as a realistic near-term target. More aggressive forecasts, including calls for $8 XRP, are also circulating.

Ultimately, XRP’s strong price action, institutional interest, and rising media coverage help explain why crypto founders and traders alike believe the next XRP update could indeed “blow your socks off.”

Analyst Presents Ultimate Shiba Inu Target Amid Pump From Weekly Support

0

Shiba Inu has rebounded from major weekly support, and a recent analysis predicts the meme coin could soar to multi-year price highs.

Specifically, analyst MMB Trader shared in his recent TradingView analysis that Shiba Inu has shown incredible strength from a critical demand zone. During the consolidation period in the closing stages of 2025, the token revisited the $0.0000060 support.

For context, SHIB dropped to a low of $0.0000068 on December 31 amid the downtrend that began in October and lasted throughout Q4 2025. However, the analyst noted that price action respected the $0.0000068 support, and the rebound from there established a firm base for a bullish push to higher prices.

Shiba Inu Nears First Target

Notably, MMB Trader called this outcome in an earlier prediction, urging market entry at the weekly support area. Following the recent 32% pump from support to the current price, he has identified the first target to take some profit.

An accompanying chart shows that he expects the meme coin to reach its first target of $0.00001366. From the current market price of $0.0000090, this represents a 51.7% price increase.

Shiba Inu Analsyis/MMB Trader
Shiba Inu Analysis/MMB Trader

Meanwhile, a resistance level between $0.0000104 and $0.0000110 stands between this target and the current price. Breaking above this area would put Shiba Inu on track to reach the first target at $0.00001366.

Interestingly, the market watcher expressed confidence that this would happen, noting that the strength of the rebound from the weekly support suggests the token has the momentum to reach the initial target.

What Next? A Rally to Multi-Month Price Highs

According to MMB Trader, a surge to the first target is not all there is for SHIB. He predicted a sustained growth to higher timeframe resistance levels if buying volumes rise. He further highlighted its importance, stating that an increase in volume suggests strong market participation, which would provide momentum for a prolonged uptrend.

If this happens, the commentator sees SHIB rallying to a multi-month price high of $0.00003364. Reaching this December 2024 price high would entail a 273% uptick from here. Subsequently, he predicted a further rise to $0.4753, representing a 428% increase from the current price.

Ultimately, the analyst projected a 758% rally in Shiba Inu price to a multi-year high of $0.00007730. Notably, the meme coin last traded at this price in October 2021, when it reached its current all-time high of $0.00008854.

XRP Price if the BIS Recognizes XRP as a Tier-1 Asset in the Future

0

The XRP price could see a substantial increase if the Bank for International Settlements (BIS) categorizes it as a tier-1 asset in the future.

Recently, Jake Claver, CEO of Digital Ascension Group, suggested in a post on X that XRP is moving closer to becoming a global bridge currency. He also said the token might one day receive recognition from the Bank for International Settlements as a Tier-1 asset. 

The BIS Tier-1 Classification

Interestingly, his comments came at a time when crypto investors continue to wonder whether a crypto asset can gain the same status as the safest bank capital.

For context, tier-1 assets are the highest-rated assets under the BIS Basel rulebook. Notably, banks rely on them to remain stable during market stress and to prove they can absorb losses. To regulators, they represent the strongest protection available on a bank’s balance sheet.

Tier-1 capital falls under two parts. The first part, Common Equity Tier-1, or CET1, includes common shares, retained earnings, and disclosed reserves. Banks must hold a minimum CET1 level of 4.5% of their risk-weighted assets. 

Meanwhile, additional Tier-1 includes financial instruments like convertible bonds that switch to equity or can be reduced in value if a bank becomes distressed.

Can Crypto Assets Fall Under Tier-1?

Examples of Tier-1 assets include cash reserves held at central banks and government debt from highly rated countries. These include exposures to sovereign debt rated from AAA to AA- or bonds issued by a country in its own currency. Physical gold that a bank stores in its vault or holds in allocated form also falls in this category.

It bears mentioning that crypto assets do not fit the category of Tier-1 assets, as they have a different classification. Specifically, the BIS has introduced formal rules to guide how banks handle crypto assets. Instead of treating them as Tier-1, the BIS placed all cryptocurrencies into two categories. 

Group 1 covers tokenized versions of real assets and certain stablecoins that meet strict backing and redemption rules. Banks may give them similar treatment to the assets they represent, although algorithmic stablecoins do not qualify.

Meanwhile, group 2 contains all unbacked cryptocurrencies such as XRP, Bitcoin, and Ethereum, which face the toughest restrictions. Banks can only hold a small amount of these tokens relative to their Tier-1 capital, usually not more than 1 or 2%. 

XRP Price if It Becomes a Tier-1 Crypto

Amid these limits, many XRP proponents continue to imagine a day when XRP earns a higher classification. Claver’s latest remarks bolstered this optimism and led to new discussion about what might happen if regulators change their approach.

As a result, we turned to Google Gemini AI for an assessment. Gemini noted that a switch from Group 2 treatment to Tier-1 status would completely change how banks interact with XRP. 

Under such a change, banks could treat the asset like cash, gold, or central bank reserves and no longer face strict capital penalties. Gemini estimated that if such a move occurred by 2026, XRP could trade somewhere between $15 and $22.

XRP Price Prediction Google Gemini
XRP Price Prediction | Google Gemini

However, it is important to note that current BIS rules provide no path for XRP or any other unbacked crypto to qualify as a Tier-1 asset. The Basel framework reserves that category for common equity, retained profits, government-backed holdings, and physical gold. Crypto operates under a separate rulebook designed for higher-risk instruments. 

For XRP to receive a better category in the future, global regulators would need to rewrite their framework or recognize stronger real-world usage and proven stability. Until that happens, the Tier-1 status goal remains unreachable.

Dormant Polymarket Trader With a Strong Record on Israel–Iran Strike Bets Returns to Wager on War Again

0

A long-dormant Polymarket trader has resurfaced with a series of wagers tied to the possibility of an Israeli military strike on Iran.

The return has attracted attention not only because of the sensitive geopolitical context, but also due to the trader’s past performance. Consequently, those factors have reignited debate over whether the activity represents informed positioning or speculative betting during an unusually volatile period.

Track Record That Draws Attention

The account, operating under the username ricosuave666, had remained inactive for approximately seven months. However, it recently resumed activity by placing a series of new bets related to Israel and Iran.

According to Polymarket data, the trader has amassed more than $155,000 in total profits. Remarkably, every previous wager linked to Israel has yielded a profit.

That consistency set the account apart. Blockchain analytics firm Lookonchain flagged the renewed activity, highlighting the trader’s historical accuracy and the timing of the bets.

The trader committed a total of $8,198 to Polymarket contracts, anticipating potential Israeli military action against Iran. Moreover, the investments were distributed across two separate future deadlines.

What the Markets Are Pricing In

One contract tracks whether a strike occurs by January 31, 2026, while a second extends the window to March 31, 2026.

As of the latest data, Polymarket assigns a 25% probability to the January outcome. That figure rises to 37% for March. These probabilities help explain why the wagers have drawn broader interest beyond the platform itself.

Rising Tensions Provide the Backdrop

The bets were placed amid escalating strain across the Middle East. Specifically, multiple media reports have pointed to a sharp depreciation of Iran’s currency against the US dollar, intensifying economic pressure inside the country.

That pressure has fueled protests across Iran since late December, with demonstrations persisting and expanding in recent days. The unrest has added further context to the market activity and amplified attention to potential regional flashpoints.

Political Reactions From Both Sides

Israeli Prime Minister Benjamin Netanyahu has publicly voiced his support for the protests, according to The Times of Israel. He also characterized the demonstrations as steadily gaining momentum.

Iranian authorities, in turn, accused Israel of attempting to undermine national unity, rejecting the notion that the unrest is purely domestic. Consequently, the exchange has further heightened already fragile regional relations.

As protests continued, Iran’s National Defense Council issued a warning that preemptive military action could be considered should concrete security threats emerge.

While the statement did not name specific countries, it criticized unnamed adversaries for hostile rhetoric, interference, and alleged violations of international law.

Past Prediction Market Controversies Resurface

The trader’s timing has also revived memories of earlier Polymarket controversies. For instance, in a recent case involving Venezuela, three wallets placed highly profitable bets ahead of major political developments.

Those wallets reportedly earned more than $630,000 by wagering on whether President Nicolás Maduro would leave office shortly before his arrest.

For now, the activity appears to reflect elevated geopolitical risk rather than confirmed foresight.

Cardano Records First Golden Cross of 2026—How Would Its Price React?

0

Cardano has printed its first golden cross of the year, sparking heightened speculation that it will see further price increases from here.

Just days into the year, Cardano has recorded its first golden cross. Notably, this indicator is bullish for the cryptocurrency’s price, as it confirms that positive momentum is predominant and the underlying asset could rally further.

Golden Cross to Propel Cardano Higher?

For the uninitiated, the golden cross occurs when a short-term moving average, usually the 50-period MA, crosses above the long-term 200-period moving average.

Yesterday, the Financial Index highlighted that a golden cross has occurred for Cardano in an X post, leaving enthusiasts optimistic. An accompanying chart shows that it happened on the 2-hour chart on January 4, and ADA has shown upward momentum since then before slowing down in the last 24 hours.

Cardano Golden Cross

Interestingly, a similar cross is forming on a higher timeframe. Specifically, a TradingView analysis shows that the 200- and 50-period MAs are converging on the 4-hour timeframe, suggesting a potential cross if momentum persists.

Notably, some analysts argue that a golden cross is a lagging indicator, confirming the start of a trend rather than pre-announcing a market shift. This suggests the uptrend may have occurred, especially given that the crossover took place on lower timeframes. However, golden crosses on higher timeframes would confirm a stronger bullish momentum.

Would ADA Price React?

Meanwhile, ADA trades at $0.41, down nearly 3% over the past 24 hours. While it has pulled back slightly in the past day, the token has spiked by 16.8% in the last week and an impressive 23.5% since the start of the year.

The daily RSI, at 56.09, shows strong market momentum. Further, it suggests that ADA has more room to expand, as it remains well below the overbought territory of 75 and above. However, trading volume is down 4.4% over the past 24 hours to $859 million, suggesting reduced market trading activities involving ADA.

Cardano RSI and Trading Volume

If sentiment remains positive and broader market conditions remain stable, Cardano could chase higher resistance levels. Recent analysis also backs this sentiment, predicting new all-time highs for ADA this year.

One such outlook comes from xAI’s chatbot Grok, which predicted that ADA would hit $3.5 by the end of 2026. Factors that would fuel this 753% rally include clearer regulations, positive ecosystem developments such as the Midnight mainnet launch and the upcoming Ouroboros Leios upgrade, and a bullish macroeconomic environment.