Home Blog Page 330

Cardano Records First Golden Cross of 2026—How Would Its Price React?

0

Cardano has printed its first golden cross of the year, sparking heightened speculation that it will see further price increases from here.

Just days into the year, Cardano has recorded its first golden cross. Notably, this indicator is bullish for the cryptocurrency’s price, as it confirms that positive momentum is predominant and the underlying asset could rally further.

Golden Cross to Propel Cardano Higher?

For the uninitiated, the golden cross occurs when a short-term moving average, usually the 50-period MA, crosses above the long-term 200-period moving average.

Yesterday, the Financial Index highlighted that a golden cross has occurred for Cardano in an X post, leaving enthusiasts optimistic. An accompanying chart shows that it happened on the 2-hour chart on January 4, and ADA has shown upward momentum since then before slowing down in the last 24 hours.

Cardano Golden Cross

Interestingly, a similar cross is forming on a higher timeframe. Specifically, a TradingView analysis shows that the 200- and 50-period MAs are converging on the 4-hour timeframe, suggesting a potential cross if momentum persists.

Notably, some analysts argue that a golden cross is a lagging indicator, confirming the start of a trend rather than pre-announcing a market shift. This suggests the uptrend may have occurred, especially given that the crossover took place on lower timeframes. However, golden crosses on higher timeframes would confirm a stronger bullish momentum.

Would ADA Price React?

Meanwhile, ADA trades at $0.41, down nearly 3% over the past 24 hours. While it has pulled back slightly in the past day, the token has spiked by 16.8% in the last week and an impressive 23.5% since the start of the year.

The daily RSI, at 56.09, shows strong market momentum. Further, it suggests that ADA has more room to expand, as it remains well below the overbought territory of 75 and above. However, trading volume is down 4.4% over the past 24 hours to $859 million, suggesting reduced market trading activities involving ADA.

Cardano RSI and Trading Volume

If sentiment remains positive and broader market conditions remain stable, Cardano could chase higher resistance levels. Recent analysis also backs this sentiment, predicting new all-time highs for ADA this year.

One such outlook comes from xAI’s chatbot Grok, which predicted that ADA would hit $3.5 by the end of 2026. Factors that would fuel this 753% rally include clearer regulations, positive ecosystem developments such as the Midnight mainnet launch and the upcoming Ouroboros Leios upgrade, and a bullish macroeconomic environment.
Analyst Flags Buy Signal for Shiba Inu, Outlines 3 Take-Profit Targets

0

A recent post from TradingView analyst Pullbacksignal suggests that Shiba Inu may be gearing up for a short-term bullish run that could see the token erase a zero.

The analyst based this outlook on a blend of classical technical indicators and price action signals observed on the 1-hour timeframe. According to Pullbacksignal, SHIB is forming a buy opportunity after undergoing a healthy pullback within an emerging uptrend.

Following a sharp, impulsive move higher, Shiba Inu’s price retraced and then stabilized around $0.0000090. The analyst identified this level as an attractive entry area for traders aiming to position early in anticipation of further upside. 

Trading Signal 

Notably, Pullbacksignal also outlined a well-defined risk-to-reward setup. He advised traders to consider buying SHIB within the $0.00000897 to $0.00000915 range to optimize entries.

To manage profits and risk, the analyst set out three take-profit targets. He placed the first at $0.00001025, with the second and third at $0.00001081 and $0.0000116, respectively. Meanwhile, he positioned the stop-loss at $0.0000087 to help limit downside exposure if the setup fails. 

TradingView analysis on Shiba Inu

Technical Indicators Behind the Setup

Pullbacksignal explained that the setup does not rely on a single indicator but instead draws strength from the confluence of multiple technical indicators, reinforcing its reliability. 

According to the analyst, the indicators under review include the Ichimoku Cloud, Relative Strength Index (RSI), Fibonacci levels, moving averages (MAs), Bollinger Bands, and price action and candlestick patterns.

For example, the chart shows that Shiba Inu has been forming higher lows since its January 5 pullback, a structure that signals growing buyer participation and improving short-term momentum. 

Current SHIB Performance 

Indeed, like most cryptocurrencies, Shiba Inu has participated in the latest relief rally. Notably, SHIB briefly erased a zero on January 5, touching $0.00001. However, it failed to sustain that momentum and corrected almost immediately, sliding back towards $0.000009.

The downturn later extended to around $0.0000089, yet the token continues to trade near the Pullbacksignal-identified favorable entry area.

At its current price of $0.000008982, Shiba Inu has slipped 3.42% over the past 24 hours. However, the token has surged 26.8% over the past week, lifting its year-to-date gain to 30.09%.

From the current price, SHIB must spike by 14.11%, 20.35%, or 29.14% to reach the take-profit targets of $0.00001025, $0.00001081, or $0.0000116, respectively. While these appear attainable, bearish forces could hinder the outcome.

Longtime Bitcoin Investor Says I Outperform All Doubters with My XRP Holdings

0

A veteran Bitcoin investor is once again drawing attention to XRP after reaffirming that the token remains his biggest altcoin position.

Michael XBT, a Bitcoin investor since 2014, disclosed that XRP continues to be his largest altcoin holding. He explained that even through the recent market correction, his publicly disclosed XRP buys have increased nearly tenfold compared to earlier periods.

According to Michael, his early XRP accumulation was widely mocked at the time. However, those purchases ultimately outperformed critics who doubted the asset’s long-term potential.

$150,000 XRP Buy Before the Breakout

Michael revisited a post from September 2022, when he revealed a $150,000 XRP purchase at around $0.33. That disclosure came alongside technical analysis suggesting XRP was breaking out against Bitcoin after forming a long-term macro falling wedge.

In the days that followed, he went on to accumulate thousands more XRP across multiple transactions. 

At the time, XRP sentiment remained weak, with price action still compressed after years of underperformance. Meanwhile, XRP’s price today is vastly different from where it stood when Michael committed $150,000.

Specifically, XRP is now trading around $2.25, up roughly 20% over the past week. The move marks a continued recovery after more than six months of bearish pressure, following a previous cycle peak near $3.66.

Michael believes the recent cooldown has reset market positioning and opened the door for further upside. He believes that the structure favors XRP over the longer term.

Track Record: Bitcoin and XRP Calls That Played Out

Michael is known in crypto circles for accurately identifying major Bitcoin bottoms and long-term XRP setups.

In April 2025, with Bitcoin trading near $82,000 during a market dip, he shared a roadmap projecting a move beyond $100,000. His analysis pointed to a $112,000–$116,000 range, which later materialized before Bitcoin went on to print a new all-time high at $126,200 in 2026. 

In a July tweet, Michael celebrated the target as complete and marked the end of that trade. “Retired. Thanks for playing,” he tweeted.

On XRP, he highlighted a historic setup back in July 2024, pointing to what he described as a rare seven-year bull pennant — something he said he had never seen in his trading career. 

At the time, XRP was trading near $0.58. The breakout followed months later, with XRP surging to around $3 by January 2025.

“Impatience Is the Real Cost”

During XRP’s correction in November 2025, Michael argued that fading confidence was part of a wealth transfer from impatient holders to long-term investors. He noted that XRP had already delivered an 800% move from earlier levels and suggested the pullback was setting the stage for another surprise move.

With XRP now stabilizing above $2 and sentiment slowly rebuilding, his latest conviction suggests a major move may still lie ahead. Among his near-term targets is for XRP to approach the $3 level once again.

MSCI Delays Decision on Classifying Crypto-Heavy Companies in Global Indexes

0

Global index provider MSCI has opted to delay a decision on how to treat companies with large digital-asset holdings in its global equity indexes. 

For now, existing classifications will remain unchanged. The decision follows a detailed consultation that surfaced growing uncertainty around how crypto-heavy balance sheets fit within traditional index frameworks. MSCI said feedback highlighted concerns related to business classification, financial volatility, and the integrity of index construction.

Consultation Centers on Digital Asset Treasury Firms

At the heart of the review were companies often referred to as digital asset treasury firms. Specifically, these businesses allocate a significant share of their balance sheets to cryptocurrencies, most notably Bitcoin.

According to MSCI, institutional investors raised doubts about whether such firms still function as conventional operating companies. Instead, some participants argued that their financial structure increasingly mirrors that of investment vehicles.

This distinction is critical, MSCI noted, because investment-style entities are generally excluded from equity indexes under existing rules.

Questions Over Operating Business Definition

Building on these concerns, MSCI examined whether crypto-focused firms continue to meet its definition of operating businesses. The review evaluated whether exposure to digital assets outweighs revenue-generating commercial activity.

MSCI acknowledged that some of these firms may belong to a broader category of entities primarily driven by investment activity rather than operations. However, the consultation did not produce a definitive conclusion on reclassification.

Consequently, the fundamental question of how to define these companies remains open.

Index Rules to Remain Unchanged Through 2026

Despite the unresolved debate, MSCI confirmed that no changes will be introduced in the upcoming review cycle. The consultation outcome applies to the February 2026 Index Review, the firm said.

Therefore, digital asset treasury companies already included in MSCI indexes will continue to qualify. That eligibility remains conditional on meeting all other existing requirements.

At the same time, MSCI emphasized that the longer-term treatment of such firms is still under consideration.

Immediate Market Response

Unsurprisingly, the decision drew a positive response from Strategy, the first company to adopt a crypto treasury model at scale. The firm said the outcome supports neutral indexing and reflects current economic realities.

In addition, markets reacted quickly. Strategy’s shares rose around 6.9% in after-hours trading, reaching roughly $168.70.

Broader Shift in Corporate Crypto Strategies

MSCI’s review follows a sharp rise in corporate crypto adoption seen across Wall Street last year. During that period, many public companies raised equity or debt to hold crypto in their balance sheets.

What started with Strategy’s fierce Bitcoin purchases soon spread to other firms. Corporate balance sheets increasingly became a channel for institutional exposure to cryptocurrencies.

Early enthusiasm drove some stocks to trade at premiums linked more to token holdings than operating results. Over time, those premiums narrowed as crypto price swings and concerns about sustainability emerged.

Industry Reassessment Continues

As momentum slowed, the market entered a phase of reassessment. Regulators, index providers, and investors are now weighing whether the crypto treasury model represents a durable corporate strategy.

Meanwhile, others see it as a response to specific market conditions rather than a permanent shift. MSCI’s consultation reflects this ongoing debate without, however, resolving it.

For now, the index provider’s decision offers stability, while deferring consideration of future classification questions.

Is the New XRP Rally a Real Trend Reversal or a Short Bounce?

0

Amid the recent XRP recovery push, market participants have continued to question if this is finally the start of a trend reversal or a brief relief rally.

Notably, XRP opened 2026 with bullish momentum after a rough end to last year. Following the 35% crash in Q4 2025, the crypto asset has bounced sharply in early January 2026. The recovery has already lifted XRP by nearly 30%, pushing it back above $2, with the broader market also rebounding considerably.

However, the upsurge has led to questions. For instance, some traders believe XRP may finally be turning bullish. Others think this push resembles a relief rally within a larger downtrend. Amid these questions, market analyst Blockchain Backer shared why he believes investors should be cautious.

Long-Term Charts Show Warning Signs Instead of Strength

The analyst first considered XRP’s weekly and monthly charts, which he says are important for understanding the trend. Notably, on the weekly timeframe, XRP formed a bearish divergence that pushed the MACD to new lows.

The price stayed stable overall, but this stability came with noticeable weakness compared to May, June, and July 2025. However, with the latest upward push, weekly data shows the MACD curling upward again, and the Stochastic RSI turning higher as well.

XRP 1W Chart Blockchain Backer
XRP 1W Chart | Blockchain Backer

Meanwhile, on the monthly chart, the conditions look more troubling. Notably, the MACD recently crossed lower in a pattern similar to February 2022, a period that led to deeper losses. The monthly RSI also fell sharply, landing below last summer’s levels. In addition, the monthly Stochastic RSI continues to point down.

XRP 1M Chart Blockchain Backer
XRP 1M Chart | Blockchain Backer

As both weekly and monthly indicators enter levels from past periods when XRP faced breakdowns, Blockchain Backer believes traders should stay cautious instead of celebrating too early.

The analyst noted that this current situation resembles a pattern he has tracked for years. For context, the pattern typically involves a rally that appears right before capitulation. 

He highlighted how the crypto market behaved the same way in May 2021, when the altcoin market hit a 4.236 Fibonacci extension, Bitcoin retraced to 0.702, and hype peaked during a high-profile weekend. This moment marked the top, not the start of a new run.

XRP Price Action Still Resembles a Market Near Capitulation

Speaking further, Blockchain Backer compared the current XRP structure to examples like Hedera Hashgraph (HBAR) and Cardano (ADA), both of which climbed temporarily before breaking lower again.

While the behavior is similar, the question now is how high the current rally could go before the pullback emerges. He believes XRP might rally toward $2.27 to $2.30, though this remains uncertain. In addition, Bitcoin could stretch toward levels that mirror $2.50 on XRP’s chart if history repeats. 

The analyst noted that XRP invalidated a clean ABC corrective pattern when it fell below $1.82 on Dec. 18, and this led to more uncertainty about how high this rally can rise. Because of that break, he expects this may be the final rally that requires heavy caution before market conditions improve later in 2026.

A Possible Drop Ahead Before a Healthier Market Emerges

Essentially, he believes the charts point toward a capitulation event, though he cannot predict exact levels. He mentioned that XRP might fall near $1.60, or possibly lower, but stressed that nothing guarantees a drop to a specific price. 

Blockchain Backer also warned that relief rallies often draw investors back in at the wrong moment. Notably, green candles lead to optimism, and many assume the bull market has returned. If the rally fades, those same traders could face the burn as price reverses again.

However, his outlook could change only if XRP breaks convincingly above $3.20 to $3.30. Until then, he confirmed plans to watch for signs of exhaustion. If capitulation finally arrives, he believes the market will reset and create room for a stronger recovery later in 2026. 

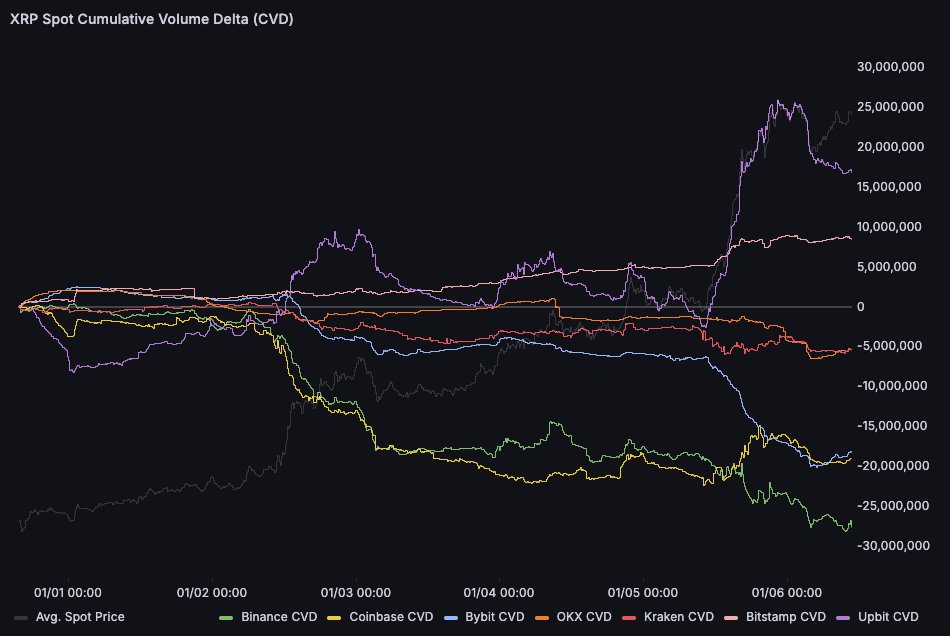
Shortly after his analysis, XRP soared to $2.41 but has since pulled back slightly to the current price of $2.25, with the upward momentum slowing down. Interestingly, Dom, another analyst, also argued that the latest rally did not come from aggressive spot buying.

XRP CVD Dom
XRP CVD | Dom

CNBC Names XRP Hottest Cryptocurrency of the Year

0

During CNBC’s Power Lunch segment, the network singled out XRP as the hottest cryptocurrency of the year, placing it ahead of Bitcoin and Ethereum.

Specifically, CNBC anchor Brian Sullivan highlighted XRP’s strong start to the year, noting that it has already climbed more than 20%. This move outperforms several major cryptocurrencies, including Bitcoin and Ethereum.

Sullivan explained that XRP has moved up to become the third-largest cryptocurrency by market cap. Amid this, he declared that the hottest crypto trade of the year is neither Bitcoin nor Ethereum, but XRP.

XRP Outperforms Bitcoin and Ethereum

Notably, XRP’s rise marks a sharp reversal from the bearish pressure it faced last month. Entering 2026 with strong momentum, the token opened the year at $1.84 and quickly posted consistent gains. This upward trend pushed XRP to a year-to-date high of $2.41, representing a 30.97% surge.

By comparison, Bitcoin and Ethereum started the year at $87,508 and $2,967, respectively, and have so far reached highs of $94,762 and $3,303. These moves translate to gains of 8.28% for Bitcoin and 11.32% for Ethereum. The disparity reinforces XRP’s position as the standout performer so far this year among large-cap assets.

Meanwhile, XRP has surrendered some gains amid the market pullback and now trades at $2.25. Yet, it remains up 22.28% year-to-date.

Factors Fueling XRP Rally

Commenting on the rally, CNBC’s MacKenzie Sigalos attributed XRP’s strong performance to a mix of strategic investor positioning, market rotation, and shifting blockchain priorities.

According to Sigalos, investors quietly accumulated XRP throughout Q4 2025, even as the crypto market remained largely stagnant. Unlike spot Bitcoin and Ethereum ETFs, whose inflows and outflows often mirror price movements, XRP ETFs continued to attract buyers during the downturn. As a result, these funds recorded cumulative net inflows of $1 billion, with zero outflows, in the first month of going live.

Moreover, Sigalos suggested that many investors viewed XRP as a less crowded trade with greater upside potential than Bitcoin or Ethereum. That strategy, she noted, quickly paid off in the first days of January.

Beyond positioning, she also pointed to a shift in investor interest toward altcoins with clearer or faster-growing use cases. While Bitcoin and Ethereum are now well understood and increasingly mainstream, XRP and Solana are emerging as the “next big thing” in the crypto market.

In particular, Sigalos emphasized that XRP’s long-standing role in cross-border payments remains central to its appeal.

Further, she highlighted XRP’s speed and cost efficiency as key advantages that continue to attract real-world financial applications. In her view, these factors suggest that capital is rotating toward assets and blockchains positioned for the next phase of financial innovation—a shift now reflected in XRP’s impressive start to the year.

XRP Price if Ripple Becomes a Fully Regulated and Operational National Bank

0

Ripple’s plan to become a fully regulated national bank has reached an advanced stage, leading to discussions about how it could impact the XRP price. 

Recently, market analyst Chart Nerd highlighted regulatory documents on Ripple’s national bank charter application. For context, the documents build on a process that began in July 2025 and is now close to completion.

Notably, the paperwork ties to Ripple’s original filing from mid-2025, which received conditional approval in December 2025. According to him, Ripple’s move toward operating as a federally regulated national trust bank now stands on firm ground. To him, the opposition no longer has the power to derail the process.

Details of Ripple’s Filing

Specifically, the documents show that Ripple chose a national bank charter rather than a state-level license. This decision puts the company under federal oversight and allows it to operate under a single set of rules across the United States, instead of dealing with different state regulations.

Moreover, the proposed bank appears in the application as Ripple National Trust Bank. Ripple selected a trust designation under the “Special Focus” section, indicating it would focus on custody, asset protection, and fiduciary services. 

Ripple Bank Charter Application

The filing also lists the bank as a Federal Reserve member institution. For the uninitiated, this status would allow Ripple’s bank to access Federal Reserve services and connect directly to the U.S. financial system. The proposed address for Ripple National Trust Bank is 111–119 West 19th Street, Floor 6, New York, New York. 

With conditional approval already granted in December 2025, market pundits have begun assessing how the completion of the process could impact the XRP price. Notably, XRP currently trades at $2.38 amid a recovery push that started at the start of the new year.

However, while most analysts expect Ripple’s bank launch to influence XRP’s value, the scale of that impact remains unclear. To assess this, we asked Google Gemini to assess potential price outcomes once Ripple completes the bank charter process.

XRP Price 1 Year After Ripple Launches Its National Bank

In response, Gemini pointed out that Ripple intends to use the bank mainly to manage reserves for its RLUSD stablecoin and to provide custody services for institutional clients. It stressed that markets often view a national bank charter as a strong regulatory endorsement.

According to Gemini, the positive case for XRP depends on real utility rather than hype. Notably, a federally regulated Ripple bank could make it easier for other financial institutions to use XRP for liquidity. This could expand XRP’s utility in institutional settlements.

Considering this, Gemini presented a hypothetical scenario one year after the bank becomes fully operational. In this case, increased institutional use and steady demand against a fixed supply could lead to higher prices. Based on utility-driven models, Gemini suggested a possible XRP price range of $10 to $15 by January 2027.

XRP Price Prediction from Google Gemini

Notably, reaching $10 would mean roughly a fourfold increase from current levels and place XRP’s market value near $600 billion. Gemini noted that much higher price targets would require XRP to replace a large share of global banking liquidity, a shift that would likely take far longer to achieve.

China’s Central Bank Tightens Crypto Rules, Expands Digital Yuan in 2026

0

China’s central bank is tightening oversight of crypto assets while upgrading its digital yuan system starting this month. 

This is part of a bigger plan to make payments safer, modernize the financial system, and limit risks from cryptocurrencies and other private digital money.

Lu Lei, Vice Governor of the People’s Bank of China (PBOC), said the country wants to encourage digital finance while keeping strict rules to protect the economy.

Digital Yuan Enters a New Phase in 2026

Notably, the plan focuses on a new version of the digital yuan, or e-CNY, supported by the central bank’s Action Plan, which is based on over ten years of research and testing.

The digital yuan will change from “digital cash” to “digital deposit money,” meaning it will work more like money in a bank account instead of like cash or cryptocurrency.

As of November 2025, the digital yuan had handled 3.48 billion transactions worth about 16.7 trillion RMB. Over 230 million people and nearly 19 million companies have opened digital yuan wallets, showing it is becoming widely used in China.

Clear Contrast With Crypto Assets

Meanwhile, Chinese officials once again drew a line between state-backed digital currency and cryptocurrencies. The central bank said crypto and stablecoins have helped digital payments grow worldwide, but they also bring risks, like bypassing banks, encouraging shadow banking, and making it harder to control the money supply.

They warned that unregulated digital payment tools can create a separate financial system outside government rules, which makes the economy riskier. This is why China keeps strict rules on crypto while supporting its own digital currency.

Two-Tier System Keeps Banks at the Core

Notably, China will keep running the digital yuan with a two-tier system: the central bank manages the overall system, while commercial banks handle user wallets and payments. Money in digital yuan wallets at banks will count like bank deposits and be part of reserve requirements.

Commercial banks will make sure the system is secure and follows anti-money-laundering rules. Non-bank payment companies must keep full reserves for any digital yuan they handle.

Blockchain, But Not Full Decentralization

Even though China is careful about decentralization, the digital yuan will use a hybrid system that combines regular bank accounts with blockchain technology. This allows the e-CNY to support features such as smart contracts, offline payments, and programmable capabilities, while keeping the government in control.

Officials say this system makes payments cheaper and faster, keeps transactions traceable, and follows the rules. Blockchain will be used mainly in areas like supply chains, public services, and cross-border payments.

Cross-Border Push Gains Momentum

The PBOC also plans to expand the digital yuan for international use. China’s work on the mBridge project has already handled over 4,000 cross-border transactions, with the digital yuan making up more than 95% of the volume. 

An international operation center will open in Shanghai to make cross-border payments cheaper, faster, and easier for trade.

To manage risks, China will create new governance groups, including a Digital RMB Management Committee and special operation centers for domestic and international use. They will use advanced tools such as AI and blockchain to monitor for problems in real time.

The central bank said stability comes first, and innovation will only happen under tight control. China’s plan is essentially to limit private cryptocurrencies while growing its own state-controlled digital currency that works at home and abroad. 

Ultimately, in 2026, the digital yuan is set to play a bigger role in payments, finance, and international trade, all under strict oversight.

Here Are Top XRP Price Targets by Flipping the 1-Month XRP Chart Upside Down

0

A market analyst has revealed that the XRP inverted chart points to an imminent crash, but things take a bullish turn when you flip the chart upside down.

This commentary came from EGRAG Crypto, a well-known market watcher, amid XRP’s latest rebound effort, which has seen the crypto asset recover the $2 psychological mark. Specifically, XRP has gained nearly 30% over the past six days of 2026, now changing hands at $2.37.

However, EGRAG believes XRP still has more room for further growth. Interestingly, in his latest analysis, he employed an unusual approach by looking at XRP’s 1-month chart from an inverted point of view. According to him, this inverted chart suggests that XRP could be heading for a price crash.

Nonetheless, when viewed correctly by turning it upside down, EGRAG pointed out that the chart indicates something more “powerful.” 

The XRP Inverted Chart

For context, data from the inverted chart shows that whenever XRP breaks a crucial “support” level, what follows is a massive crash. This trend, which played out in 2017, led to EGRAG’s suggestion of an imminent crash.

However, when he flips the chart upside-down, the real story emerges. Specifically, the analyst’s suggestion of a break below support actually entails a break above resistance. In truth, the pattern indicates that whenever XRP breaks above a stubborn resistance mark, the next move is a powerful upsurge.

XRP Inverted 1M Chart EGRAG Crypto
XRP Inverted 1M Chart | EGRAG Crypto

For instance, in Q4 2014, the XRP price engineered an impressive rally from November of that year, but met resistance at the stubborn roadblock around $0.028 by December 2014. This capped the upside momentum and led to a retracement that pushed XRP to a low of $0.00414 by November 2015.

However, after XRP retested the $0.028 resistance in 2017, it broke above it in April 2017, and this gave way to an explosive run, which met another resistance at $0.25 from Q2 to Q4 2017. 

When XRP breached this second resistance in December 2017, its price soared to the $3.31 peak in January 2018. Data from EGRAG’s chart indicates that the $3.31 peak represented an over 7,000% increase from the first roadblock at $0.028. Meanwhile, it marked a 1,200% rise from the second resistance at $0.25.

XRP Price Targets After $2 Breach

Most recently, XRP faced another stubborn resistance at the $2 price mark. Notably, this $2 level acted as an important point of interest throughout 2025, with XRP occasionally pushing above it and also dropping below it. In Q4 2025, XRP decisively collapsed below $2. However, the tables have turned in 2026, and EGRAG believes another explosive surge could emerge.

According to his chart, XRP has two possible targets beyond this $2 region. Specifically, the first target sits at $27, which represents a 1,200% increase from $2. Meanwhile, the second target stands at a massive $150 price, which would replicate the 7,000% rise in 2017. 

Notably, EGRAG suggested that the base case rally from this resistance would push XRP to a range of $24 to $30. He believes this scenario has a 60-65% probability of playing out in the next 6 to 18 months. Meanwhile, the extension target ranges from $80 to $150, which has a 20-25% probability of playing out.

Morgan Stanley Files SEC Paperwork for Bitcoin and Solana ETFs

0

Morgan Stanley has formally submitted registration documents to the U.S. SEC to launch two cryptocurrency exchange-traded funds. 

The filings, made public Tuesday, cover funds tied to Bitcoin and Solana, marking a significant expansion of the firm’s crypto offerings.

Regulatory Filings Outline Two Distinct Crypto Products

According to SEC disclosures, Morgan Stanley filed separate S-1 forms for a Bitcoin Trust and a Solana Trust. Notably, the Solana fund stands out for including a staking feature, which sets it apart from standard spot ETFs.

The filings position Morgan Stanley alongside established crypto ETF issuers such as BlackRock and Fidelity. The move would heighten competition in the expanding market for regulated digital asset products.

Notably, in January 2024, the U.S. SEC approved spot Bitcoin ETFs, opening the door to institutional and retail participation. Since that decision, trading activity has accelerated sharply.

In fact, cumulative trading volume across U.S. spot crypto ETFs has now surpassed $2 trillion. While it took more than a year for the market to reach its first trillion dollars in volume, the second trillion was added in roughly eight months.

Bitcoin ETF Holdings Grow Despite Price Consolidation

Rising activity has been accompanied by steady growth in assets held by spot Bitcoin ETFs. Total holdings now exceed $123.5 billion, accounting for approximately 6.6% of Bitcoin’s total market capitalization.

Notably, this growth has continued even as Bitcoin’s price has struggled to reclaim the $100,000 level in recent sessions. This divergence highlights sustained ETF demand despite a period of price consolidation in the underlying asset.

Policy Changes Accelerate Product Launch Timelines

Meanwhile, the regulatory environment has also become more accommodating. Following President Donald Trump’s return to office, the SEC has adopted a more flexible stance toward crypto investment products.

In September 2025, the agency approved new generic listing standards for cryptocurrency exchange-traded products. Under the updated framework, qualifying funds can launch without filing individual rule-change requests, a process that previously could delay approvals by up to 240 days.

ETF Filings Build on Morgan Stanley’s Crypto Expansion

Morgan Stanley’s ETF applications reflect a broader digital asset strategy already underway at the firm. For context, last year, it introduced a 4% allocation cap for portfolios designated as “opportunistic,” aligning its guidance with that of industry peers.

The wealth manager has also expanded crypto access across its client base, including within retirement accounts. Taken together, the Bitcoin and Solana ETF filings signal Morgan Stanley’s readiness to meet clients’ ongoing demand for regulated cryptocurrency exposure.