Home Blog Page 332

Ripple Exec Explains Why XRP Price Is Pumping Hard Today

0

XRP has emerged as one of the strongest performers in the crypto market today, posting the largest 24-hour gain among the top ten cryptocurrencies. 

As traders search for a catalyst behind the sudden surge, Ripple’s former CTO has joined the conversation with light-hearted remarks.

XRP Outperforms the Market as Prices Surge

Today, XRP price touched the $2.40 region following a roughly 20% surge in the last 24 hours. The last time XRP traded at this level was in November 2025.

With this impressive rebound, XRP’s weekly gains improved by about 28%, significantly outpacing Bitcoin’s 7% advance over the same period.

Since the start of the year, XRP has climbed more than 30%, rebounding from December lows of $1.70. The token began the year near $1.84 and has since pushed as high as $2.41.

What’s Pumping XRP? David Schwartz Explains

As XRP accelerated, software engineer Vincent Van Code took to X to ask what was driving the move. He questioned whether the rally was news-driven or truly organic, noting that a non-news-based surge could signal a larger breakout phase for XRP.

Former Ripple CTO David Schwartz, now serving as CTO Emeritus, responded with humor. He jokingly suggested the XRP pump happened because he retired. Meanwhile, he added that cutting his hair might be his next market-moving move.

Van Code replied in the same playful tone, joking that perhaps Schwartz retired because he already knew XRP was about to surge. He later clarified that the exchange was all in good fun.

Schwartz’s Transition at Ripple

Back in October, Schwartz announced he would step down from his day-to-day role at Ripple after more than 13 years with the company. He reflected on his long career in blockchain, including co-creating the XRP Ledger and helping define Ripple’s technical direction.

While retiring from daily responsibilities, Schwartz noted he is not leaving XRP behind. He transitioned into Ripple’s Board of Directors as CTO Emeritus and will be working on XRP-based initiatives.

He has also expressed interest in returning to hands-on development, exploring new XRPL use cases, experimenting with code, and potentially launching new projects beyond Ripple’s current focus.

What Comes Next for XRP

With XRP now outperforming much of the market, traders are projecting a price rally to its all-time high. For instance, community figure Zach Rector has said XRP is on track to repeat its July 2025 run, which saw its price reach $3.66.

At the same time, prominent crypto podcaster Mario Nawfal argued that $4 is a realistic target for XRP. Others, like Charting Guy, are even calling for an $8 XRP, a nearly 4x price increase from current levels.
Big Price Move Could Be Coming as Here’s What XRP Is About to Break Against BTC for the First Time Since 2018

0

Market analyst Matt Hughes has called the public’s attention to a potential XRP move that could lead the altcoin to outperform Bitcoin.

Specifically, he believes XRP is close to breaking above the monthly Ichimoku Cloud against Bitcoin, a level it has not reclaimed since 2018. Notably, a confirmed move above this level would indicate a potential bullish change in XRP’s long-term performance against BTC.

Currently, the XRP/BTC pair trades at 0.00002501. At this level, the price sits directly beneath the Ichimoku Cloud, which has acted as strong resistance for nearly eight years. Hughes argues that crossing this barrier would open the door for XRP to outperform Bitcoin over a longer period.

Data from his chart confirms why analysts regard this level as extremely important. Notably, the XRP price traded without a clear trend against BTC from 2015 to 2016. During this time, it continued to move below the Ichimoku Cloud. 

Last Time XRP Broke Above the Ichimoku Cloud

However, this phase ended in early 2017 when XRP broke decisively above the cloud. The breakout triggered a sharp rally that pushed the pair from around 0.00002 BTC to a peak of 0.00023 BTC in January, as XRP claimed $3.31. During this run, XRP stayed well above the cloud, outperforming Bitcoin.

Nonetheless, the trend reversed after the 2018 peak. Specifically, XRP/BTC fell back into the cloud and then dropped below it, confirming a long-term change in momentum. 

From 2018 through 2020, the pair declined from above 0.0002 BTC to 0.0000065 BTC. The Ichimoku Cloud turned bearish, and each recovery attempt failed below major resistance levels, leaving Bitcoin in control.

Image

Between 2021 and 2023, XRP/BTC moved sideways but remained below the cloud. The price mostly ranged between 0.000006 and 0.00003 BTC. Even during the 2021 bull market, XRP failed to reclaim the cloud, confirming its continued underperformance against Bitcoin, especially amid the SEC lawsuit.

Conditions began to improve in the second half of 2024 after a sustained crash from August 2023 to June 2024. Following the November 2024 spike, the XRP/BTC pair formed higher lows, while the Ichimoku Cloud began flattening. Specifically, price started pressing into the cloud instead of pulling away from it, indicating fading downside pressure.

XRP Now Eyeing Ichimoku Cloud Breakout Against Bitcoin

While the trend shift carried into late 2025, the bearish market conditions from Q4 2025 halted XRP’s campaign. Now, as XRP posts a 27% rise in 2026, outperforming the broader market, the XRP/BTC pair now trades at the lower edge of the monthly Ichimoku Cloud near 0.000025 BTC. 

Notably, the cloud structure looks weaker than it has in years, which Hughes says closely mirrors the setup seen before the 2017 breakout. Hughes believes a monthly close above the Ichimoku Cloud would confirm a major trend change and end a seven-year period of XRP underperformance. 

For context, such a move would not necessarily require Bitcoin to fall, but it would suggest that XRP could begin rising faster than BTC. If XRP reclaimed the 2018 peak of 0.00023 BTC with Bitcoin trading for $93,000 today, XRP’s price could hit $21.39. However, John Bollinger believes XRP’s trend within the Bollinger Bands is weaker than Bitcoin’s.

Bitcoin Nears $95K as Market Adds $250 Billion in 2026

0

The cryptocurrency market entered 2026 with strong momentum that has lifted the total market value above $3.2 trillion.

Bitcoin led the advance, climbing past $94,000 and setting the tone for gains across the broader digital asset space.

Global Crypto Market Gains Momentum

At the beginning of the year, the total cryptocurrency market was at roughly $2.96 trillion. Since then, it has expanded by about 7.7%, thus adding nearly $250 billion in capitalization.

Over the past 24 hours, the market has grown by approximately 1.5%. This pushed total crypto capitalization to $3.20 trillion, according to CoinMarketCap data, reinforcing renewed interest in large-cap assets.

Bitcoin Breaks Higher as Sentiment Improves

Bitcoin spearheaded the move higher during Tuesday’s trading session, breaking above the $94,500 level and drawing strong buying interest.

At the time of writing, Bitcoin was trading near $93,332. The asset posted a daily gain of roughly 0.79% and has risen more than 6% over the past week.

This advance followed a broad reset in leveraged positions, while escalating global tensions appeared to boost demand for perceived alternative assets.

Bitcoin and crypto performance

Major Altcoins Follow Bitcoin’s Lead

Bitcoin’s strength spilled over into the broader market, lifting major altcoins. Ethereum gained around 1.5% to trade near $3,214 and is up approximately 8% over the past week.

Similarly, Solana also advanced about 1.4% on the day, thereby bringing its weekly gains to more than 10% as risk appetite widened.

Notably, XRP stood out among large-cap tokens, surging roughly 9% in a single session. Over the past seven days, the token has gained nearly 26%, trading around $2.33.

Liquidation Wave Clears Derivatives Markets

Behind the price action, derivatives markets experienced a sharp shakeout. A wave of liquidations eliminated heavily crowded positions, particularly among bearish traders.

Data from CoinGlass shows that $418.62 million in futures positions were liquidated over the past 24 hours. Of this total, short positions accounted for $330.16 million, while long liquidations reached $88.46 million.

Global Crypto Market Liquidations

This imbalance indicates that many traders were positioned against higher prices. Consequently, as markets rose, forced buybacks amplified the rally.

Venezuela Developments Add to Market Volatility

Geopolitical developments added another layer of uncertainty to the market backdrop. Recent U.S. operations targeting Venezuela’s leadership coincided with heightened volatility across global financial markets.

Specifically, U.S. forces captured Venezuelan President Nicolás Maduro over the weekend. Both Maduro and First Lady Cilia Flores were detained at their residence and later transported to the United States.

Subsequently, both have been charged in New York with weapons- and drug-related offenses. Meanwhile, U.S. President Donald Trump stated that the United States would oversee Venezuela during a transitional period.

Speculation Grows Over Venezuela’s Crypto Holdings

Following news of Maduro’s detention, market attention shifted to Venezuela’s potential cryptocurrency holdings. Bitcoin, in particular, became central to renewed speculation.

An investigative report published by The Whale Hunt claimed Venezuela may hold a large, undisclosed Bitcoin reserve valued between $60 billion and $67 billion.

However, publicly available data tells a very different story. BitcoinTreasuries lists Venezuela’s known holdings at just 240 BTC, worth approximately $23 million. Therefore, the stark discrepancy between the figures fueled further debate across the crypto community.

Seizure Risk Seen as a Narrative Shift for Bitcoin

Discussion then turned to the possibility of U.S. authorities seizing Venezuelan digital assets. During a CNBC appearance, journalist MacKenzie Sigalos addressed the issue, suggesting that such an outcome could reshape Bitcoin’s narrative.

She noted that even the prospect of state-held Bitcoin being seized could strengthen the asset’s appeal, reinforcing its role as a hedge during periods of political instability.

Market Pundit Predicts Realistic XRP Number for 2026

0

A popular market commentator has outlined what he described as realistic price targets for XRP and other major cryptocurrencies.

As the broader crypto market rebounds from December lows, prices have continued to trend higher. XRP, for instance, has rebounded significantly, rising from $1.84, where it began trading this year, to $2.41.

Amid this rally, prominent market pundit Mario Nawfal shared his XRP price prediction. It also included his expectations for other leading digital assets, emphasizing that the projections are achievable targets.

XRP to $4–a Realistic Target

In a post on X, Nawfal set a ‘realistic target’ price of $4 for XRP. At the same time, he highlighted similar outlooks for other major cryptocurrencies, suggesting that Bitcoin could climb to $145,000, Ethereum to $7,000, and Solana to $500.

For context, XRP traded near $4 during the 2018 bull cycle, when it reached an all-time high of $3.84. It also moved close to reclaiming that zone in July 2025, but momentum faded after XRP climbed to $3.65, triggering a sharp pullback.

However, XRP has since reignited its upward momentum this year, leading market commentator Mario Nawfal to describe $4 as an achievable target.

At its current price of $2.39, XRP would need to rally by roughly 67% to reach that level. Such a move would mark a new all-time high, lifting XRP’s market cap to approximately $242.7 billion.

Notably, Nawfal posed the question to his audience, asking whether the $4 target is realistic. Considering XRP requires only a 70% price rally to get there, that magnitude of growth appears well within XRP’s capabilities, especially considering its historical context.

For example, in December 2024, the token surged by more than 400%. Therefore, a 70% advance appears modest when compared to XRP’s past performances. Meanwhile, the coin faces strong resistance zones in the $3 region, which could delay the journey.

What Other Analysts Think

Nawfal’s commentary aligns with broader sentiment across the XRP community. Some pundits like Zach Rector argue that the token could replicate its June–July performance, when it climbed to $3.65.

At the same time, Nawfal’s projection has triggered mixed reactions among market commentators. One commentator agreed that Bitcoin, Ethereum, and Solana could reach the targets Nawfal outlined, but expressed skepticism about XRP’s ability to surge to $4. The comment cites concerns about its volatility.

XRP Emerges as Best Performer Among Top 10 Cryptos

At press time, XRP is already outperforming its peers in the short term. Among the top ten cryptocurrencies by market cap, it ranks as the best performer over the past 24 hours.

Data from CoinMarketCap shows that XRP has gained 12.48% in one day, significantly ahead of Cardano — the second-best performer, which rose just 5.56% over the same period. This surge has also pushed XRP’s seven-day gain to 27.81%.

While XRP is currently benefiting from a broader market relief rally, investors remain optimistic that the momentum can extend further. That confidence is being fueled by continued accumulation, as more XRP exits the open market through ETF products and treasury acquisitions, potentially tightening supply and supporting higher prices.

TD Cowen Warns Crypto Market Structure Bill Could Take Until 2027 to Pass

0

U.S. efforts to establish clear rules for crypto markets may take far longer than policymakers and industry participants once expected.

New analysis suggests passage could slip to 2027, with enforcement delayed until as late as 2029.

That outlook comes from TD Cowen’s Washington Research Group, which closely tracks congressional policymaking. According to the firm, the primary obstacle is no longer technical readiness or drafting complexity, but rather political strategy.

Political Incentives Are Reshaping the Timeline

Although lawmakers still have a theoretical path to pass crypto market structure legislation this year, TD Cowen sees limited motivation to move quickly. Specifically, political calculations, particularly among Democrats, appear to favor delay.

TD Cowen Managing Director Jaret Seiberg said Democrats may prefer to wait. This is especially true if they believe the 2026 midterm elections could return control of the House to their party. In that case, postponement may offer greater leverage over both the substance and timing of enforcement.

Importantly, the slowdown is not due to a lack of preparation. Seiberg noted that congressional staff from both parties have spent months developing detailed legislative language. Consequently, that groundwork means the bill could move quickly if political incentives change.

Why a Later Deal May Be Easier

TD Cowen argues that delaying enactment could ease several contentious issues. One scenario envisions passage in 2027, followed by implementation in 2029.

Such a timeline would push enforcement beyond the next presidential inauguration, reducing the immediate political stakes tied to election outcomes. In theory, this could make compromise more achievable.

However, that approach would require trade-offs. Crypto firms would need to tolerate prolonged regulatory uncertainty, while Democrats would likely need to narrow or soften certain restrictions to secure agreement.

Conflict-of-Interest Rules Drive the Dispute

At the center of negotiations is a dispute over conflict-of-interest provisions. Specifically, Democrats are expected to insist on rules limiting cryptocurrency ownership or business involvement by senior government officials and their families.

According to Seiberg, President Donald Trump would fall squarely within the scope of such provisions. Consequently, TD Cowen said this language would likely face strong resistance from Trump unless enforcement were delayed.

Trump’s Crypto Links Add Complexity

Trump’s personal and family ties to crypto have intensified the debate. Bloomberg estimated last July that Trump-linked crypto ventures have generated roughly $620 million.

These include World Liberty Financial, a DeFi and stablecoin project that lists Trump and his three sons as co-founders. The family also holds a stake in Bitcoin miner American Bitcoin, and lawmakers have raised concerns about the TRUMP and MELANIA memecoins launched before Trump took office.

To break the impasse, Seiberg outlined a potential compromise: conflict-of-interest provisions could take effect three years after the bill becomes law.

Therefore, that delay would push enforcement past the next inauguration, effectively placing Trump beyond its reach. However, TD Cowen cautioned that Democrats would likely insist on a broader delay, pushing back the entire bill’s implementation timeline as well.

Where the Legislation Stands Now

The crypto market structure bill aims to define how digital assets are regulated in the United States, including the authority of regulatory agencies and the classification of digital assets. Moreover, it is widely viewed as the next major step after the GENIUS Act, which addressed stablecoins and included a three-year rollout period.

The House passed its version of the market structure bill last year. However, since then, momentum has slowed in the Senate. The bill faces a steep procedural hurdle: overcoming a filibuster would require 60 votes. Even with unanimous Republican support, at least seven Democrats would be needed—and TD Cowen said the actual number could be higher.

Some Republicans are also expected to oppose the bill, giving Democrats additional leverage to delay consideration.

Industry Priorities Clash With Political Strategy

The crypto industry would prefer the legislation to take effect during a Trump presidency and has shown little concern about conflict-of-interest restrictions. By contrast, Democrats may favor a later implementation that allows regulators aligned with their party to shape enforcement if a Democrat wins the White House.

Seiberg said this disconnect helps explain why negotiations remain difficult. While some policy experts have recently estimated a 50% to 60% chance that the bill would become law in 2026, TD Cowen’s analysis suggests even longer delays remain plausible.

Ultimately, the fate of U.S. crypto market rules hinges less on legislative readiness and more on political timing.

Legendary Trader Peter Brandt Shares Cryptic XRP Price Analysis

0

Peter Brandt, a long-standing top market analyst, recently shared a cryptic XRP price analysis amid heightened optimism over the recent rally.

Notably, CoinMarketCap data shows that, except for SUI, XRP has outperformed all other cryptocurrencies in the top 50 by market cap. The red-hot coin has soared by over 11% in the past 24 hours, bringing its year-to-date increase to 29%.

Brandt Shares Bubble-Bursting Analysis

However, the legendary trader, Brandt, has remained conservative in his outlook on XRP. Despite the exciting price action, he shared a bubble-bursting chart in his Monday tweet, with a cryptic “without comment” note.

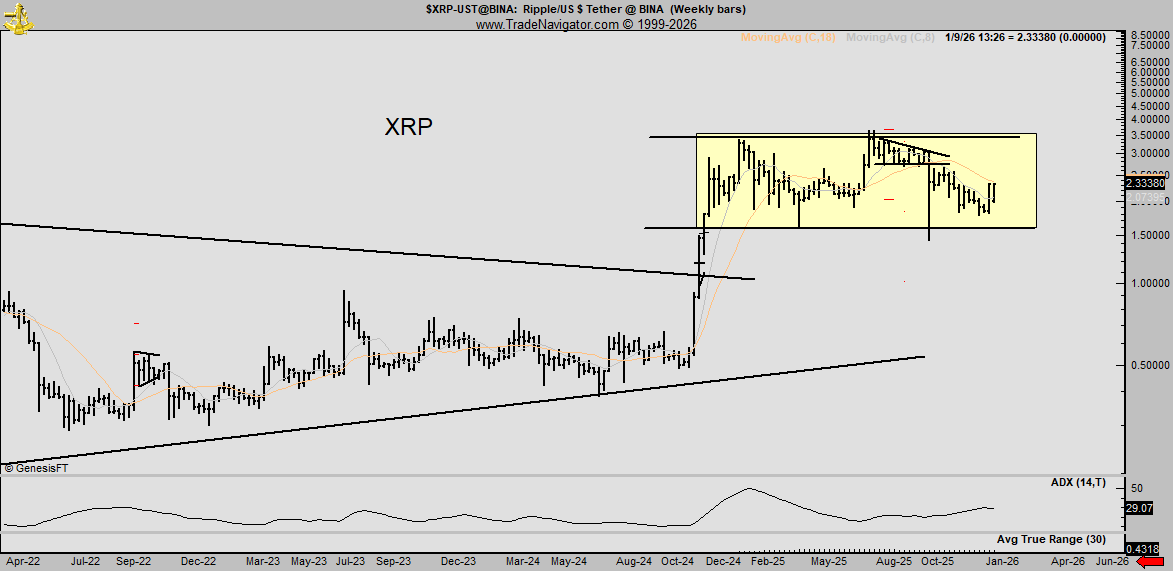
While XRP has broken out in the daily timeframe, recording five consecutive green candles, Brandt’s accompanying chart shows it remains range-bound in the weekly timeframe. For context, after the fourth-largest cryptocurrency by market cap broke out of a multi-year triangle in November 2024, it started forming a price range.

XRP Analysis/Peter Brandt

Notably, this started from its January 2025 high of $3.39, with XRP shuffling between the channel’s upper and lower trendlines. For context, it revisited the lower support with its early April 2025 low of $1.61 and moved slightly above the upper resistance trendline with the July peak of $3.66. After a rejection there, it dropped to the support with its flash crash to $0.77 in October 2025.

Meanwhile, despite the recent price resurgence, XRP remains within the price range. This serves as a reality check for XRP permabulls who already predict that XRP will explode from here. The veteran trader’s analysis seeks to clarify that the cryptocurrency faces major resistance ahead, and its reaction from there would determine whether it breaks out to unprecedented prices or retests price lows.

Where Would XRP Break Out?

Brandt’s chart further identified where XRP enthusiasts need to closely monitor to confirm a breakout and a full bullish momentum shift. Per the chart, XRP needs to sustainably trade above the $3.5 resistance to confirm its breakout. From the current market price of $2.35, this represents a 49% increase.

Breaking above its July 2025 high of $3.66 further confirms its bullish intent and paves the path for new all-time highs. This implies that nothing is confirmed for XRP until it breaks above these key resistance levels.

Nonetheless, XRP has shown it can conquer strong resistance areas. Further fueled by incessant demand from institutional investors through the US XRP spot ETFs, momentum is on the asset’s side. If XRP eventually breaks out of the wedge, analysts predict its next leg could target $8 or higher.

Bitcoin Price Analysis for Jan 6: BTC Must Breach the $98K Weekly Resistance

Bitcoin faces key resistance at $98K, with recent fluctuations showing strong upward momentum. Can BTC break the resistance?

Bitcoin (BTC) has seen significant price fluctuations over the last 24 hours, particularly after reclaiming $90,000. Following the $92,150 bottom, BTC quickly surged to a high of $94,634. However, the price then experienced a slight pullback, and is currently trading at $93,681, just below its peak.

The price action showcases strong upward momentum, with the market pushing toward the upper side of its price range. The $92,000 area is now acting as support, while the recent peak above $94,600 remains a critical resistance point. Can Bitcoin break out of these resistances areas?

Bitcoin Price Analysis

On the technical analysis side, Bitcoin is currently making an attempt to break through the first weekly Fibonacci resistance at the 0 level, which sits at $98,242. If the price fails to hold above this level and faces a drop, Bitcoin could potentially retest lower areas, exposing it to price points below $90,000.

Bitcoin Price Analysis

Moving up, the 0.236 Fibonacci level at $107,103 and the 0.382 level at $112,585 are crucial resistance points that Bitcoin would also need to break for further bullish momentum. A successful move past these levels would open the path toward the next Fibonacci resistance at $117,016, followed by the $127,755.

The Average True Range (ATR) at 8,458 suggests declining volatility. Typically, in periods of lower volatility, the price experiences stable price movements with fewer dramatic swings.

Bitcoin Spot Flows

Elsewhere, a spot flows chart shows mixed market sentiment across different time periods. In the short term, the 30-minute and 1-hour inflows are positive, with net inflows of $3.96 million and $13.64 million, respectively.

Bitcoin Spot Flows
Bitcoin Spot Flows

However, the 4-hour and 8-hour periods show increasing outflows, with $11.51 million and $18.66 million leaving the market, suggesting that selling pressure is building up in the short term. Nonetheless, this could also mean traders are moving liquidity out of the market for cold storage, a sign of an upcoming supply constraint. The 12-hour data indicate a smaller net inflow of $26.31 million, but with a slowing momentum, as seen in the 55.82% decrease in inflows.

Despite some short-term volatility, the longer timeframes show stronger positive sentiment. The 24-hour period sees $85.85 million in net inflows, a 69.59% increase, and the 3-day inflows have surged by 101.58%, totaling $177.54 million. This indicates growing investor confidence over the medium term. While this is positive, these inflows could also represent traders moving funds into exchanges in preparation for potential trades.

Expert Predicts XRP Price Targets for His Green Box Setup, Says XRP Has the Best Chart Out There

0

A well-known market analyst recently called the XRP 1-week chart “one of the best-looking charts out there,” presenting a target for his green box setup.

This commentary came from the anonymous analyst behind the “Freedom by 40” account, which targets financial freedom for investors by at most 40 years. Notably, the analyst has persistently called the XRP weekly chart the best chart in the market, but he recently reiterated the sentiment amid the ongoing XRP rebound.

XRP Has One of the Best-Looking Charts

For context, after an abysmal Q4 2025, which led to a 35% collapse from $2.84 in October 2025 to $1.839 by the end of the year, XRP began the new year, 2026, with a strong recovery effort alongside the rest of the crypto market. So far, XRP has spiked 30% this year, outperforming BTC (+7%), ETH (+8.5%), SOL (+11.6%), BNB (+4.83%), and most other assets among the top 20.

With this recovery, the “Freedom by 40” analyst took to X today to again call XRP one of the best-looking charts he has observed, building on a previous analysis from October 2025. His chart confirmed that XRP was following a broader five-wave Elliott Wave structure on the weekly timeframe, which began in early 2023.

The altcoin completed Wave 1 when it rose to $0.94 in July 2023 on the back of the favorable ruling in the SEC case, and then completed Wave 2 when it corrected from the $0.94 high to a low of $0.38 in July 2024. The third wave began shortly after, and ended with XRP reaching the $3.4 peak in January 2025 on the back of the Trump-led rally.

Meanwhile, the rebound that started after this peak marked the formation of the corrective fourth wave, aligning with a smaller ABC correction. At the time of his October 2025 analysis, XRP traded for $2.55. However, the analyst had projected that the C correction would push XRP to lower prices, completing Wave 4 before a recovery emerges.

XRP Begins Recovery Push, Eyes Green Box Target

Interestingly, XRP followed this path, collapsing to as low as $1.82 in December 2025. Now, XRP has begun recovering from the Q4 2025 downtrend, which aligns with the market analyst’s Wave 5. This alignment with his Elliott Wave structure prompted the latest suggestion that XRP remains one of the best-looking charts. 

XRP 1W Chart Freedom by 40
XRP 1W Chart | Freedom by 40

Data from his chart shows that the market analyst expects the ongoing Wave 5 to close within an area he marks with a green box. Specifically, this green box rests within a price range of $4.5 (Fibonacci 0.5) to $8.39 (Fibonacci 0.786). Notably, XRP has the potential to target any of these figures as it closes the Elliott Wave.

For perspective, XRP would need to increase by 89% to 252% to reach the price range within the green box. Nonetheless, the analyst believes an extended XRP rally to a higher pink box is still possible, though unlikely. For context, this pink box rests between $8.39 and $13.36 (Fibonacci 1).

U.S. Custody of Maduro Stirs Talks About Hidden $60B Venezuelan Bitcoin Reserves

0

Bitcoin has become the focus of renewed market discussion following claims that Venezuela may control a vast, undisclosed cryptocurrency reserve. 

The allegations surfaced amid escalating geopolitical tensions after reports that Venezuelan leader Nicolás Maduro was taken into U.S. custody over the weekend.

Report Alleges Massive Undeclared Bitcoin Holdings

The renewed scrutiny stems from an investigative report published by The Whale Hunt. Specifically, the report claims that Venezuela may secretly hold Bitcoin valued between $60 billion and $67 billion.

This estimate contrasts with publicly available data. BitcoinTreasuries lists Venezuela’s known holdings at just 240 BTC, valued at about $23 million. Consequently, the substantial disparity between the two figures has fueled widespread speculation across cryptocurrency markets.

The report claims the alleged reserves were accumulated gradually over several years, with funds originating from oil revenues, gold reserves, and other state-controlled resources.

Moreover, these actions were reportedly motivated by the government’s efforts to operate outside U.S. financial restrictions. By shifting assets into cryptocurrency, Venezuela allegedly sought to bypass the traditional financial system.

Methods Allegedly Used to Convert and Store Funds

Expanding on these claims, The Whale Hunt outlines several mechanisms purportedly used to convert state wealth into digital assets. These include gold swap arrangements, oil transactions settled in Tether, and seizures from domestic cryptocurrency mining operations.

Furthermore, sources cited in the report indicate that the assets were ultimately consolidated into Bitcoin. Subsequently, they were retained for long-term holding rather than deployed in active circulation.

Alex Saab Named as Central Operator

A central figure in the report is Alex Saab, described as a longtime associate of Maduro and a key architect of Venezuela’s alleged crypto operations. The Whale Hunt claims that Saab managed the wallet infrastructure and controlled access to the private keys linked to the purported reserves.

Although Saab was extradited to the United States in 2021, he was released in a prisoner exchange in 2023. His release has renewed questions about whether he, or other regime figures, still retain control over the assets.

Historical Mining Activity Adds Context

Venezuela’s prior involvement in cryptocurrency mining adds further context to the allegations. CNBC reporter MacKenzie Sigalos has noted that the country has mined Bitcoin and Ethereum since 2017, linking the activity to the collapse of Venezuela’s national currency and the government’s shift toward alternative financial systems.

During a CNBC appearance, Sigalos also referenced reports that Venezuela used oil revenue to acquire USDT, which was later converted into Bitcoin. She added that even the possibility of U.S. authorities seizing such assets could strengthen Bitcoin’s investment narrative, calling it a potential bullish factor for the market.

Despite the heightened speculation, Bitcoin’s price action has remained relatively steady. At the time of reporting, the cryptocurrency was trading at $93,613, up by 1.38% over the past 24 hours and 7.45% over the past week.

Veteran Trader John Bollinger Highlights Strong XRP Lift but Says Pattern Looks Weaker Than BTC

0

John Bollinger, the inventor of the Bollinger Bands, is bullish on XRP but notes that its pattern is weaker than those of Bitcoin and Ethereum.

The renowned trader followed up on an earlier Bitcoin post yesterday with technical analysis of Ethereum and XRP prices. He noted that both assets are following a similar bullish pattern to BTC but lag the pioneering cryptocurrency.

Base, Squeeze, and Breakout

For context, Bollinger’s January 5 analysis identified a “near perfect” base for Bitcoin. He used the Bollinger Band squeeze and breakout to highlight this bullish price development, predicting that further price growth is on the horizon.

The analysis shows that BTC reached a base within the Bollinger Band around the $85,000 region. Notably, the cryptocurrency fell to $80,620 on November 21 but quickly rebounded, closing above $85,000. The support region provided a cushion for Bitcoin throughout its consolidatory period in late 2025, serving as the base.

Meanwhile, in early January, the Bollinger Bands squeezed, indicating low volatility. Typically, this precedes a sharp price move in either direction. Eventually, the move favored the upside, with the middle band’s slope confirming the direction.

As a result, Bitcoin has since broken out of its late 2025 price range with its rally past $94,000, and Bollinger is predicting further upside. His first target is $100,000, then $107,000, but he did not rule out higher prices.

Bitcoin Analysis/John Bollinger

Same Pattern for XRP but Weaker

Meanwhile, his latest follow-up tweet highlighted that XRP is following Bitcoin’s price pattern but lags in terms of strength.

XRP Bollinger Band Analysis/John Bollinger

Bollinger’s comments come despite the recent XRP bullish breakout, which saw it outperform BTC, Ethereum, and all other assets in the top 15 by market cap. For context, XRP is up 12% and 28% in the past 24 hours and seven days, respectively, above BTC’s 1.3% and 7%, and ETH’s 2% and 9.5%.

However, XRP’s breakout is not as pronounced as that of Bitcoin. The same applies to Ethereum, as Bollinger noted that it has a similar pattern but is delayed. At the time of his analysis, Ether had yet to break its December 2025 high of $3,445.

Nonetheless, Bollinger did not rule out the bullish momentum in XRP. With his prediction that Bitcoin would record higher prices, XRP is likely to follow that price trajectory.

Remarkably, the $8 target is among the most discussed price targets for XRP. Standard Chartered predicts this price level by the end of 2026, with widely followed analyst Charting Guy also sharing a similar target.