Home Blog Page 398

Brandt Shares Why He Believes a 75% Bitcoin Crash is Possible

0

Market veteran Peter Brandt has suggested that Bitcoin could correct by as much as 75%, citing historical data.

His recent commentary comes on the back of the latest Bitcoin crash below $90,000 on Dec. 1. Notably, while some market commentators have attributed the drop to a cascading effect from the Japanese yen’s spike, others insist it may have been due to over-leveraged positions in a low-volume environment, as more than $725 million in long positions has gone bust in the last 24 hours.

Despite the bearish turn of events, some market watchers expect a rebound, but not Brandt. Notably, Peter Brandt has flipped bearish on Bitcoin, citing historical data from its cyclical performance to call attention to a possible 75% correction for the price.

Bitcoin Always Crashes 75%+ After Violating Parabolic Advance

Specifically, the market veteran highlighted a “dominant parabolic advance” that Bitcoin typically observes during its bull run. According to him, Bitcoin has witnessed five bull markets since it launched in 2009, and each of these bull markets featured this dominant parabolic advance, which he identified as an upward-sloping line that guided the upward price action.

Meanwhile, this trendline, which appears on the weekly chart, has done more than just guide Bitcoin’s upward push; it has also acted as a reliable indicator for when the bull market has faced exhaustion. Brandt found that whenever Bitcoin’s price broke below the parabolic advance trendline, its price corrected further by 75% or more.

Bitcoin 1W Chart Peter Brandt
Bitcoin 1W Chart | Peter Brandt

This pattern has played out perfectly over the past five bull markets. In the first instance, after the 2011 bull rally, BTC dropped below the parabolic line in June 2011 to $15. In the following weeks, Bitcoin collapsed further, eventually crashing to a low of $1 by November 2011. This marked an 86% drop.

The same pattern occurred after the 2013 rally, with BTC crashing 80% from $827 in December 2013 to $162 in August 2015. Bitcoin broke below the trendline again in December 2017 and dropped 77% from $14,059 to $3,125 in December 2018. In the fourth instance, BTC dropped below the trendline in April 2021 and crashed 74.2% from $59,980 to $15,479 by November 2022.

BTC Has Again Violated the Parabolic Advance

Now, a similar structure has taken shape in the ongoing bull market. Data from Brandt’s chart shows that the current parabolic advance trendline began on the back of the recovery from the FTX-induced crash in November 2022. BTC had continued to trade above this trendline since then, until the recent market struggles led to a break below the line early last month.

If history is anything to go by, Bitcoin could be on track to record a drop of at least 75% in what seems to be an imminent bear market. For perspective, a 75% crash from the decline point of around $103,000 would lead to a Bitcoin price of $25,750. “You better have a great reason to bet against this pattern,” Brandt said

Meanwhile, analysts like Michaël van de Poppe still believe the bull run remains intact, and this may be just another correction. Following the latest Dec. 1 crash, he maintained that nothing has changed, predicting a retest of the resistance area between $90,000 and $94,000 with a possible rally to break above the $100,000 mark for the first time since mid-November.

Bitcoin 1D Chart Michael van de Poppe
Bitcoin 1D Chart | Michael van de Poppe

Sony Bank to Launch USD-Pegged Stablecoin for US Gamers and Anime Fans

0

Sony Bank, the online banking arm of Sony Financial Group, is preparing to launch a USD-pegged stablecoin in the United States. 

According to an Asia Nikkei report, sources with direct knowledge revealed that Sony Bank aims to roll out the stablecoin as early as next year. Notably, Sony plans to integrate the new digital asset across its broader ecosystem, enabling users to use the stablecoin as a payment method for watching anime, playing games, and accessing other entertainment services.

Currently, Sony customers rely on credit cards to pay for these offerings, an approach that comes with notable drawbacks, including high transaction fees. By introducing a stablecoin, Sony Bank expects users to pay for video game subscriptions, in-game purchases, and anime content more efficiently and at a lower cost within its digital platforms. 

Why U.S.? 

This US launch strategy appears intentional. As Nikkei highlights, the United States accounted for more than 30% of Sony Group’s external sales as of the first quarter of 2025. Consequently, focusing on its largest consumer base gives Sony a strong incentive to debut the stablecoin in the US market first. However, it remains unclear whether the bank will launch the stablecoin in other jurisdictions. 

In preparation for the launch, Nikkei confirmed that Sony applied for a US banking license in October 2025. Additionally, the bank plans to set up a dedicated subsidiary to manage its stablecoin operations.

Furthermore, following its recent partnership with U.S.-based startup Bastion, Sony Bank will rely on Bastion’s infrastructure to issue the stablecoin, ensuring a streamlined, compliant rollout. 

Growing Interest in Stablecoins 

Since President Donald Trump signed the GENIUS Act into law in July, several financial institutions have announced plans to launch new stablecoins in the US market. Major banks such as Bank of America, Citi, and JPMorgan Chase are now collaborating on a joint stablecoin initiative. Additionally, fintech giant Stripe has applied for a license that would allow it to expand its stablecoin operations across the country.

These developments underscore the rapidly growing interest in stablecoins among U.S. financial institutions. Meanwhile, the broader stablecoin market continues to expand, with USDT and USDC maintaining their dominance and pushing the sector’s total value to $315.27 billion at press time. In the meantime, Sony Bank has yet to officially confirm the stablecoin initiative. 

Sony, the parent company of Sony Bank, is no stranger to the crypto market. Over the past few years, the entertainment giant has expanded its footprint by debuting a crypto exchange, launching its own Layer-2 blockchain, and developing an NFT project.

XRP Meets Key Resistance but Forecasts Call for “10X Bigger” Rally in Coming Alt Season

XRP is facing a dynamic barrier at the middle Bollinger band, as analyst says its rally will be “10X bigger” in the upcoming altcoin season.

Notably, XRP has slipped sharply over the past 24 hours, falling 7.6% to around $2.03 as downside pressure continues to build across the broader crypto market.

The altcoin traded within a daily range of $2.02 to $2.21, reflecting continued volatility as it failed to hold upper-band pricing. XRP’s chart shows a steady breakdown from the $2.21 area, followed by persistent lower prices and declining intraday structure. 

With XRP now testing the psychological $2.00 level after sliding through key short-term supports, traders are closely watching whether this zone can stabilize price action or open the door to a deeper retracement. 

XRP Price Analysis

Looking at the technical end, XRP continues to trade below the Bollinger mid-band. The upper band currently sits near $2.38, forming an immediate resistance zone where prior upside attempts have previously stalled. The mid-line, positioned around $2.16, now acts as the closest dynamic barrier, and price has failed to reclaim it since slipping beneath this level. 

XRP
XRP

On the lower end, the bottom Bollinger band near $1.93 marks a key support area that has cushioned recent selloffs. The market is grading this zone as a crucial defense point, as a break below it could invite further retracement toward deeper range lows. 

Meanwhile, the Stochastic RSI readings at 71.52 and 83.10 indicate that XRP is leaning toward elevated levels within the oscillator range. While not deeply overbought, the gauge shows that former upside attempts are losing steam. A downward cross in this zone would align with the broader chart structure and signal increasing risk of extended downside if buyers fail to re-enter.

Overall, XRP remains technically constrained by layered resistance at $2.16 and $2.38, while the $1.93 region operates as the primary support floor. Until the asset reclaims its mid-band and sustains a close above it, the indicators suggest that bearish pressure is still the dominant force.

XRP 10X Bigger in Next Altcoin Season?

Elsewhere, an analyst on X asserts that the next phase of the crypto market cycle, which he describes as a “super cycle,” is expected to be significantly larger than previous altcoin expansions. Citing historical patterns in the altcoin-to-Bitcoin ratio, the analyst highlights three marked cyclical phases, 2017, 2021, and a projected phase beginning around 2026. 

Image

According to the shared visual, the upcoming period, labeled “Altcoin Season III,” will eclipse earlier cycles in size and duration. He further emphasized XRP as the central narrative within this forecast, stating that while the broader crypto cycle will be substantial, the “real story” will revolve around XRP.

In his commentary, the analyst claims that the anticipated 2026 cycle will not simply replicate 2021 but will be “10x bigger for XRP.”

Ripple CTO in 2017: A Higher Price for XRP Would Help Ripple

0

Ripple CTO David Schwartz believes that a higher price for XRP benefits the company in multiple ways. 

This view by Schwartz, made a few years back, has recently resurfaced within the XRP community. The message supports a long-standing belief that Ripple’s long-term strategy closely aligns with the value of XRP.

The renewed focus on Schwartz’s earlier remarks comes at a time when Ripple has completed $2.5 billion in acquisitions, expanded its institutional footprint, and now holds over $90 billion worth of XRP, according to data from Ripple’s API. For many, the past is finally aligning with the present.

Schwartz’s 2017 Insight: Why XRP Price Matters to Ripple

In his resurfaced 2017 tweet, Schwartz outlined several ways a higher XRP price directly strengthens Ripple’s business. He explained that a more valuable XRP supply gives Ripple greater leverage.


Specifically, Ripple can incentivize partners and liquidity providers more effectively. The company can raise more revenue from XRP sales.

Moreover, a higher value typically brings greater liquidity and trading volume — both essential for XRP’s role as a global intermediary asset. Larger liquidity pools also allow Ripple to target bigger and more profitable payment corridors.

Schwartz also noted that public perception plays a role. Whether fair or not, XRP’s price is often a measure of Ripple’s success. That perception can influence whether institutions choose to integrate Ripple’s technology.

He added that a higher price reduces volatility on similarly sized sales, making it cheaper for institutions to hold XRP and hedge exposure. And importantly, a higher value enables larger transactions:

“When Bitcoin sold for $1, you couldn’t use it to buy a house. You can now… Bigger transactions require bigger value.”

Today, this early insight reads like a blueprint for Ripple’s current strategy.

Ripple’s 2025 Reality Shows the Vision Aged Well

Fast forward to today: Ripple’s financial position has expanded far beyond what was possible when Schwartz first posted that tweet.

As of December 1, 2025, Ripple controls:

  • 34,700,000,005 XRP in escrow, worth about $71 billion
  • 4,954,117,520 XRP in usable wallets, worth over $10.2 billion

Together, Ripple holds nearly $92 billion in XRP, forming one of the largest single-asset treasuries in global finance.

This immense reserve reflects exactly what Schwartz described eight years ago: Ripple grows stronger when XRP’s price increases. Every $1 rise in XRP today would add roughly $40 billion to Ripple’s balance sheet. This dynamic is the foundation of Ripple’s expanding institutional strategy.

Analysts’ Views

Prominent community analysts such as CrediBULL and Digital Asset Investor have argued that Ripple and XRP’s price have always been interconnected, even if Ripple avoids stating this openly for regulatory reasons.

Ripple’s leadership continues to emphasize XRP’s importance. CEO Brad Garlinghouse has said that XRP remains central to the company’s strategy, and President Monica Long has noted that Ripple Prime is exploring XRP-backed collateral for institutional liquidity.

Analysts believe Ripple’s long-term plan is to build global liquidity systems, treasury tools, brokerage services, settlement networks, and tokenization platforms — all of which function more effectively when XRP is more valuable.

This creates a simple loop: higher XRP → more liquidity → bigger institutional use → higher Ripple value → more growth → even higher XRP.

Shiba Inu: Analyst Says Some Huge Winners Will Come from Current Oversold Levels

0

Analysts are still favoring a Shiba Inu recovery despite its massive correction, citing historical context as the premise for the sentiment.

Specifically, Digital Asset Research highlighted this possibility in a recent X post. The account insisted that Shiba Inu may be nearing its bottom, identifying a timeline for patient holders to record huge wins should expectations play out.

Shiba Inu Consolidates Just Like in 2020

Notably, Shiba Inu has corrected 20% over the past 30 days and 62% since the start of the year. While this may be a turn-off for many investors, the analysis highlighted that a similar event occurred over five years ago and ended up being bullish for the meme coin.

For perspective, SHIB reached a peak price in August 2020, with subsiding launch momentum sparking a 99% correction. This bearish price action lasted for 120 days, with the token reaching a bottom price in December 2020. What followed was an explosive rise in 2021, reaching a peak of $0.00008854.

Shiba Inu 120-day Correction from August 2020

Shiba Inu, like most meme coins, has followed the same trajectory. The commentary noted that most of them topped in August and have corrected aggressively since then.

As a result, Digital Asset Research believes it would be wrong to be “grave dancing” on such an opportunity to buy the dip. With similar market conditions emerging after 60 months, he suggested it may be wise not to miss out on what could be on the horizon.

Macro Conditions Look Appealing

Further, the analysis highlighted favorable macro trends. Specifically, the iShares Russell 2000 ETF (IWM) is breaking out, and meme stocks like Kohl’s are surging, providing catalysts for an upside.

Technically, the commentary spotlighted that we are approaching a full year of bearish trends for meme coins. After a broader market rally in December 2024 and early January, Shiba Inu has corrected considerably. He expects this trend to end soon as the 360-degree cycle nears completion.

Additional catalysts for a rally include Bitcoin dominance peaking at multi-year highs, Shiba Inu approaching oversold territory, and a possible Ethereum bottom this month. If these factors align to create a bullish momentum, the analyst expects “some huge winners” for SHIB between February and March 2026.

Remarkably, the projection closely aligns with an ambitious analysis from Meme Whale. The projection sees Shiba Inu rallying to between $0.001 and $0.01 by April 2026, representing a staggering 12,330% and 124,200% rise from the current market price of $0.000008045.

7,924% Massive Spike in XRP AccountSet Transactions

0

The XRP Ledger is currently experiencing an unusual surge in AccountSet transactions, and the activity has led to speculation across the community. 

Vet, an XRPL dUNL validator, first called attention to the trend in a recent post on X. He pointed out that someone had started running a large number of AccountSet transactions on the ledger. According to him, the activity resumed after BitGo’s earlier involvement stopped.

XRP Ledger Sees Surge in AccountSet Transactions

For context, this new wave builds on a similar pattern seen early last month in November, which many observers linked to BitGo. 

Specifically, on-chain data provided by XRPScan shows that the latest spike began on Nov. 20, when AccountSet transactions suddenly jumped to 30,474. Under normal conditions, the ledger only witnesses between 200 and 700 of these transactions a day. 

Notably, the trend didn’t slow down after the Nov. 20 spike. It climbed to 39,817 the next day and then rose again on Nov. 23 to 40,121. When compared to daily averages, the Nov. 23 peak marked a 7,924% jump. 

XRP Ledger AccountSet XRPScan
XRP Ledger AccountSet | XRPScan

The activity then dipped to 17,000 and 19,000 over the next two days but soon picked up again, staying above 39,000 for the rest of the month. Meanwhile, today, Dec. 1, data shows it has dropped to about 15,000, which still sits far above normal levels.

Institutional Activity?

Since no one has claimed responsibility for the spike, community members have begun sharing theories. For instance, some individuals believe large institutions might be preparing for something significant, especially because regular users do not create this kind of bulk activity.

For the uninitiated, an AccountSet transaction allows an XRP Ledger account owner to adjust their account settings. It costs only a tiny fraction of a cent and gives users an easy way to change flags, add a domain, set a message key, update account keys, or modify other account details. 

Moreover, institutions also rely on AccountSet transactions when they set up or configure large sets of wallets during tests or infrastructure builds before moving real funds.

Speaking on the latest surge, D.T., a member of the XRP community, argued that ordinary users never carry out these updates in large batches. According to him, when the ledger shows activity of this size, the source usually turns out to be a custodian, an exchange, or any institutional group. 

Eminence CTO Shares a Different Theory

However, not everyone sees it this way. Daniel Keller, the CTO of Eminence, pushed back on the idea that institutions need that many full accounts. 

He explained that the XRP Ledger uses destination and source tags specifically so companies can avoid creating separate accounts for every user. He pointed out that the ledger stores account records in a slim and efficient way, so most services have no reason to maintain tens of thousands of accounts.

When others asked him what he thought was happening, Keller said the simplest answer might be that someone who doesn’t fully understand the XRPL is making these changes. 

In response, Vet said this only highlights the unusual nature of the activity. He questioned which exchange would need that many XRP accounts but noted that BitGo created thousands during its earlier operations. 

He emphasized that running through that many accounts and changing their settings doesn’t match routine practice, especially since institutions normally rely on destination tags and a small set of hot and cold wallets.

The observations from last month support this. At the time, Vet noticed that BitGo activated thousands of XRP accounts at once, which triggered spikes in both AccountSet transactions and multi-signature activity. He later found out that BitGo had a faulty script that flooded the ledger with failed transactions after its account ran out of XRP.

Dogecoin Approaches Critical Support as Analyst Eyes Possible DOGE Season

Dogecoin nears major support after breakdown, with a prominent analyst suggesting a possible DOGE season.

Notably, Dogecoin is trading at $0.1376, showing a 7.8% decline over the past 24 hours as sharp sell-side momentum pushed the meme coin to its lowest levels in the past few days.

Additionally, DOGE is down 5.8% over the last seven days, 14.7% over 14 days, and 25.8% across the past 30 days, reflecting sustained downward pressure as bullish conviction fades. During the past 24 hours, Dogecoin has traded within a range of $0.1368 to $0.1505, with volatility accelerating toward the lower boundary of that band.

Despite the steepening pullback, Dogecoin retains a market cap of roughly $20.9 billion, backed by more than $1.35 billion in trading volume recorded over the last 24 hours. DOGE’s price chart shows a clear deterioration in structure, with market watchers now looking if Dogecoin forms a base and reverses, or whether current weakness risks extend into the deeper corrective territory.

Dogecoin Price Analysis

The weekly Dogecoin chart shows the asset trading firmly below key Fibonacci retracement levels, reflecting sustained downside momentum. After failing to hold above the 0.618 retracement zone near $0.20, DOGE broke through the 0.786 level at roughly $0.17. More recently, the 1 Fibonacci region around $0.19 is being tested, and acts as the next liquidity zone. 

Dogecoin
Dogecoin

A decisive close below $0.13 would expose Dogecoin to the deeper Fibonacci extension at 1.618 ($0.02). However, a bounce at the current support could offer an early signal of price stabilization, particularly if DOGE manages to reclaim the $0.16–$0.19 Fibonacci bands.

Elsewhere, the Relative Strength Index (RSI) on the weekly timeframe reinforces this bearish posture. With a current reading of 37.72, momentum sits below the neutral 50 line and continues to trend downward, indicating weakening buying strength and an environment where sellers retain control.

Importantly, there are no clear bullish divergences present, and the RSI has remained under its moving average line, conditions often seen in extended corrective phases.

Is the DOGE Season On?

On the market commentary end, Trader Tardigrade noted that Dogecoin’s most recent monthly candle closed below its long-term ascending support trendline, which he described as a “confirmed breakdown.” According to his chart, similar breakdown events occurred during previous cycle phases, marking structural shifts in DOGE’s long-range trajectory, specifically to the upside.

Image

Despite the bearish implication of the breakdown itself, Tardigrade also suggested that the event acted as a catalyst for what he called a “massive Doge season.” The analyst placed the next target for Dogecoin price above $6.5. For perspective, a move to $6.50 from the current price of $0.1376 would require approximately a 4,624% surge.

Grayscale to Launch First U.S. Spot Chainlink ETF This Week

0

Grayscale is set to introduce the United States’ first spot exchange-traded fund (ETF) for Chainlink (LINK), potentially as early as this week.

The new fund will convert Grayscale’s existing Chainlink private trust into a fully listed ETF. Consequently, U.S. investors will gain direct exposure to LINK through a regulated market vehicle. Nate Geraci, co-founder of ETF Institute, called attention to this impending development in a tweet today.

ETF Launch Timeline and Market Context

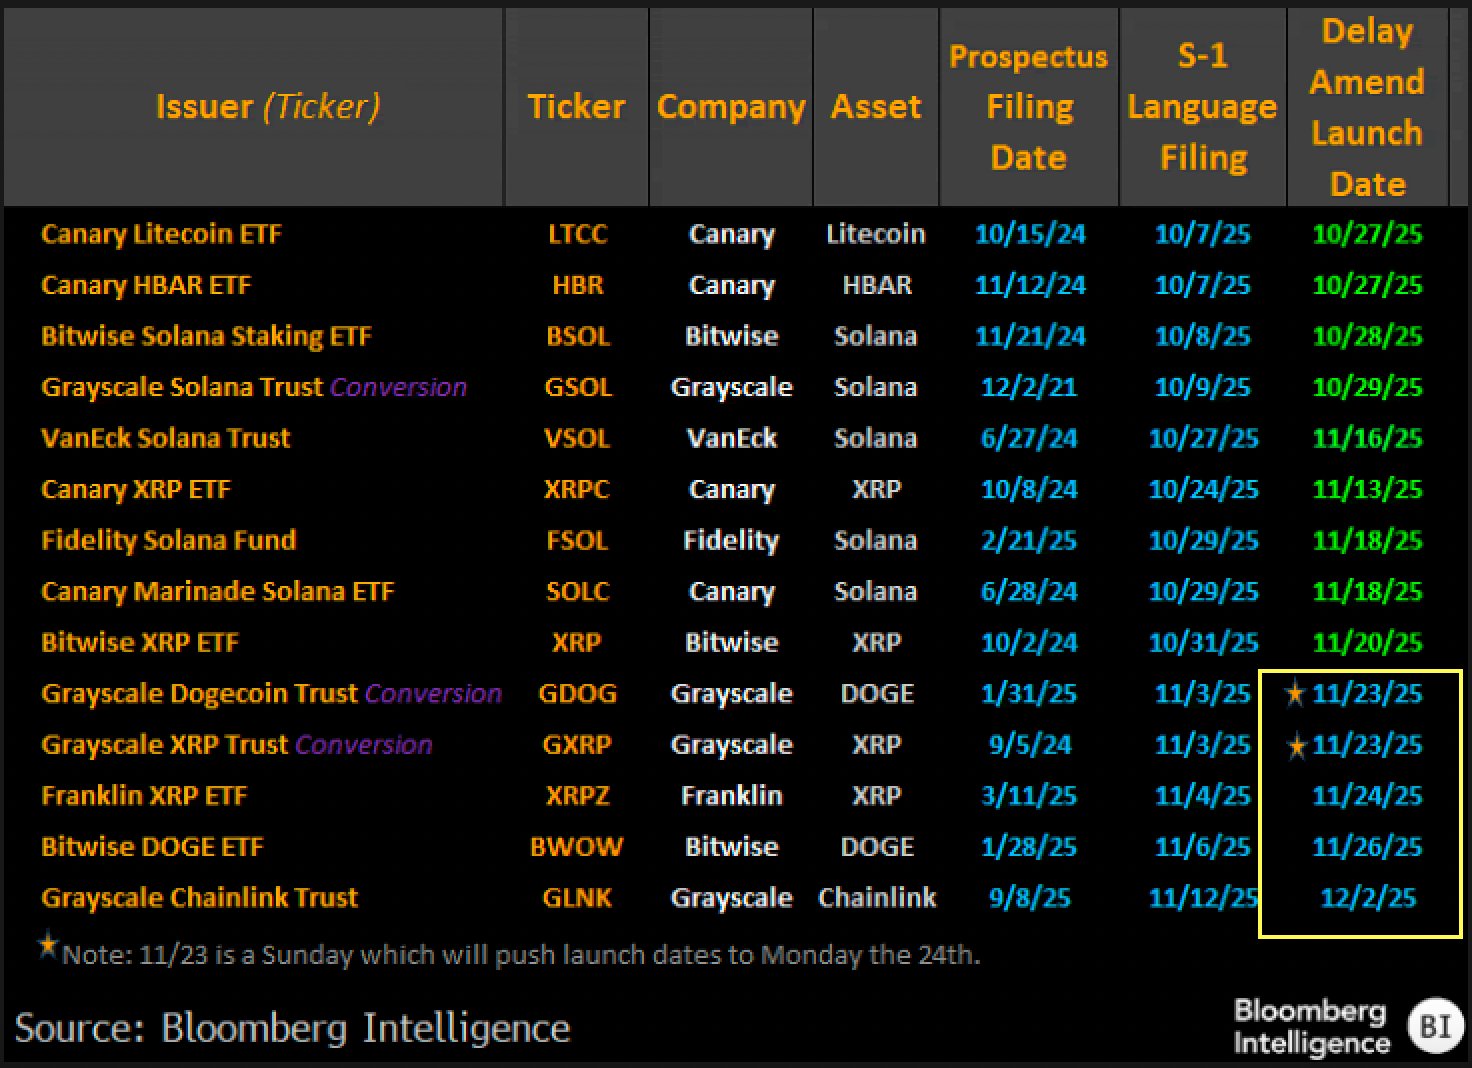
The expected launch aligns with Bloomberg Intelligence’s December 2 projection, according to senior analyst Eric Balchunas. Specifically, he cited internal listings data showing the product is positioned for near-term approval.

Image

Balchunas anticipates that more than 100 new crypto-linked ETFs will be introduced to the U.S. market within the next six months. Of these, at least five spot crypto ETFs could commence trading in the coming days.

This surge in activity follows a year of regulatory adjustments in Washington, which have eased resistance to crypto investment products. Consequently, the shifts have created an environment conducive to mainstream adoption of digital-asset funds.

Structure of Grayscale’s Chainlink ETF

Grayscale’s Chainlink ETF will be formed by converting its original LINK trust, which began operations in late 2020, into a publicly traded market instrument. Additionally, the fund will track the spot price of LINK and incorporate staking-related returns where permitted under current regulations.

The move positions Grayscale in direct competition with Bitwise, another asset manager planning its own Chainlink ETF. Analysts expect the competition to attract both retail and institutional investors seeking exposure to the oracle-focused token.

Grayscale has previously highlighted Chainlink’s distinctive role as a bridge between blockchain networks and real-world financial systems. In this capacity, it delivers essential data feeds, pricing information, and settlement triggers for both cryptocurrency and traditional financial platforms.

Altcoin ETFs Gain Traction

The Chainlink ETF arrives amid growing interest in altcoin-focused ETFs. For instance, in recent weeks, funds tied to Solana, XRP, and Dogecoin have debuted, while additional XRP and Dogecoin ETFs are launching this week.

Early performance highlights strong investor demand. The Canary Capital XRP ETF (XRPC) recorded $245 million in net inflows on its inaugural day. Notably, this impressive debut marked the largest opening-day total for any ETF in 2025.

Similarly, the Bitwise Solana Staking ETF (BSOL) amassed over $660 million in assets within three weeks and did not experience a single day of outflows.

Adding to the momentum, Grayscale’s XRP and Dogecoin ETFs also commenced trading last Monday. Bitwise has also launched a Dogecoin ETF, reflecting growing investor appetite for regulated exposure to altcoins.

Analyst Says This Week Will Be a Big Milestone for XRP

0

Chad Steingraber says the coming days could mark a major turning point for XRP, as the market prepares for the first full week in history in which five pure spot XRP ETFs trade side by side.

Notably, the 21Shares XRP ETF (TOXR) is launching today, joining Canary Capital, Bitwise, and others. Commentators like Steingraber believe this new competitive environment will reveal how aggressively issuers plan to accumulate XRP over the long term.

Five ETFs, One Full Week: “We’re About to Learn a Lot”

Indeed, this will be the first trading week featuring products from 21Shares, Bitwise, Grayscale, Franklin Templeton, and Canary Capital.

Steingraber says this setup will “tell us a lot” about what to expect from institutional accumulation going forward.

Notably, ETF inflows have already crossed $666 million in less than a month, with zero outflows through ten consecutive trading days. Just last week, Bitwise increased its holdings to 80.5 million XRP, while Canary Capital, Grayscale, and Franklin Templeton also recorded steady inflows.

Steingraber believes these patterns are only the early stages of a larger wave of demand that will intensify as all U.S. XRP ETFs come online.

“The Results Are Wild”

Financial analyst Mohamed Bangura ran a price-path sensitivity simulation, which Steingraber highlighted in his post. Bangura used the following assumptions:

  • ETF demand baseline: 74.5 million XRP per day
  • Total exchange supply: 2.7 billion XRP
  • Escrow release: 300 million XRP every 30 days
  • Elasticity values: 0.2, 0.5, and 1.0 over 180 days

He notes that lower elasticity leads to rapid depletion of exchange supply, while higher elasticity results in more dramatic price spikes as OTC liquidity absorbs inflows. Even without factoring in FOMO, he describes the model’s outcome as “wild.”

Bangura’s work aligns with the views of several analysts who believe ETFs may be draining accessible XRP much faster than anticipated.

Screenshot 2025 12 01 at 105504 am
Mohamed Bangura XRP ETF accumulation estimate

XRP ETF Inflows Are Already Thinning Liquidity

Jake Claver, CEO of Digital Ascension Group, recently warned that OTC and dark-pool liquidity may be close to exhaustion. He estimates that “800 million XRP” of private liquidity has already been absorbed in the first week of ETF accumulation alone — nearly half of what he believes was available across OTC venues.

Meanwhile, XRP ETFs currently hold more than $687 million in assets, representing just over 300 million XRP.

Because ETF accumulation occurs off-exchange, XRP price action has not yet reflected the tightening supply. Claver believes the true volatility will begin when ETFs exhaust OTC channels and are forced to source liquidity directly from exchanges.

21Shares Adds Pressure With New ETF Launch

Today’s launch of 21Shares’ spot XRP ETF brings fresh competition to the market. The fund carries a 0.50% management fee and debuted with a $500,000 seed basket.

With five ETFs now active, and two more expected, analysts like Steingraber say the stage is set for one of the most influential weeks in XRP’s history. As Steingraber puts it, “[This] week is a big milestone for XRP.”

XRP Traders Lose Appetite for Aggressive Upside Bets as OI Crashes 59%

0

XRP open interest has dropped tremendously since the October 10 crash, as traders lose interest in aggressive leveraged exposure.

Notably, XRP has taken another leg lower over the past 24 hours, as Bitcoin briefly fell below $86,000. The crypto asset experienced a 6.7% correction, pushing its price to $2.05 at the time of writing.

Dwindling XRP OI

Meanwhile, the XRP price is not the only thing falling; the token’s futures open interest (OI) is following a similar trajectory. Data from Glassnode shows the metric has been in a downtrend since early October, as market speculators have shown a deteriorating interest in leveraged exposure to XRP.

The tweet highlighted that XRP’s futures OI has collapsed from $1.7 billion in early October to $780 million on November 30, representing a 59% flush. Glassnode noted that the October 10 crash was a significant catalyst for this “structural pause,” as uncertainties emanating from the price action have tamed wild bets on XRP’s upside.

XRP OI/Glassnode
XRP OI/Glassnode

For the uninitiated, October 10 holds the record for the highest single-day liquidation in crypto’s history. XRP dropped to $0.77 from $2.27 on Binance in minutes, with most other assets recording a similar trend. This move wiped out $19 billion in 24 hours.

Funding Rate Drops

Moreover, a decline in the funding rate further highlights a skew away from XRP upside bets. Glassnode shared, using the 7-day simple moving average, that the perpetual funding rates have moved from 0.01% to 0.001% across all exchanges.

Funding rates are usually what perpetual traders pay or earn to keep their positions, depending on whether the rate is positive or negative. Interestingly, XRP’s funding rate tilts towards zero, suggesting a lack of confidence among market users that the asset would log in higher prices in the near term.

Flush Could Spell Bullish Momentum for XRP

Meanwhile, some analysts suggest that the declining OI could spell bullish momentum. They view the downtrend as a market reset aimed at shaking out overleveraged positions and grabbing liquidity before the next impulsive move.

Furthermore, the XRP long/short ratio also adds bullish prospects. CoinGlass data shows a long/short ratio of 2.69 on the XRP/USDT pair on Binance, suggesting an obvious bullish account dominance over short bets.

The same is seen on OKX. The exchange records a long/short ratio of 2.29, as more accounts are betting on an XRP rebound to higher prices despite the recent downtrend.

Long/Short Ratio CoinGlass

Increasing volume also adds to the momentum. Specifically, CoinMarketCap data shows a 91% uptick in 24-hour XRP trading volume to $3.88 billion.