Home Blog Page 41

Analyst Turns Bullish on Cardano, Eyes 14% ADA Rally Toward $0.20

0

Popular crypto analyst Ali Martinez has turned bullish on Cardano after ADA reached his previously identified downside target of $0.17.

Martinez’s latest outlook marks a notable shift from his earlier bearish warning that ADA could face further losses. At the time, he highlighted declining whale holdings as one of the warning signs. Specifically, the number of wallets holding between 1 million and 10 million ADA fell from 2,370 to 2,340, suggesting reduced participation among large holders.

Additionally, Martinez highlighted a bearish development in Cardano’s MVRV ratio, which formed a death cross against its seven-day simple moving average (SMA). Meanwhile, he also warned that the TD Sequential had also flashed a sell signal on ADA’s daily chart. 

TD Sequential Flashes Buy Signal as ADA Targets $0.20

However, the technical picture changed after ADA reached the $0.17 target.

Martinez now says the daily TD Sequential has produced a buy signal, suggesting that the recent downturn could be nearing exhaustion. Notably, his earlier bearish outlook also relied partly on the same indicator. Therefore, the shift from a sell signal to a buy signal could indicate a potential change in ADA’s short-term trend.

With ADA reaching his $0.17 downside target, Martinez has set $0.20 as his next price target. Reaching that level would represent a 14.28% increase from the $0.1750 area. 

ImageIn Martinez’s view, a move toward $0.20 could indicate that buyers are beginning to regain control. So far, ADA has shown early signs of recovery following his latest forecast. The token climbed to around $0.1750, gaining 1.02% over the previous 24 hours.

Nonetheless, spot trading volume declined by 15.39% to $168.85 million, suggesting that the recovery has yet to attract stronger spot-market participation.

Cardano DeFi Activity Shows Signs of Recovery

Meanwhile, activity across Cardano’s DeFi ecosystem has provided some encouraging signals.

On-chain DEX volume has reached $90 million over the past 30 days, representing a 37.5% increase from the previous period, according to DeFiLlama data. Derivatives and perpetual trading activity has also strengthened, reaching approximately $131.5 million.

However, not every Cardano metric points to a recovery. Cardano’s total value locked (TVL) has continued to decline, falling to $65.1 million. This figure stands significantly below the network’s 13-month peak of $437.2 million recorded in August 2025. Specifically, Cardano’s TVL has dropped by approximately 85% from that previous high, according to data from DeFiLlama.

Therefore, while improving trading activity and the latest TD Sequential buy signal offer some optimism, the sharp decline in TVL remains a key challenge for ADA and its broader DeFi ecosystem. 

XRP Sees ‘Rush Hour’ Activity as London and New York Markets Overlap

0

XRP trading is increasingly taking place during the hours when the London and New York markets are open simultaneously, according to Evernorth.

This suggests that more XRP activity is occurring during normal financial market hours with participation from institutional and retail investors.

XRP Volume Surges During London-New York Overlap

Evernorth said the three-hour period between 13:00 and 16:00 UTC now accounts for roughly 23% of XRP’s total on-chain volume from Monday to Friday.

That compares with about 14% during the same three-hour window in July 2025. The company based its comparison on XRP on-chain trading records analyzed through Dune, a popular data analytics platform.

The accompanying chart shows XRP volume peaking at 14:00 UTC in July 2026, when that hour accounted for nearly 10% of the day’s on-chain volume. The period coincides with London’s afternoon session and New York’s morning session.

Evernorth described the pattern as a shift toward “banker hours,” arguing that it is consistent with growing institutional interest in XRP.

XRP rush hour chart by Evernorth

Activity Mirrors Global FX Trading Hours

The 13:00–16:00 UTC window is also significant in traditional financial markets because it overlaps with the operating hours of London and New York, two of the world’s largest financial centers.

Evernorth said this is the only part of the trading day when both centers are open simultaneously. The company noted that global foreign exchange activity also tends to concentrate around this overlap.

The data therefore suggests that XRP’s on-chain market is becoming more active during a period of higher global financial liquidity.

However, the concentration of activity during these hours does not, by itself, prove that banks or institutional investors are responsible. Other market participants operating on similar schedules also contribute to the trend.

Order Books, AMMs and Payments Show a Similar Shift

Meanwhile, Evernorth said the trend is occurring across the XRP Ledger, rather than being concentrated in one part of the market. Activity is increasing across order books, automated market maker (AMM) pools and cross-currency payments.

This suggests that the rise in daytime trading cuts across the XRP ecosystem rather than coming from a single market. The shift comes as institutional interest in XRP continues to grow, with ETFs attracting new daily inflows and cross-border payments expanding through Ripple Payments.

Evernorth is also building a publicly traded XRP treasury company and has highlighted growing activity in tokenized assets and RLUSD on the XRP Ledger.

This does not mean trading stops after normal market hours. Instead, more activity is now taking place during the overlap between London and New York trading hours.

In short, XRP does not “close at 5 p.m.,” but the network has increasingly clear “rush hours.” These busy periods could be a useful indicator to watch as institutional activity around XRP develops.

XRP ETPs Pull In $253.6M as XRPL Stablecoins Surge 195% in Q2

0

XRP saw strong activity in Q2 2026, with institutional interest, stablecoin adoption, and RWA tokenization driving growth across the XRP Ledger (XRPL) ecosystem.

According to Blockworks’ State of XRP: Q2 2026 report, XRP ETPs attracted $253.6 million in net inflows during Q2, a 45.1% increase from the $174.8 million recorded in Q1.

May and June were particularly strong, generating $141.9 million and $111.5 million in net inflows, respectively. Cumulative net inflows since the launch of the first U.S. spot XRP ETF in November 2025 surpassed $1.90 billion.

However, quarter-end ETP assets under management fell 17.1% to $1.99 billion, reflecting XRP’s 19.9% price decline during the quarter.

Bitwise led tracked issuers with $421.5 million in quarter-end AUM, followed by 21Shares with $366.2 million, Canary Capital with $240.7 million and Franklin Templeton with $234.6 million. Together, the four issuers represented 63.6% of tracked XRP ETP AUM.

XRP ETP Issuer chart for Q2

XRPL Stablecoin Activity Accelerates

Meanwhile, XRPL-native stablecoin supply surged 195.4% quarter over quarter to $825.5 million, compared with $279.5 million at the end of Q1. The figure was more than 1,100% higher than the $66.1 million recorded a year earlier.

Ripple’s RLUSD accounted for $676.9 million, or 82% of the total.

XRP Ledger (XRPL) Stablecoin chart with RLUSD dominating

RLUSD also drove most of the growth in stablecoin transfer activity. Stablecoin transfer volume on XRPL rose 207.5% to $10 billion, with RLUSD accounting for about $9 billion (90%). That was nearly 3.5 times its Q1 transfer volume of $2.6 billion.

RLUSD also expanded its reach during the quarter. OKX added RLUSD across more than 280 spot trading pairs, including XRP/RLUSD. Japan also approved RLUSD as an electronic payment instrument under its Payment Services Act.

XRPL’s Tokenized RWA Market Passes $4 Billion

Real-world assets (RWAs) were another major growth area for the XRP Ledger in Q2 2026. The total value of tokenized RWAs on XRPL reached $4.46 billion, up 102.5% from Q1. This made XRPL the fourth-largest network for tokenized RWAs tracked by RWA.xyz.

About half of the total came from Justoken’s $2.23 billion JMWH, an energy-backed asset that was fully held by its issuer.

XRPL also attracted more institutional players. Kyobo Life Insurance continued a pilot for settling tokenized government bonds in South Korea. Later, Aviva Investors launched a tokenized share class of its USD Liquidity Fund on XRPL, with BNY Mellon serving as custodian.

By late July, XRPL had 42 tokenized assets, including corporate bonds, commodities, U.S. Treasuries, stablecoins, investment funds, and government bonds.

XRPL Fees Remain Extremely Low

Despite higher network activity, XRPL kept transaction costs very low. The average transaction fee fell to $0.00024 in Q2, down from $0.00034 in Q1. This was the fifth straight quarterly decline.

The network burned about 40,600 XRP in transaction fees during Q2, compared with 50,800 XRP in Q1.

Payments and transfers generated about $31,800, making up 59.7% of network revenue. Account deletions generated $11,800, while orderbook activity generated $5,400.

Overall, Q2 showed institutional demand, stablecoins adoption, and growth in tokenized real-world assets.

US Crypto Exchange Lists Shiba Inu as SHIB Recovery Gains Momentum

0

Crypto exchange UEX.US has announced the listing of Shiba Inu (SHIB), giving users another avenue to trade and access financial services tied to the meme coin.

According to the exchange, users can now trade Shiba Inu against USDT and other major assets. In addition, they can purchase the token through PayPal, bank wire transfers, or card payments.

Moreover, UEX.US has introduced a 4.5% APY Savings Rewards rate for SHIB from the first day. The platform also allows users to borrow up to 90% of their SHIB holdings without selling their tokens.

The listing expands SHIB’s reach among exchange users and adds another trading venue for the asset. Notably, the announcement comes about a week after Australian-based exchange FrameEx listed SHIB, after which the token briefly climbed to $0.00001004.

SHIB Shows Signs of a Modest Recovery

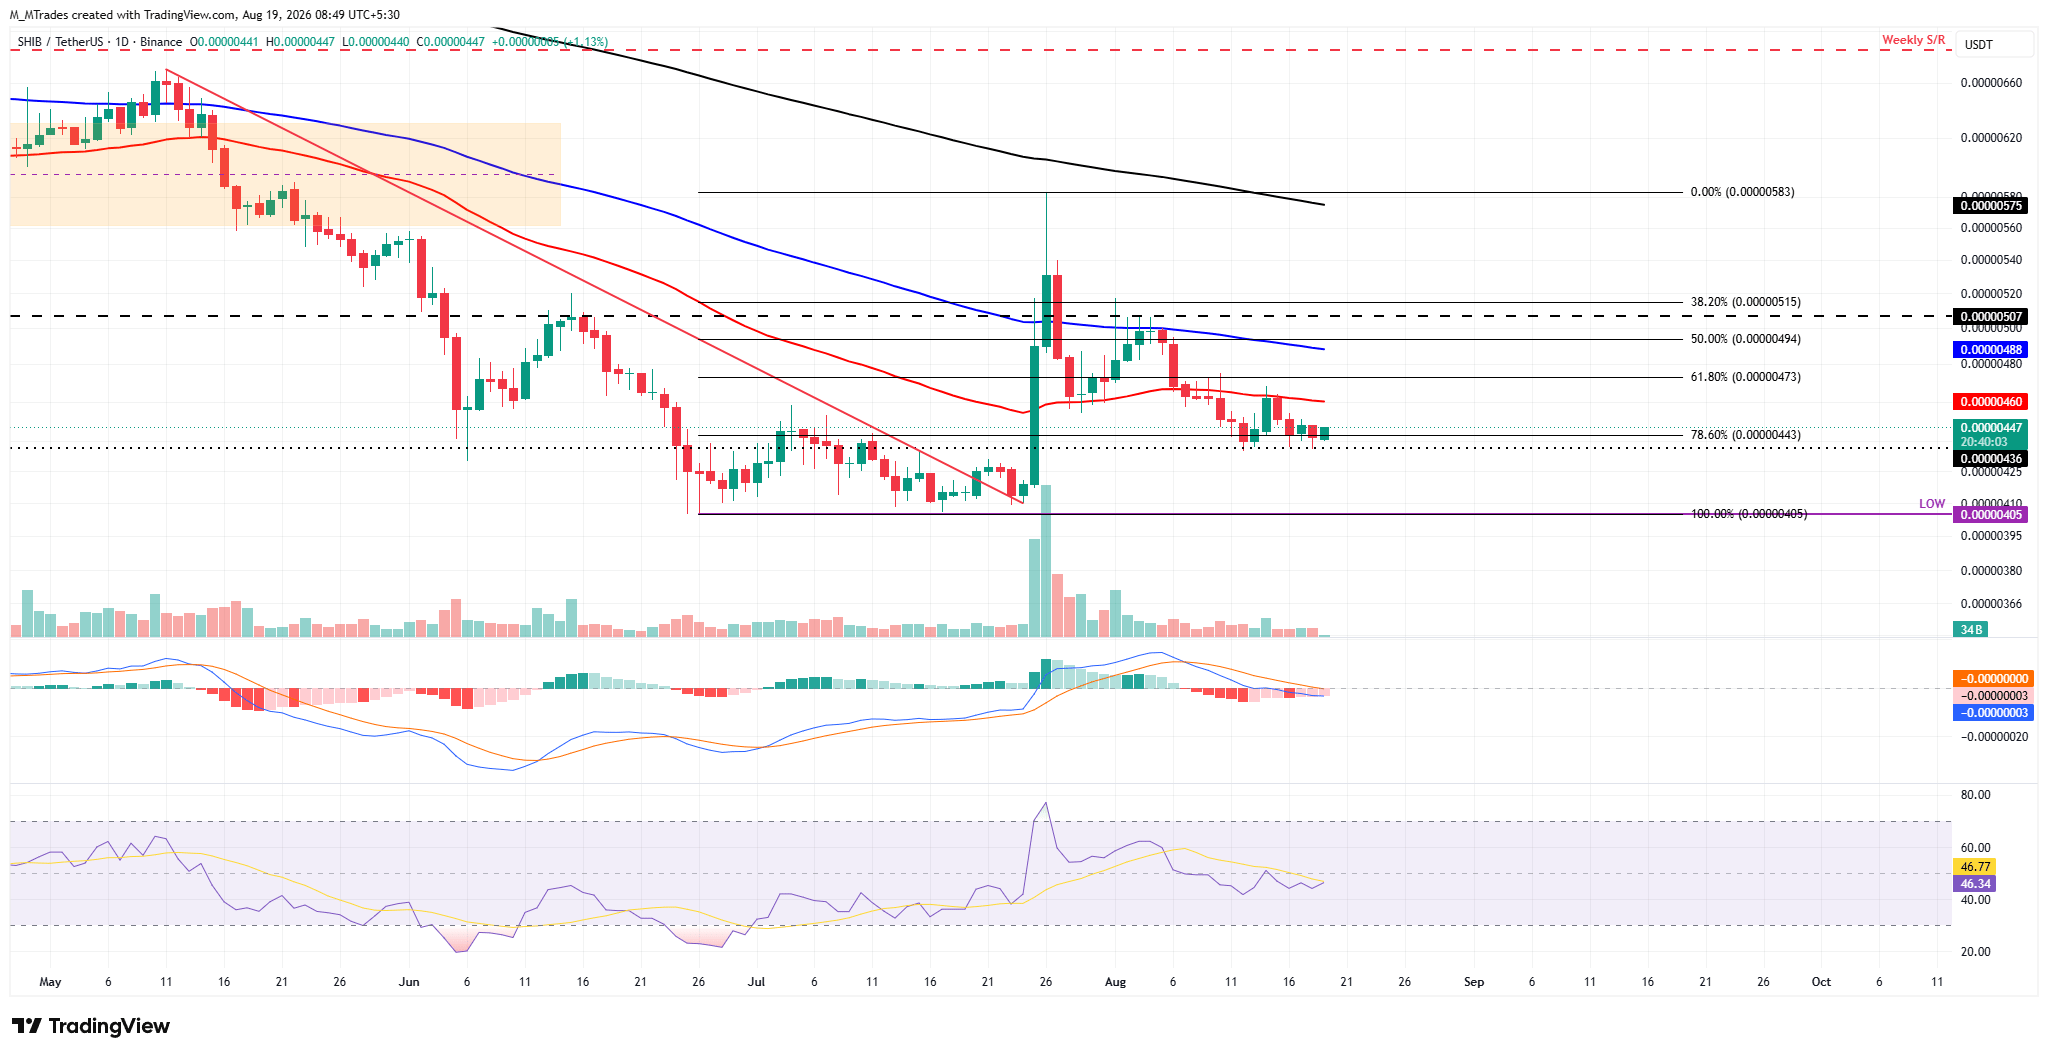
Meanwhile, SHIB is showing signs of recovery after finding support around $0.0000043 earlier this week. It is currently trading at $0.000004461, while several market indicators pointed to improving sentiment.

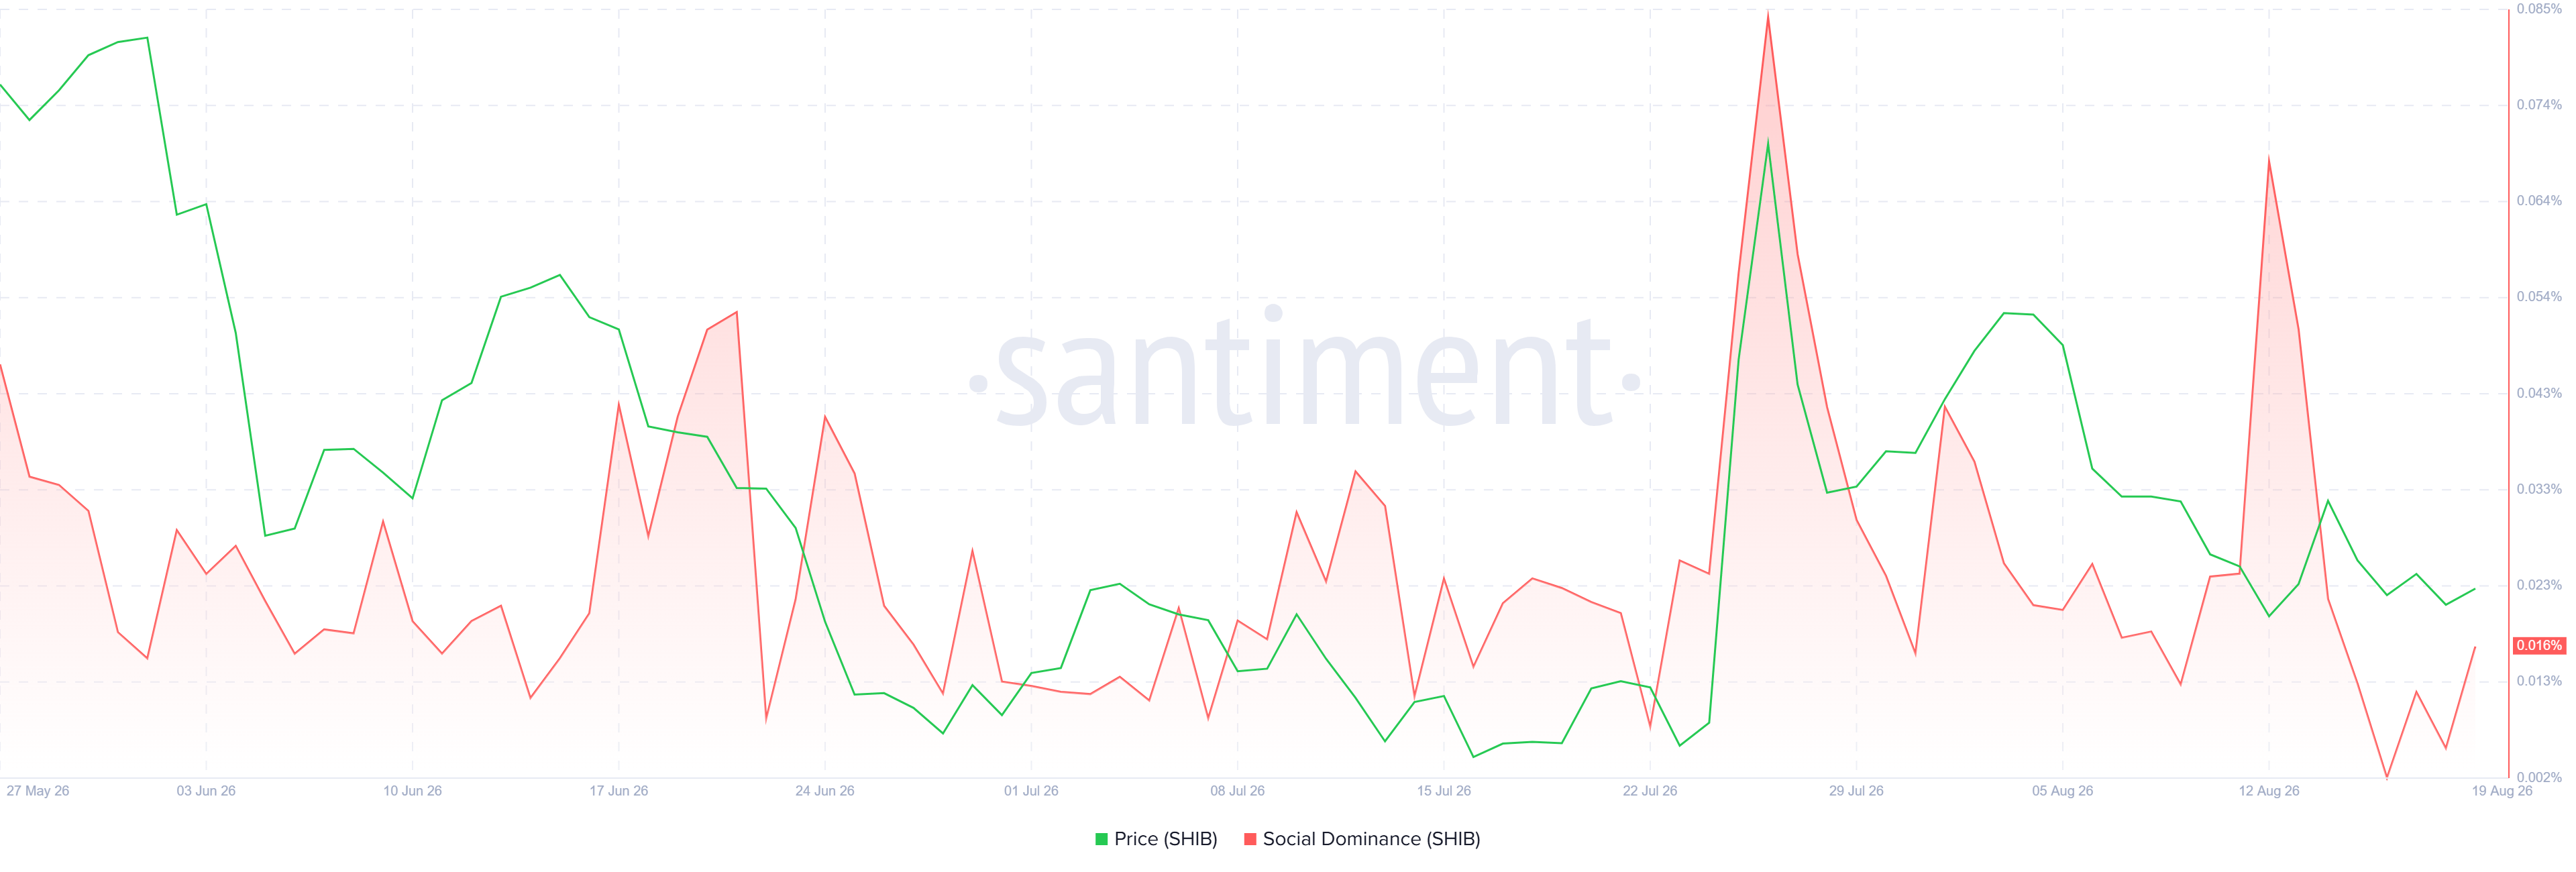
For instance, Santiment’s Social Dominance metric has recovered since August 16, reaching 0.016% at press time. This increase suggests that SHIB-related discussions are gaining prominence across cryptocurrency conversations.

Shiba Inu Social Dominance Chart

Derivatives data also offers a more constructive outlook. CoinGlass data showed SHIB’s long-to-short ratio at 1.01. Since the ratio sits slightly above one, long positions marginally outnumber short positions, indicating that traders are becoming more optimistic about SHIB’s near-term direction.

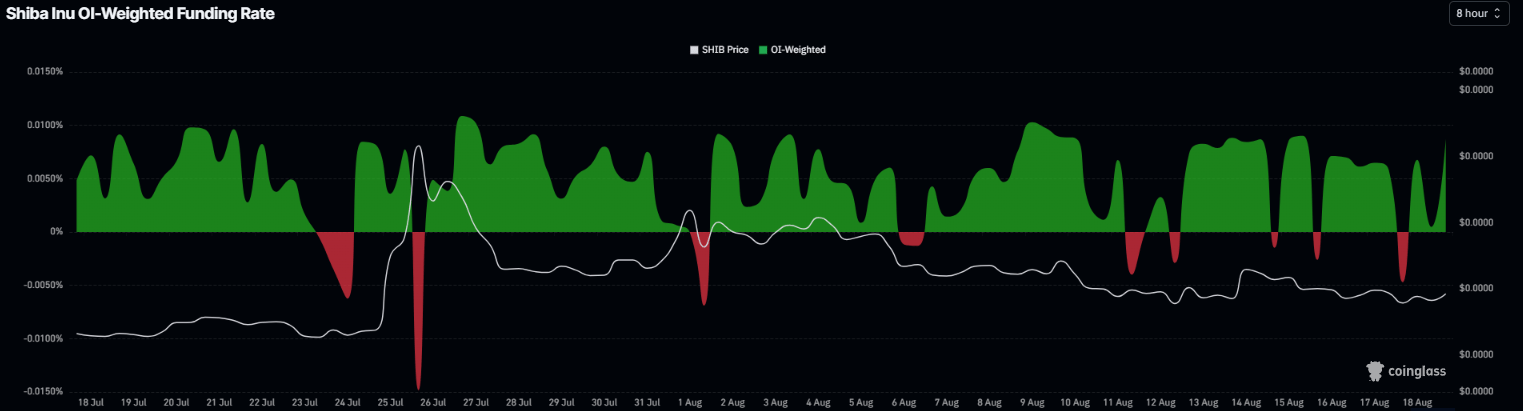
Furthermore, SHIB’s funding rate turned positive on Tuesday and climbed to 0.0087% on Wednesday. Positive funding generally means traders holding long positions are paying those holding shorts, signaling stronger demand for bullish exposure. 

Shiba Inu funding rates chart. Source: Coinglass
SHIB funding rates chart 

$0.0000043 Support Remains Critical

From a technical perspective, SHIB’s ability to hold above $0.0000043 could determine whether its latest recovery develops into a stronger rebound.

The token retested this support zone yesterday and attracted buyers around the level. It subsequently moved back above $0.0000044, suggesting that selling pressure may be easing. If SHIB continues to hold $0.0000043, its next potential target is the 50-day Exponential Moving Average (EMA), currently around $0.0000046.

Momentum indicators also provide some encouragement. The Relative Strength Index (RSI) stood near the neutral 50 level at 46, indicating that bearish momentum is weakening without yet confirming a strong bullish reversal. Meanwhile, the MACD’s declining red histogram bars point to fading downside momentum. 

SHIB/USDT daily chart

However, the recovery remains vulnerable. A daily close below $0.0000043 could invalidate the immediate bullish setup and expose SHIB to further losses towards the psychological $0.0000040 level. 

XRP Whales Suddenly Amass 190M Tokens in 24 Hours: What’s Coming?

0

XRP whales suddenly accumulated 190 million tokens within a single day amid the renewed bearish pressure that has kept XRP below $1.

The move comes as bears continue to gain ground around key price levels. Notably, sellers took control of $3 in October 2025, $2 in January 2026, and $1.50 in May 2026. Now, they appear to be trying to keep XRP below the important $1 level.

The selling pressure recently grew stronger after XRP recorded its first weekly close below $1 since reclaiming the level in November 2024. 

XRP remains below $1 and currently trades around $0.99. However, the latest whale activity suggests that some large holders are using the latest decline to add more XRP to their holdings.

XRP Whales Add 190M Tokens in One Day

Data from Santiment, a market intelligence platform, shows that XRP whales holding between 1 million and 10 million XRP increased their combined balance from 3.84 billion XRP on Aug. 16 to 4.03 billion XRP on Aug. 17. This indicates that the group added roughly 190 million XRP in just one day.

XRP Whales Suddenly Amass 190M Tokens

The timing of the accumulation is also worth noting, considering XRP’s recent price action. For context, XRP dropped from $1.001 to $0.9925 on Aug. 17, suggesting that these whales may have bought during the move below $1. 

Following the accumulation spree, the XRP price recovered above the key level, rising nearly 1% to $1.002 on August 17. However, the recovery failed to hold, and prices have since fallen below $1 again. At the time of writing, XRP trades around $0.99268.

Other Large XRP Holders Are Buying Too

The sharp increase among wallets holding 1 million to 10 million XRP stands out, but other large holders have also been building their positions in recent weeks. 

Gradual XRP Whale Accumulation Santiment
Gradual XRP Whale Accumulation | Santiment

Specifically, wallets holding between 10 million and 100 million XRP increased their combined balance from 11.62 billion XRP in mid-June to 12.22 billion XRP currently. This represents an increase of about 600 million XRP over the past five weeks. 

At the same time, wallets holding between 100,000 and 1 million XRP have also been adding XRP since early June, although their accumulation has come at a slower pace. On June 5, this smaller group held 6.31 billion XRP. Its combined balance has now risen to 6.38 billion XRP

Number of XRP Whales Hit a Yearly High

The latest data also shows a sharp rise in the number of wallets holding between 1 million and 10 million XRP. Their number increased from 1,524 wallets on August 16 to 1,612 on Aug. 17, adding 88 new wallets within 24 hours. Meanwhile, those holding 100,000 to 1 million XRP have continued to see a gradual increase since mid-June.

XRP Whales Continue to Increase

The increase pushed this group to a new yearly high in terms of wallet count. Before this jump, the number of wallets in the category had remained below 1,600 since a sharp decline in December 2025.

Higher XRP balances and a growing number of wallets in this range could be an important development for XRP. It does not guarantee that the token will immediately recover, especially while sellers continue to defend the area below $1. 

However, continued whale accumulation could help provide support if selling pressure starts to ease. The major question now is whether these large holders will continue buying if XRP remains below $1 or if further weakness could change their approach.

XRP Ledger to Soon Host Korean Won Stablecoin for Ripple Payments

0

The XRP Ledger (XRPL) could support a stablecoin tied to the Korean won as Ripple expands its payment services in South Korea.

This projection follows Ripple’s partnership with Jeonbuk Bank. On August 18, Ripple announced that Jeonbuk Bank became the first regional bank in South Korea to use Ripple Payments for international transfers.

The system allows the bank’s business customers to settle cross-border payments in seconds or minutes instead of several days. It also works 24/7.

XRPL Community Sees a Path for a KRW Stablecoin

Following the announcement, XRPL validator Vet, Hussein Zangana, argued that banks and financial institutions could bypass traditional payment systems like SWIFT as blockchain technology improves.

He pointed to Jeonbuk Bank’s Ripple Payments deployment and noted that a subsidiary of JB Financial is also testing a Korean won stablecoin. Vet suggested that a KRW-denominated stablecoin issued on the XRPL could provide a natural settlement asset for Ripple Payments.

He also said Ripple Payments could move onto the XRPL decentralized exchange, using tools like Permissioned DEX and Domains to meet compliance requirements.

This could allow a Korean won stablecoin to work with XRP and Ripple’s RLUSD, creating more options for cross-border payments.

How XRP Could Be Used for Payments

XRP influencer Krippenreiter suggested one possible way a future Korean won (KRW) stablecoin could work with the XRPL.

The idea would be to issue the KRW stablecoin on the XRPL, use a permissioned system for KYC, anti-money laundering and sanctions checks, and use a permissioned DEX to trade KRW for XRP, RLUSD and other assets.

Meanwhile, XRP will act as a bridge between different currencies and stablecoins, helping find efficient ways to convert between them. In this setup, Ripple Payments could use the DEX to access currency liquidity, while XRP could help move money between currencies.

However, this is only a proposed idea. Ripple and Jeonbuk Bank have not announced plans to issue a Korean won stablecoin on the XRPL.

Jeonbuk Bank Boosts Ripple Expansion in Korea

Meanwhile, the Jeonbuk Bank partnership is nevertheless significant for Ripple’s Korean strategy. It marks its third Korean financial partnership this year, after working with Kyobo Life Insurance and Kbank.

Kyobo Life Insurance is exploring blockchain-based government bond settlements, while Kbank is using Ripple Custody for institutional wallets. Together, these partnerships show Ripple is expanding its services in payments, custody, treasury and digital wallets in Korea.

XRPL developer Bird said these deals show Ripple’s plans for institutional adoption are becoming real financial infrastructure. He pointed to Jeonbuk Bank’s deployment, Ripple Payments’ expansion on-chain, permissioned DEX infrastructure, RLUSD, and tokenized assets as pieces of a broader ecosystem.

Spotify Stock Surges 6% Against Tech Selloff, Adding Nearly $7 Billion

Spotify shares surged Tuesday, sharply outperforming a technology sector pressured by rising bond yields and a major semiconductor selloff.

SPOT traded at approximately $523.41 as of 1:24 p.m. Eastern Time, up $30.89, or 6.27%. Based on Spotify’s 205.88 million outstanding shares, the rally added approximately $6.36 billion to its market value.

The stock reached an intraday high of $526.39. At that level, Spotify’s market capitalization had increased by nearly $7 billion from Monday’s close. The calculation represents a change in market value—not cash received by the company.

Why Is Spotify Stock Rising?

No major company announcement appears to explain the entire move. The clearest identifiable catalysts are a fresh analyst-rating reiteration, a rebound from Monday’s decline and Spotify’s relative appeal during a semiconductor selloff.

Morgan Stanley reiterated its Overweight rating and $640 price target on August 17. That target implies approximately 22% upside from Spotify’s stated intraday price.

However, the $640 target was not introduced Monday. Morgan Stanley originally raised it from $610 on August 3, describing Spotify’s earlier share-price weakness as a buying opportunity.

The bank expects Spotify to benefit from pricing power and expansion across audiobooks, video podcasts, ticketing and generative-AI mixing products. It also projects free cash flow to grow at an annual rate of approximately 20% over the next three to five years.

Chip Selloff May Be Supporting Spotify’s Relative Strength

Spotify’s rally occurred while investors were selling semiconductor and AI-infrastructure stocks.

The Nasdaq fell approximately 1.3%, while the Philadelphia Semiconductor Index dropped 5.4% as higher Treasury yields, rising oil prices and geopolitical uncertainty pressured richly valued technology companies.

Spotify offers investors a different growth profile based on recurring subscription revenue and considerably lower capital requirements than semiconductor manufacturers and AI data-center operators.

Its outperformance is consistent with investors rotating away from the chip sector. However, price action alone cannot confirm that sector rotation was the direct cause of Spotify’s rally.

Spotify’s Results Show Improving Profitability

Spotify ended its second quarter with a record 300 million Premium subscribers, up 9% from the previous year. Monthly active users increased 12% to 777 million.

Revenue rose 14% to €4.78 billion, while operating income climbed 61% to €655 million. Gross margin reached a record 33.4%, and free cash flow totaled €797 million as per Spotify’s second-quarter filing.

The results were mixed relative to expectations. Revenue and earnings per share narrowly missed analyst estimates, while Premium subscribers exceeded company guidance. Gross margin and operating income also surpassed Spotify’s forecasts.

That combination supports the longer-term profitability argument, although investors will still want evidence that subscriber growth and cash-flow expansion can justify the stock’s valuation.

New Products Could Expand Spotify’s Revenue

Wall Street is also evaluating Spotify’s opportunities beyond conventional music streaming.

The company is expanding into audiobooks, video podcasts, concert-ticket access and paid AI products. On May 21, Spotify and Universal Music Group announced an agreement allowing Spotify to develop licensed, AI-powered covers and remixes using music from participating artists and songwriters.

The product is expected to launch as a paid Premium add-on and create an additional revenue stream for Spotify and participating rights holders.

Because that agreement was announced in May, it should be viewed as part of Spotify’s longer-term growth narrative rather than a new explanation for Tuesday’s rally.

SPOTon Tokenized Stock Follows the Rally

SPOTon, Ondo Finance’s tokenized version of Spotify shares, also moved higher.

CoinMarketCap showed SPOTon near $518.15, up approximately 2.8% over 24 hours, with about $290,000 in reported trading volume. Its return differed from Spotify’s NYSE gain because the token uses a rolling 24-hour calculation and trades through separate market infrastructure. CoinMarketCap

Is the Spotify Rally Sustainable?

Tuesday’s advance appears to reflect a combination of analyst support, bargain buying following Monday’s decline and relative strength outside the semiconductor sector not one breaking corporate announcement.

The rally could continue if Spotify maintains subscriber growth, protects its record margins and successfully converts new products into revenue. Nevertheless, its slight earnings and revenue misses show that investors will continue demanding strong cash-flow growth to support the valuation.

The next important evidence will come from Spotify’s third-quarter subscriber figures, operating-income performance and progress monetizing its expanding range of Premium products.

Nvidia Stock Sheds Up to $153 Billion. More Than Its Entire 2026 Profit

Nvidia stock fell more than 2% Tuesday, erasing as much as approximately $153 billion from the AI chipmaker’s market capitalization during a broad semiconductor selloff.

NVDA dropped to an intraday low of $218.69, down $6.32 from Monday’s closing price of $225.01. Multiplying that decline by Nvidia’s approximately 24.2 billion outstanding shares produces an estimated market-value loss of $152.9 billion.

The stock subsequently recovered to approximately $220.18 by 12:59 p.m. Eastern Time, reducing its session decline to 2.15% and its estimated market-cap loss to about $117 billion, according to Google Finance.

These figures fluctuate continuously while the stock is trading. However, at Tuesday’s intraday low, Nvidia had briefly erased more market value than it earned during its entire 2026 fiscal year.

Intraday Loss Exceeded Nvidia’s Annual Profit

Nvidia generated $120.07 billion in GAAP net income during fiscal 2026, an increase of 65% from the previous year.

Therefore, the company’s maximum intraday valuation loss of approximately $153 billion exceeded its record annual profit by almost $33 billion.

This comparison does not mean Nvidia lost $153 billion in cash or suffered an operating loss. Market capitalization represents the value investors collectively assign to a company’s outstanding shares. It can increase or decrease rapidly without changing the company’s cash balance, revenue or earnings.

Nevertheless, the comparison demonstrates the extraordinary valuation sensitivity of a company worth more than $5 trillion. A stock-price movement of less than 3% can create or destroy more paper wealth than Nvidia produces in annual profit.

According to Nvidia’s official fiscal 2026 results, full-year revenue reached $215.94 billion, while net income totaled $120.07 billion.

Why Nvidia Stock Is Falling

No major company-specific negative announcement appeared to trigger Tuesday’s decline.

Instead, Nvidia was caught in a widespread semiconductor selloff as investors reacted to rising Treasury yields, higher oil prices and renewed geopolitical uncertainty involving the United States and Iran.

The Philadelphia Semiconductor Index fell approximately 5.4%. It was on pace to erase more than $680 billion in combined market value if the losses held through the close.

Micron, SanDisk, Western Digital, AMD and several other chip-related companies recorded steeper percentage declines than Nvidia.

Higher Treasury yields can pressure highly valued technology stocks because they reduce the present value investors assign to profits expected many years in the future. They can also increase borrowing costs for companies funding large infrastructure projects.

The 30-year Treasury yield reached its highest level since 2007, while the 10-year yield remained near its highest point since January 2025.

Brent crude oil also climbed as fading expectations for an extended U.S.-Iran ceasefire revived inflation concerns. LSEG data cited by Reuters showed traders assigning a 96% probability to a 25-basis-point Federal Reserve rate increase before the end of 2026.

The session therefore appeared to represent a broader retreat from highly valued semiconductor stocks rather than a sudden deterioration in Nvidia’s underlying business.

Nvidia Earnings Become the Next Major Test

Nvidia will report its fiscal second-quarter results on August 26. The release will test whether the company’s rapid earnings growth can continue supporting its enormous valuation.

Management previously forecast quarterly revenue of approximately $91 billion, plus or minus 2%. The guidance assumes no Data Center computing revenue from China.

Nvidia’s first-quarter revenue reached $81.6 billion, representing an 85% increase from the previous year.

Data Center revenue climbed 92% to a record $75.2 billion, while the company maintained a non-GAAP gross margin of 75%.

Investors will focus on Blackwell demand, the Vera Rubin product roadmap, spending by major cloud providers and Nvidia’s ability to preserve margins as memory and other component costs rise.

Because of Nvidia’s $5.3 trillion valuation, even a small change in revenue growth, margins or forward guidance could trigger another market-cap movement worth hundreds of billions of dollars.

NVDAB Tokenized Stock Follows Nvidia Lower

Nvidia Tokenized bStock, trading as NVDAB, followed the underlying Nasdaq-listed shares lower.

At the time of reporting, Binance priced NVDAB at approximately $219.59, representing a 2.94% decline over 24 hours.

The token’s reported 24-hour trading volume stood near $8.9 million, while its circulating market capitalization was approximately $9.8 million.

NVDAB can temporarily differ from NVDA because the token trades through separate cryptocurrency-market order books and remains available beyond regular US equity-market hours. Its displayed percentage also reflects a rolling 24-hour period rather than Nvidia’s change from the previous Nasdaq close.

Tuesday’s selloff does not by itself indicate that Nvidia’s AI growth story has broken. The more important evidence will arrive on August 26, when the company’s results reveal whether demand and profit margins remain strong enough to support its historic valuation.

Cerebras Stock Plunges 13% Before Supernova as AI Growth Tests Profit Margins

Cerebras Systems stock plunged nearly 14% intraday Tuesday, erasing Monday’s powerful rally only hours before the AI chipmaker’s flagship Supernova event.

CBRS traded near $220.32 at 12:42 p.m. Eastern Time, down 12.56% from Monday’s closing price of $251.98. Shares touched an intraday low of $217.50, representing a decline of approximately 13.7%, according to Google Finance.

Cerebras had surged 15.1% on Monday as investors responded to growing interest in its ultra-fast inference technology, OpenAI relationship and upcoming product event. Tuesday’s low therefore erased the entire previous-session gain.

No new negative company announcement was apparent at the time of publication. The immediate pressure came from a broader semiconductor selloff, combined with profit-taking following Monday’s rally.

However, Cerebras’s larger decline highlights an underlying question: can the company convert rapidly expanding AI demand into profitable growth?

Semiconductor Selloff Hits Cerebras Stock

The Philadelphia Semiconductor Index fell approximately 5.4% Tuesday as rising bond yields and oil prices pressured highly valued technology stocks.

Nvidia dropped more than 2%, while AMD, Micron, SanDisk and SK hynix recorded considerably larger declines. Every component of the Philadelphia Semiconductor Index traded lower during the session.

Cerebras was not alone in falling sharply. Nevertheless, its nearly 14% intraday decline was substantially larger than the losses recorded by most large AI-chip companies.

Monday’s 15.1% advance likely made CBRS particularly vulnerable to profit-taking when sentiment across the semiconductor sector reversed. Reuters reported that higher Treasury yields and geopolitical concerns drove investors away from richly valued growth stocks.

Cerebras Faces a Cost-of-Success Problem

The more important long-term issue is the changing economics of Cerebras’s business.

Second-quarter cloud revenue nearly quadrupled to $126 million, while hardware revenue declined from $70.3 million to $54.1 million. The figures indicate that Cerebras is becoming more dependent on recurring cloud services and less reliant on one-time system sales.

That transition could produce more predictable revenue over time. However, operating AI infrastructure requires substantial spending on data centers, power and computing capacity.

Demand is currently growing faster than Cerebras can install its own infrastructure. To serve customers while expanding capacity, the company has temporarily rented computing systems previously deployed with other customers.

Management said those arrangements reduced its second-quarter adjusted gross margin by approximately five percentage points. The margin fell from 46.5% in the first quarter to 40.6% in Q2.

Cerebras therefore faces an unusual growth problem: customer demand is strong, but meeting that demand before its own infrastructure is ready temporarily increases costs.

Revenue Figures Require Additional Context

Cerebras reported second-quarter revenue of $180.11 million, representing growth of approximately 74% from the previous year but falling below the $194.23 million expected by analysts.

The company also reported approximately $209.9 million in “core” revenue. That company-defined measure excludes pass-through revenue and adjusts for warrant-related effects, explaining why some reports described Cerebras as beating revenue expectations while others reported a miss.

Cerebras raised its 2026 adjusted revenue forecast from between $855 million and $865 million to between $880 million and $890 million. It also increased its annual adjusted gross-margin outlook from 38%–41% to 41%–43%.

Those upgrades are positive, but Cerebras’s expected margins remain substantially below Nvidia’s mid-70% range. Investors are therefore watching how quickly Cerebras can improve the profitability of its cloud platform.

OpenAI Deal Creates Opportunity and Execution Risk

Cerebras is expanding its infrastructure to support a multiyear agreement with OpenAI reportedly valued at more than $20 billion.

The contract covers approximately 750 megawatts of AI inference capacity and represents a major commercial endorsement of Cerebras’s Wafer-Scale Engine architecture.

However, the agreement requires extensive data-center development before Cerebras can recognize all the associated revenue.

The company ended the second quarter with approximately $25.4 billion in remaining performance obligations and expects its revenue to more than triple in 2027. Remaining performance obligations represent contracted commitments that have not yet been recognized as revenue, rather than immediately available sales.

Cerebras must install the necessary systems, secure power and provide the contracted computing services before much of that amount reaches its income statement.

The OpenAI agreement therefore creates both an enormous growth opportunity and considerable execution risk.

Supernova Event Carries Greater Importance

Cerebras will hold its Supernova event on August 18. The company’s official page currently lists the livestream at 3:30 p.m.

The event includes a keynote from CEO Andrew Feldman, product presentations, customer case studies and demonstrations of Cerebras’s inference technology.

Investors will be watching for new systems, manufacturing updates and details about the company’s data-center expansion. Any evidence that Cerebras can increase capacity without further margin deterioration could help address the concerns reflected in Tuesday’s decline.

OpenAI recently selected Cerebras to power its GPT-5.6 Sol Ultrafast mode. The service can reportedly generate as many as 750 output tokens per second—up to 14 times faster than standard processing.

That performance demonstrates the appeal of Cerebras’s technology. The next challenge is proving that exceptional inference speed can also support durable profits.

CBRSB Tokenized Stock Reflects the Selloff

Cerebras’s tokenized stock, CBRSB, followed the underlying Nasdaq-listed shares lower.

CoinGecko showed CBRSB near $220.47, down approximately 13.4% over 24 hours. Total trading volume reached approximately $2.1 million, while the Binance CBRSB/USDT market accounted for about $777,000.

The figures differ from Binance’s general price-directory page,  which displayed $221.18 and a marginal 24-hour increase but carried an August 16 update timestamp. That older reading had not incorporated Tuesday’s equity-market decline.

CBRSB can temporarily differ from CBRS because it trades outside Nasdaq hours and uses separate cryptocurrency-exchange order books. In this case, however, the tokenized stock was broadly reflecting the underlying selloff.

For both CBRS and CBRSB, Supernova’s most important question is not whether Cerebras can produce exceptionally fast AI inference. It is whether the company can expand capacity, fulfill its OpenAI commitments and improve margins without allowing infrastructure costs to overwhelm revenue growth.

Nvidia Could Add $3.1 Trillion as BofA Reiterates $350 Target Before Earnings

Bank of America has reiterated its Buy rating and $350 price target on Nvidia, implying that the AI-chip leader could add approximately $3.1 trillion in market value if the bullish forecast proves accurate.

Nvidia shares traded near $220.12 Tuesday morning, giving the target approximately 59% upside. Based on the company’s roughly 24.2 billion outstanding shares, a $350 stock price would value Nvidia at approximately $8.47 trillion.

The recommendation is current, but the target itself is not new. Bank of America analyst Vivek Arya reiterated the forecast on August 17 after originally raising the target from $320 to $350 in May.

Why Bank of America Remains Bullish on Nvidia

Arya described Nvidia as a “unique, durable growth franchise” trading at approximately 18 times forward earnings—a valuation he characterized as a seven-year low.

The analyst believes investors are overestimating the effect of higher high-bandwidth memory costs while underestimating Nvidia’s pricing power, scale and approximately $119 billion in supply-chain commitments.

Bank of America estimates that the HBM content in each server rack could increase by approximately $200,000 to $300,000 as Nvidia moves from Blackwell to its Rubin platform. However, total rack prices could rise by between $2 million and $3 million to approximately $6 million to $7 million.

That difference could allow Nvidia to absorb rising memory costs while maintaining gross margins in the mid-70% range.

Arya also argues that competition from custom chips developed by Google, Amazon and Meta has not prevented Nvidia from expanding its position. Nvidia’s sales to hyperscale cloud customers reportedly increased 115% year over year—nearly twice the growth rate of overall cloud capital expenditure.

Bank of America expects Nvidia to capture more than 65% to 70% of long-term AI infrastructure spending, according to the latest summary of Arya’s research.

The $350 Target Was Established in May

When Bank of America established the $350 target in May, the firm also increased its estimate for the artificial intelligence infrastructure market.

The bank projected that the opportunity could reach approximately $3 trillion by 2030, up from its previous estimate of $1.7 trillion. It also raised its Nvidia earnings forecasts following the company’s stronger-than-expected fiscal first-quarter results.

Investors should therefore distinguish between two developments:

  • Bank of America originally raised its target to $350 on May 21.
  • The firm reiterated that target and its Buy rating on August 17.

The latest action confirms that the bank remains confident in its valuation before Nvidia’s next earnings report, but it is not a new target increase.

Nvidia Earnings Will Test the Bullish Forecast

Nvidia’s recent results support Bank of America’s long-term argument.

The company reported fiscal first-quarter revenue of $81.6 billion, representing an 85% increase from the previous year.

Data Center revenue climbed 92% to $75.2 billion, while Nvidia maintained a non-GAAP gross margin of 75%. Management forecast approximately $91 billion in second-quarter revenue, plus or minus 2%, without assuming any data-center computing revenue from China.

Nvidia will report its fiscal second-quarter results on August 26. Investors will focus on whether revenue exceeds the company’s guidance, the effect of memory costs on margins, demand from hyperscalers and progress toward the Vera Rubin rollout.

The results will also test Bank of America’s claim that Nvidia can preserve its pricing power as AI systems become more complex and expensive.

Nvidia Stock Falls Ahead of Earnings

Nvidia shares fell approximately 2.2% Tuesday morning as higher Treasury yields pressured semiconductor and other technology stocks.

The decline reduced Nvidia’s market capitalization to approximately $5.33 trillion. At that valuation, reaching Bank of America’s target would require the company to create more than $3.1 trillion in additional shareholder value.

The forecast remains ambitious. Risks include competition from custom AI accelerators, higher memory and infrastructure costs, export restrictions affecting China and a potential slowdown in spending by major cloud providers.

What the Forecast Means for NVDAB

Nvidia’s tokenized stock, NVDAB, should broadly follow movements in the underlying Nasdaq-listed shares.

However, temporary price differences can occur because NVDAB trades through cryptocurrency-market infrastructure and remains available outside regular US equity-market hours. Liquidity, spreads and rolling 24-hour performance calculations can also affect its displayed return.

Bank of America’s reiterated target provides a current bullish catalyst for both NVDA and NVDAB. Nevertheless, the August 26 earnings report—not the repetition of a target originally established in May—will provide the next major test of the $350 valuation thesis.