Home Blog Page 410

Japan’s FSA Proposes Mandatory Hack Loss Reserves for Crypto Exchanges

0

Japan’s Financial Services Agency (FSA) is preparing legislation that would require crypto exchanges to maintain liability reserves to safeguard users against losses from hacks or operational failures.

The proposal is expected to reach parliament in 2026. Under the planned framework, exchanges would be required to hold reserves similar to those mandated for traditional securities firms.

According to The Nikkei, these reserves currently range from ¥2 billion to ¥40 billion, depending on trading volume.

Previously, crypto platforms were exempt from such obligations because they store customer assets in offline cold wallets. However, the FSA now believes cold storage alone no longer provides sufficient protection as cyberattacks become increasingly sophisticated.

Stronger Customer Protections in Bankruptcy Cases

Alongside the reserve mandate, the FSA seeks to establish clearer procedures for returning assets in the event of an exchange collapse. Specifically, the proposed rules would permit court-appointed administrators to oversee customer payouts, reducing confusion and delays seen in previous bankruptcy cases.

These measures aim to bolster investor confidence and facilitate quicker resolution during insolvency events.

Security Breaches Drive Push for Tighter Regulations

Japan’s renewed focus on exchange safety follows a series of high-profile incidents. The most notable remains the 2014 Mt. Gox disaster, in which hackers stole 850,000 BTC. The repayment process, which began only in 2024, will continue until October 2026, symbolizing the industry’s past vulnerabilities.

More recent breaches have reinforced the urgency. In May 2024, DMM Bitcoin lost 4,502 BTC, about $305 million, after North Korean hackers compromised an employee connected to wallet provider Ginco.

Just last month, roughly $21 million in digital assets disappeared from addresses linked to SBI Crypto, with investigators identifying laundering activity through Tornado Cash and noting possible North Korean involvement. 

Together, these incidents have prompted regulators to push for a more robust protection framework.

Insurance Option Under Consideration

While reserve requirements could be costly, the FSA is exploring ways to reduce the burden on smaller platforms.

For instance, one approach under discussion would allow exchanges to purchase insurance instead of holding large cash reserves. Nevertheless, this proposal remains under review as policymakers refine the details of the new framework.

Additionally, the FSA is examining potential rules for companies providing crypto-management systems. In particular, these firms might be required to submit advance notices to regulators before offering services, a concept reported earlier this month by The Nikkei.

Finally, the regional threat landscape further underscores Japan’s regulatory push. According to Chainalysis’s mid-year 2025 update, the Asia-Pacific region has become the world’s second-largest target for crypto theft.

Among the countries most affected are Japan, Indonesia, and South Korea, thereby highlighting the importance of stronger domestic safeguards.

CoinMarketCap Puts XRP and Cardano in ISO 20022 Token Category

0

Leading crypto aggregator CoinMarketCap has added XRP and Cardano to its newly created ISO 20022 token category.

The newly created category on CoinMarketCap features crypto assets that claim alignment with the ISO 20022 global financial messaging standard. XRP leads the list with a market cap of $133.68 billion, followed by Cardano at $14.91 billion.

In addition to XRP and Cardano, CoinMarketCap’s ISO 20022 category includes nine other crypto assets, such as Chainlink, Stellar, Hedera, Algorand, and XDC Network, are also included in CoinMarketCap’s ISO 20022 category.

Together, the listed tokens hold a combined market valuation of $174.89 billion, with $8.48 billion in trading volume recorded over the past day.

Top ISO 20022 tokens by market cap

XRP and Cardano “Align with ISO 20022”

ISO 20022 is a financial messaging standard adopted by banks, payment networks, and major traditional financial institutions to enable richer, structured financial communications.

Its rising relevance has fueled ongoing debate within the crypto community about which digital assets meaningfully align with the standard.

Earlier this month, Cardano founder Charles Hoskinson shared an infographic outlining tokens that align with the ISO 20022 landscape and the roles they play. XRP featured for its utility in cross-border payments, while ADA stood out as the only smart-contract-focused asset on the list.

Commenting, Hoskinson emphasized that ISO 20022 is crucial for open banking and could help bridge the gap between decentralized and traditional finance.

Financial Institutions Embrace ISO 20022

Indeed, financial institutions around the world are rapidly adopting ISO 20022. Ripple became one of the first crypto-focused companies to join the ISO 20022 standards body in 2020, followed by other blockchain projects such as Stellar and Pi Network.

Beyond the crypto sector, major traditional financial institutions have also begun integrating the standard. Earlier this year, the U.S. Fed became a member and unveiled plans to require all participants using the FedWire Funds Service to adopt ISO 20022 for messaging.

Globally, the shift is accelerating, with estimates suggesting that nearly 80% of financial institutions will be using ISO 20022 by the end of the year.

ISO 20022 Goes Live — But Nothing Changes for XRP

Notably, ISO 20022 officially went live on November 22, ending SWIFT’s coexistence period with legacy MT messages. Despite years of hype from some in the XRP community, activity on the XRP Ledger remained unchanged, holding steady at about 22 transactions per second.

Experts have long emphasized that ISO 20022 is only a messaging upgrade, not a settlement system related to any cryptocurrency. This disproves recurring claims that the standard would “force” banks to use XRP.

Former Ripple developers and XRPL validators reiterated that XRP has no special status under ISO 20022. Ripple’s CTO has previously clarified the same.

XRP Showing Signs of Recovery but Ichimoku Cloud Puts Resistance at Crucial Level

XRP shows signs of recovery as momentum improves, but stiff resistance exists on the upper end of its daily Ichimoku Cloud.

XRP is showing steady upward momentum this week, posting a 1.5% gain over the past 7 days as it continues to recover from recent market volatility. The latest 7-day chart reveals a strong rebound from sub-$2.00 levels, with XRP climbing back toward the upper end of the range. Over the past 24 hours, XRP has traded between $2.06 and $2.28, demonstrating increased buying pressure as bulls attempt to regain control.

The price action shows a clear shift in sentiment: after an early-week decline, prices have been steadily trending higher, forming a series of higher price levels, although key resistance levels are yet to breach. This positive ascent has left analysts and traders watching closely for confirmation of a sustained breakout.

XRP Price Analysis

On the technical end, the latest XRP daily chart shows the token attempting to regain bullish momentum after a sharp mid-November sell-off, but several key technical signals suggest XRP is still at a critical juncture. Looking at the Ichimoku cloud, the price remains below the cloud, which means it is acting as overhead resistance. 

XRP 1D Chart
XRP 1D Chart

The lower boundary of the cloud sits around $2.24, while the upper boundary extends toward $2.38. As long as XRP trades below this zone, it serves as the resistance the crypto asset needs to breach to reach levels like $2.8.

If the resistance is stiff enough, XRP will test support at $2.06, where the Tenkan-sen (blue line) is based. However, for further confirmation of the upward momentum, the Tenkan-sen line must flip above the Kijun-sen (red line).

Despite this overhead resistance, early signs of momentum improvement are emerging. The RSI (14) is currently at 47.83, recovering from oversold territory but still below the neutral 50 level. This indicates weakening bearish momentum, though not yet enough to confirm a shift toward bullish control. A move above 50 would signal strengthening buying pressure and support the case for a breakout attempt.

XRP Liquidation Data

Meanwhile, the XRP liquidation data reveals a clear shift in market dynamics, with traders on both sides facing significant wipeouts. Short positions are however taking increasingly heavy losses over longer timeframes.

Screenshot 2025 11 25T173608956
Coinglass

Over the 4-hour period, liquidations climbed to $989.38K, and while longs still accounted for a larger share ($547.12K), short liquidations increased substantially to $442.26K, showing stronger two-sided volatility.

The shift becomes more pronounced in the 12-hour window, where total liquidations hit $3.13M, and short positions suffered nearly half a million dollars in liquidation, indicating that sellers betting on downside began getting squeezed as XRP recovered.

The most telling data appears in the 24-hour period, where XRP saw a massive $13.54M in liquidations. Critically, shorts absorbed the majority of the damage, with $8.66M liquidated compared to $4.88M from longs. Overall, the liquidation profile suggests that bearish traders are increasingly being forced out of their positions.

Bitcoin Is Trading Below Its Yearly Open—Here’s How Much It Has Collapsed

0

It has been a volatile year for Bitcoin, as the coin has relinquished all its gains and is now trading below its yearly opening price.

Bitcoin has steadied above $87,000 after a period of massive price capitulation. The apex cryptocurrency retreated to a multi-month low of $80,620 on November 21 but has since recovered to its current market price of $87,551, marking an 8.6% increase in four days.

Still Below Yearly Opening Price

Despite this positive price action, Bitcoin remains in the red on a longer timeframe. BTC has corrected by 4.17% in the past seven days and 22.7% over the course of the last 30 days.

Furthermore, the cryptocurrency has retraced by 6.31% from its yearly opening price of $93,455, per TradingView data. Meanwhile, it was trading 8% below the mark when CryptoQuant verified author JA Maartunn called attention to the bearish price action in an X post on Tuesday.

Notably, the chart shows that Bitcoin has trended more above the yearly opening price than it has done below. Before the recent drop, BTC only stayed below $93,455 between late February and April. Aside from this, the asset had remained largely profitable to holders who bought at the start of the year.

Bitcoin and Ethereum YTD Change

Ethereum also shares a negative year-to-date performance, but with a much larger downside than BTC’s. The second-largest cryptocurrency by market cap is down 16% YTD, according to Maartunn, and 12.1%, according to CoinMarketCap data at the time of writing.

Additionally, the margin widens further across most of the other top 10 cryptocurrencies by market cap, though there are exceptions. Solana, Dogecoin, and Cardano have dropped by 27.8%, 52.6%, and 50.7% from their opening prices at the start of the year. Notably, the exceptions are XRP, BNB, and Tron, which have recorded YTD growth of 6.8%, 21.5%, and 7%, respectively.

With this in view, the analyst concluded that it has been a volatile year. Recall that Bitcoin once posted a 30% year-to-date gain at its all-time high of $126,220 in October, before bears took over the market and dragged prices much lower.

Bitcoin Open Interest Drops 15% Post October 10 Crash

Analyst Rand identified in a separate tweet that Bitcoin open interest has continued to wither since the historic October 10 crash. The post, citing data from Checkonchain, shows a 15% drop in BTC futures OI, from $68 billion to $58 billion. This suggests that over $10 billion has been liquidated since then as market uncertainties have heightened.

Bitcoin Futures OI/Checkonchain

Meanwhile, data from Coinglass suggests a steeper decline in OI. As of October 10, the exchange BTC futures OI stood at $90.24 billion. Currently, this metric stands at $60.53 billion, showing a wipeout of $29.71 billion (32.9%).

Remarkably, analysts see this as a bullish indicator for Bitcoin. A decline in open interest alongside prices suggests market leverage unwinding. Historically, this precedes a potential trend reversal.

Top Trader Says Shiba Inu Is Also Breaking Out

0

Shiba Inu is attempting a reversal after several weeks of steady decline, with fresh momentum emerging on the charts.

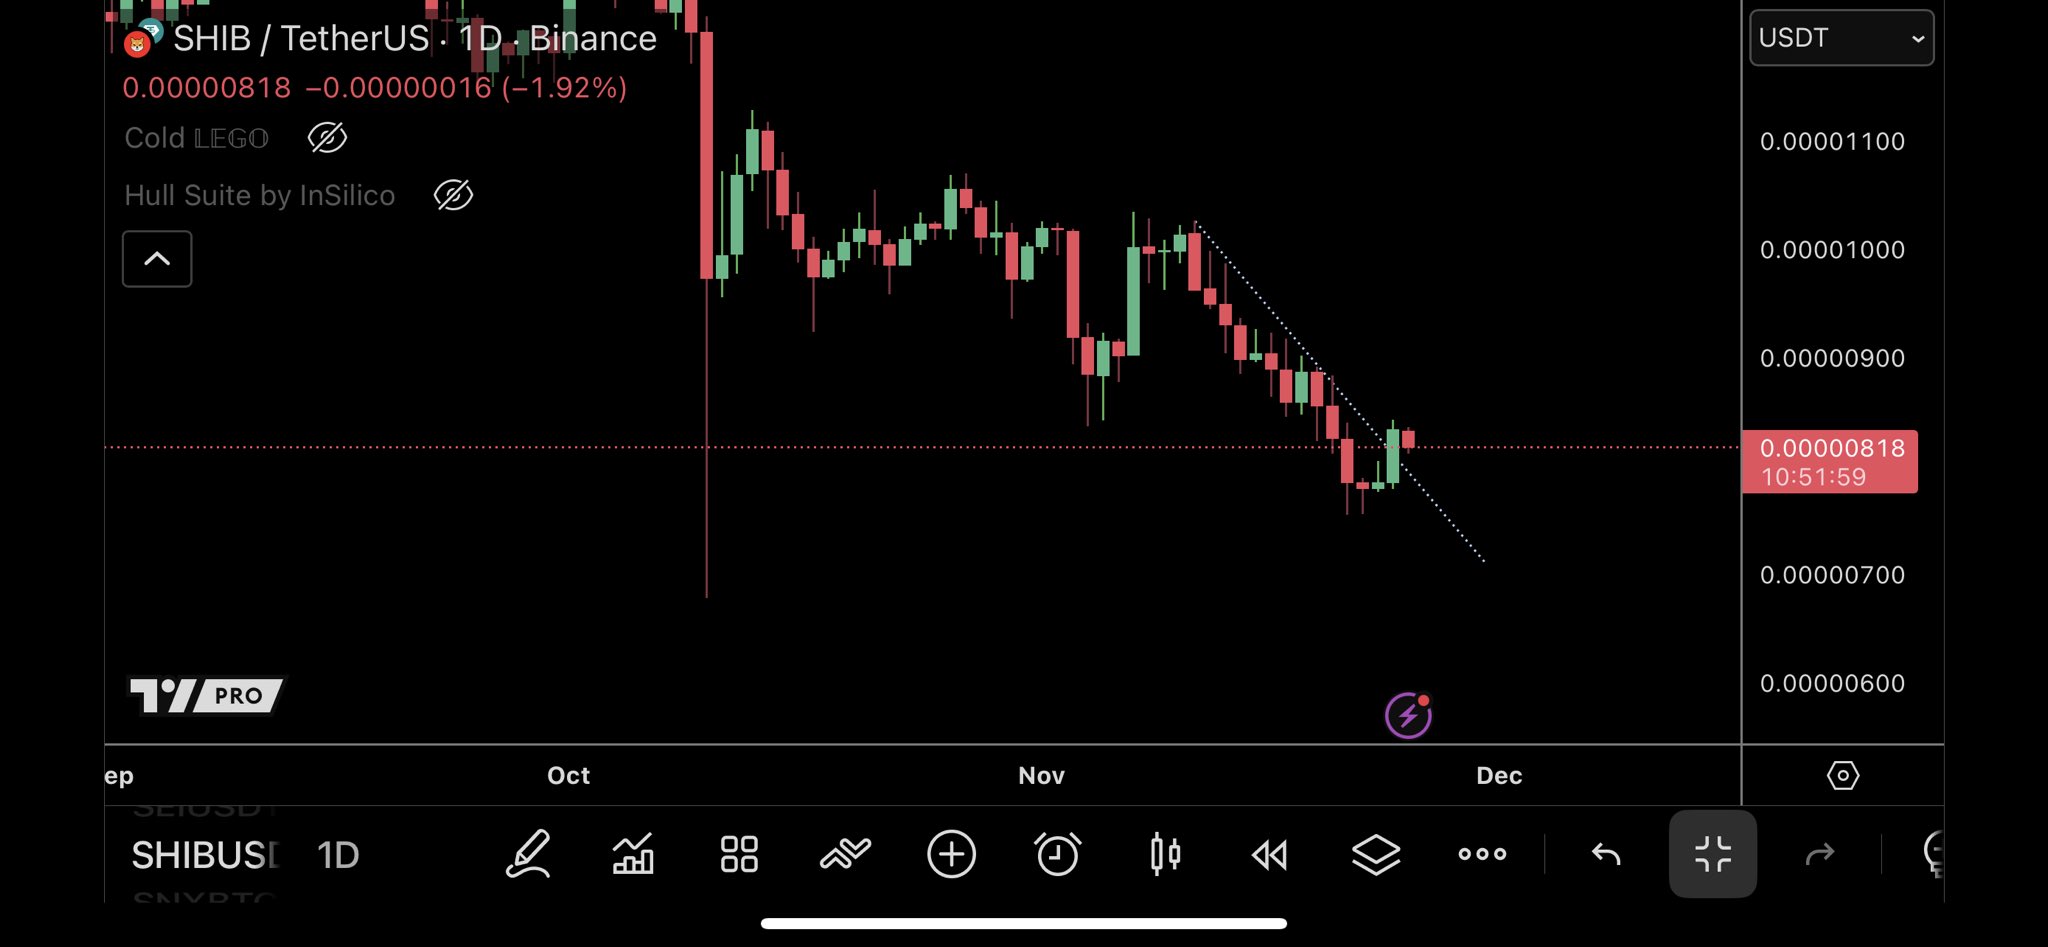
According to market analyst TraderSZ, SHIB is “also breaking out,” suggesting that the token could soon enter a sustained uptrend. Notably, this observation comes amid the ongoing relief rally in the crypto market after Bitcoin briefly touched $89,000 earlier today. 

Shiba Inu is among the altcoins benefiting from the Bitcoin-led rebound, as the SHIB price has surged 4% today to $0.00000814 after having dropped to $0.00000678 last week.

SHIB Breaks Its Downtrend Line

For most of November, Shiba Inu traded within a downward structure, forming lower highs and lower lows. However, recent price action shows SHIB pushing above its descending trendline, suggesting that buyers are beginning to regain control.

The breakout follows a brief period of consolidation near the $0.000007 region. SHIB has now moved above the diagonal resistance for the first time in several weeks, giving traders a reason to reassess its near-term outlook.

Shiba Inu chart by TraderSZ

A Possible Shift in Momentum

While the move is still early, breaking above a well-defined trendline is often the first sign of a market shift. SHIB’s price behavior indicates that the downtrend is weakening and momentum may be tilting in favor of a short-term recovery.

Market participants often watch for such breakouts to identify trend exhaustion, especially since Shiba Inu has been in a long-standing downtrend. For context, Shiba Inu lost the $0.00001 price level in October and has struggled to reclaim it since.

Now, if Shiba Inu maintains the current breakout and prints a higher high next, analysts may begin calling for a bigger upside move. At the moment, TraderSZ has not provided a specific price outlook for Shiba Inu during this breakout.

Shiba Inu Market Context Today

Shiba Inu’s price action comes at a time when several altcoins, including Dogecoin, are attempting to recover from recent sell-offs. Whether SHIB can build on this momentum depends on the broader market remaining bullish and attracting stronger buying interest.

Should a major uptrend emerge, several analysts have shared various outlooks on how high SHIB’s price could climb.

Other Analysts’ Views on SHIB Price Targets

Last week, analyst Kledji Cuni said Shiba Inu was nearing a key support level around $0.0000067, a zone that has historically marked cycle bottoms and sparked rebounds. Cuni mapped possible upside targets at $0.0000170, $0.0000320, and $0.0000420. This represents gains of roughly 150% to 500%.

Other analysts are also optimistic. Shib Knight views the current low price range as a quiet accumulation zone and plans to continue DCAing if market conditions remain steady.

Swallow Academy notes that SHIB must break the $0.000011–$0.000012 resistance region, with the $0.00001256 200-day EMA as the next major challenge. MMBT Trader adds that clearing $0.00001270 could spark a rally of up to 94%.

U.S. PPI for September Rises 0.3%: Here’s the Potential Impact on Bitcoin

0

Bitcoin could respond favorably, as the latest U.S. Producer Price Index report for September shows a firmer rise in wholesale inflation. 

The PPI, which tracks how much domestic producers charge for goods and services and often signals future consumer inflation, increased 0.3% from August to September. This matched economists’ forecasts and reversed the 0.1% drop recorded the month before, with Bitcoin (BTC) recovering above $87,000 minutes after the release.

U.S. September PPI Rises 0.3% from August

Notably, energy costs drove most of the monthly gain. Specifically, prices for energy goods jumped 3.5%, accounting for roughly two-thirds of the total increase in the goods category. Food prices also moved higher with a 1.1% rise, and goods excluding food and energy posted a smaller 0.2% gain. 

On a yearly basis, the headline PPI rose 2.7%, the same pace as August and slightly above the 2.6% estimate from a Reuters poll. These figures show that producers faced higher input costs, especially for fuel and certain commodities, which could translate into slightly more expensive travel or heating this winter. 

Despite this, the stable year-over-year reading indicates that wholesale inflation is not accelerating in a way that threatens the broader economy.

Meanwhile, the core PPI, which removes the more volatile food and energy components, presented a calmer picture. Specifically, core prices increased only 0.1% for the month, coming in below the 0.3% that analysts expected. 

Essentially, while the headline number looked firmer, the base of inflation continued to cool. This combination reassured investors that inflation is slowly moving toward the Federal Reserve‘s 2% target without slowing economic activity. 

Potential Impact on Bitcoin

As a result, traders increased their expectations for an interest rate cut at the Fed’s December meeting. The softer core reading helped push those odds higher by easing concerns about overheating, even with volatile energy prices and ongoing tariff effects.

Notably, for Bitcoin and other risk assets, this setup creates a slightly more favorable picture. For context, a clearer path toward a December rate cut supports liquidity and could lift appetite for assets with higher risk. 

Moreover, if inflation stays somewhat sticky while the Fed leans toward easing, Bitcoin could also benefit from renewed interest in its inflation-hedge appeal over the medium and long term.

Meanwhile, the report arrived during a difficult stretch for Bitcoin. Prices have struggled since the sharp market drop on Oct. 10. Bitcoin has fallen 25% since Oct. 13 and has lost 20.68% so far this month. With this decline, it is on track for its weakest monthly close since the 37% plunge in June 2022 during the Terra-related crash. 

Bitcoin now trades around $87,101, battling to reclaim the $90,000 and $100,000 psychological levels. However, the latest PPI report could help with relief efforts. Rising expectations for a December rate cut give Bitcoin a slightly stronger macro environment in the coming weeks, especially when considering the imminent end to QT.

Dave Portnoy Says ‘Imagine Not Buying XRP Dip’ as His $1M XRP Position Turns Profitable

0

Famous crypto trader Dave Portnoy is back, celebrating his bold XRP dip-buying and saying he could never sit out the recent market drop.

His comment comes just days after he accumulated $1 million worth of XRP during last week’s steep downturn. Now, the move has already turned profitable as XRP rebounds.

XRP Rebounds Strongly After Falling to $1.83

XRP is trading at $2.21, up 7.44% in the past 24 hours and back in positive territory for the week with a 2.33% gain.

Last week’s sell-off briefly sent XRP down to $1.83, creating the exact environment Portnoy described as a “blood in the streets” moment. The recovery has now placed his million-dollar XRP position in the green.

Portnoy’s Dip Buy Pays Off Sooner Than Expected

On November 17, Portnoy executed a rapid series of buys during the market crash:

  • $500,000 in XRP at 6:36 PM
  • $750,000 in Bitcoin at 6:37 PM
  • $400,000 in Ethereum at 6:37 PM
  • Another $500,000 in XRP at 6:38 PM

This brought his total XRP purchase to $1 million, making it his largest allocation during the dip. At the time, Portnoy framed the opportunity as too obvious to ignore. Eric Trump even praised the transactions as a “smart trade.”

Today’s XRP rally appears to validate that stance, at least in the short term.

“Imagine Not Buying the Dip—Couldn’t Be Me”

Notably, XRP traded as low as $2.1182 on the day Portnoy executed his $1 million acquisition. Over the next few days, his position turned negative as the coin dropped below $2. At one point, the $1 million portfolio was worth just over $860,000, after XRP touched $1.83.

With XRP climbing, Portnoy posted a short message on X celebrating the turnaround, saying it was hard to imagine sitting out such an opportunity. 

The ongoing XRP rally follows a broader market rebound, led by Bitcoin’s recapture of the $89K level earlier today. The move lifted the whole market, which now sits above $3 trillion after having dipped to $2.8 trillion last week.

Meanwhile, XRP’s price momentum is further supported by ongoing ETF launches. Yesterday, XRP ETF products from Grayscale and Franklin Templeton went live, seeing debut inflows of over $120 million.

Comeback After Earlier XRP Missteps

Portnoy’s renewed success with XRP comes months after he lamented panic-selling $3 million in XRP during a misinterpreted scare earlier this year. He had intended to hold through volatility but exited at $2.40, only to watch the asset rise to $3.65 shortly after—a moment he described as making him “sick.”

His latest accumulation and the profit it generated contrast with that earlier episode, suggesting he is determined not to repeat the same mistake.

Major Whale Reenters Ethereum Market with $44M Long

0

A well-known Bitcoin whale has returned to high-stakes trading with a sizable Ethereum position, adding fresh momentum to a market that is only beginning to recover.

According to on-chain data, the trader known as “1011short” deposited $10 million in USDC to the decentralized exchange Hyperliquid before opening a 5x leveraged long position. The move created a $44.15 million exposure backed by 15,000 ETH, marking one of the whale’s largest recent trades.

The entry price for the position was $2,945.83 per ETH, placing the wallet slightly in the red as Ethereum hovers near $2,896. This leaves the position with an unrealized loss of over $38,000. The trade remains active, with a liquidation level of $2,326.6, providing the whale with a sizable buffer amid current volatility.

Market Shows Signs of Rebound After Recent Sell-Off

The whale’s re-entry comes at a moment when the broader crypto market is starting to regain stability. Bitcoin reclaimed the $89,000 level today and is up 1.37% over the past 24 hours. Even so, the asset remains more than 20% below its peak last month, highlighting the depth of the recent correction.

This improving sentiment has also lifted major altcoins. Solana climbed to $137.88, posting a 5.6% daily gain, while XRP rose 8.59% to $2.23.

Liquidations Spike as Prices Rebound

The market’s sharp swing back into positive territory triggered a significant wave of liquidations, particularly for bearish traders. Data from Coinglass shows that $337.86 million in leveraged positions were liquidated in the last 24 hours.

Indeed, the rapid price movements caught many traders off guard, particularly those positioned against the rebound. A total of 112,021 traders were liquidated during this window, with short sellers suffering the heaviest losses.

Nearly $233.05 million in short positions disappeared as prices reversed upward. Meanwhile, long traders also felt some pressure, albeit to a lesser degree, with losses of $104.81 million.

Notably, the largest single liquidation occurred on Hyperliquid DEX, where an $8.61 million BTC-USD order was wiped out.

Crypto Liquidations
Crypto Liquidations

Bitcoin and Ethereum Lead Liquidation Totals

Reflecting their dominant market positions, Bitcoin and Ethereum accounted for the bulk of these losses. Bitcoin saw $119.17 million in liquidations, while Ethereum followed with $73.34 million.

Overall, these totals highlight continued aggressive use of leverage across the top two cryptocurrencies, even amid heightened uncertainty.

Analyst Says XRP To Surprise Everyone As Current Drop is to Transfer Wealth from Impatient to Patient

0

An analyst who correctly predicted the previous XRP rally now suggests that the current downturn is a way to transfer wealth from the impatient to the patient.

For context, XRP has been a victim of bearish pressure over the past few weeks despite demonstrating impressive resilience during this period. Over the last seven weeks, XRP has experienced six bearish closes, with the week starting October 20 being the only exception, recording a 10% gain. Within this period, the price has dropped more than 23% despite an 8% jump this new week.

XRP Seeing Bearish Pressure

Notably, this discouraging performance, which follows a broader market downturn, comes despite the launch of XRP ETFs. These products, which have cumulatively seen $586 million worth of inflows since Nov. 13, have done little to help the XRP price situation, with XRP now down 11.86% this month.

However, MichaelXBT, a well-known market analyst, believes this downtrend represents an important opportunity for savvy investors. In his latest market commentary, Michael highlighted how he correctly predicted the most recent explosive surge from XRP.

For context, in July 2024, when XRP consolidated around $0.58, Michael noted that the altcoin was trading within a large 7-year bull pennant, the longest he had seen. He suggested that XRP could witness one of the most decisive breakouts from this structure. This breakout occurred, as XRP soared 632% from $0.5 in November 2024 to $3.66 in July 2025.

Transfer of Wealth from the Impatient to the Patient

Now, XRP has again entered a consolidation, leading to bearish sentiments among investors, similar to the trend observed last year. Speaking on this, Michael confirmed that several market participants have again begun losing faith in XRP. However, he claimed that this loss of confidence was the primary aim of the ongoing downtrend.

Notably, due to the drop in confidence, some investors have begun selling off their holdings. Specifically, Glassnode confirmed in August that profit-taking volume among long-term XRP holders surged to $375 million on July 24. This represented an 8-month high.

However, while some investors with less conviction have taken to selloffs, others appear to be accumulating the tokens. The Crypto Basic discovered a few days back that large XRP whales had added $7.7 billion in XRP to their balances since August. 

Michael believes this pattern demonstrates what’s happening in the market today. According to him, the ongoing downtrend presents an opportunity for wealth to transfer “from the impatient to the patient.” 

MichaelXBT on X
MichaelXBT on X

The market pundit suggests that the pattern that played out in the build-up to XRP’s November 2024 breakout could be emerging again. Notably, during this period, XRP underperformed for months, leading to selloffs while others accumulated, before breaking out. Michael argued that “XRP is ready to surprise everyone again.”

However, he chose to hold off on any XRP price predictions in his latest commentary. Meanwhile, four months back, he claimed that the next XRP leg up would be “parabolic.” Weeks later, MichaelXBT argued that XRP would not remain below the $4 mark for long.

Expert Says Dogecoin Bullish Reversal Imminent as Grayscale DOGE ETF Goes Live

0

An analysis suggests that the launch of the Dogecoin spot ETF in the US market would trigger a price recovery, potentially leading to new heights.

Notably, this Dogecoin price prediction comes from Crypto Rand, a widely followed market commentator and investor. He foresees a price recovery for the dog-themed, light-hearted meme coin, citing ETF hype and bullish technical developments as catalysts.

Dogecoin Eyes Breakout

Notably, Rand shared a chart showing that DOGE has been trading below a descending trendline on the 3-day timeframe since October 7’s high of $0.268. However, recent momentum suggests the price suppression could be nearing its end.

Dogecoin Rebound Imminent/Rand

After a lower price rejection on November 21, the meme coin has shown signs of life, rallying 13% from $0.132 to the current trading level of $0.150. Notably, this aligns closely with the tip of the resistance trendline, suggesting a breakout is on the horizon.

The chart highlights subsequent supply zones where DOGE would reach upon breakout. Specifically, this includes $0.170, $0.271, and December 2024’s high of $0.484, representing a 13%, 80%, and 222% growth, respectively.

Meanwhile, such outbursts have occurred before, leading to a surge in Dogecoin’s price. One happened when DOGE broke out from a similar descending trendline, which formed from May’s high of $0.245. The token defied the resistance in late June, rallying 90% from $0.151 to a high of $0.288 in July.

From Joke Coin to Wall Street

Rand identified the newly launched Grayscale Dogecoin ETF as a potential driver of the rebound. Notably, the product went live yesterday, paving the path for institutions to easily gain exposure to the meme coin.

The product launched on the NYSE Arca under the ticker GDOG on Monday. However, it failed to impress as several analysts expected. On its first day, it recorded zero net inflows with a trading volume of $1.41 million, far below the $12 million projection from Bloomberg ETF analyst Eric Balchunas.

Nonetheless, its launch alone is symbolic for Dogecoin, which, according to Rand, moved from a joke coin to Wall Street adoption. NovaDius Wealth president Nate Geraci also shares a similar sentiment, predicting that the ETF will already be a top 10 ticker symbol.

More Dogecoin ETF Launch Imminent

Meanwhile, prominent asset manager Bitwise has also revealed that its Dogecoin ETF is nearing its market debut. The firm confirmed in a recent tweet that the Bitwise Dogecoin ETF is “coming soon.”

Notably, analysts expect the investment vehicle to launch on November 26, which aligns with the delay amendment launch date. For perspective, Bitwise filed an amended S-1 filing with the US SEC on November 6, with a 20-day automatic approval window.

This means that the Bitwise DOGE ETF would launch on the NYSE Arca tomorrow if the US SEC does not intervene.