Home Blog Page 413

Expert Says Fear Always Hits Those Who Don’t Understand What It Means to Hold XRP

0

Fear has returned to the XRP market as prices continue to fluctuate, and according to Black Swan Capitalist founder Versan Aljarrah, the latest wave of panic is no surprise. 

He argues that fear always strikes those who don’t fully grasp the realities of holding XRP. To him, this is especially true when volatility intensifies, and market conditions appear engineered to shake out weak investors.

Fear Returns as XRP Trades in a Heavy Downtrend

Notably, XRP has been struggling to regain momentum after slipping below the crucial $2 support level. The asset recently touched lows around $1.84 before rebounding, extending a correction that began after XRP reached its yearly peak of $3.67 in July.

The decline initially accelerated in early October, when a tariff fallout between the U.S. and China triggered a broad market crash. Billions were liquidated across exchanges, and XRP recorded wildly different lows on different platforms.

Kraken data showed a drop to $1.40, while Binance charts on TradingView captured an even deeper flash low at $0.77. Analysts believe these violent moves created liquidity gaps, including one around $1.98 to $1.99, which XRP has now revisited.

Some traders frame the current price zone as a rare “early Black Friday sale,” warning that the discount may not last if a rebound begins soon.

The Psychological Challenge: Why Many Can’t Hold XRP

Aljarrah says holding XRP can be tough because its price often tests investors’ patience. It tends to underperform for long stretches before suddenly rallying.

For example, in 2017, XRP stayed flat for months before soaring by more than 70,000%, then later dropping by 95%. In 2024, it traded slowly for most of the year before jumping more than 600% near year-end.

These slow periods make many investors sell too early, just before big gains. Aljarrah notes that understanding XRP’s fundamentals, like Ripple’s work on global payments and liquidity, makes holding it a strategic choice rather than an emotional one.

“Engineered Volatility” and Market Shakeouts

In reference to the latest market drop, Aljarrah warns that engineered volatility is to push out investors who lack conviction. Many sell when fear spikes, especially during sudden crashes like those in October.

Analysts note that the real challenge is not just surviving downturns, it’s resisting the urge to take profits when XRP hits big numbers.

Where XRP Could Go From Here

XRP is currently trading at $2.07, up 1.5% in the last 24 hours. Analysts are projecting a rebound to $4 by 2026. Some longer-term targets include $13 and $27. On the downside, support levels are $1.91, $1.73, and $1.55 if fear persists.

Anthony Pompliano Explains on CNBC Why Bitcoin May Be Close to a Bottom

0

Bitcoin has dropped 22% this month, causing anxiety among new investors.

Meanwhile, longtime crypto supporter Anthony Pompliano says it’s a normal part of Bitcoin’s cycle.

Speaking on CNBC, he noted that Bitcoin has seen 30% drops 21 times in the last 10 years, with seven of them over 50%.

Pompliano says this kind of volatility is normal for Bitcoin and mainly surprises people coming from traditional finance. He views the current 33% fall from its all-time high as a “healthy reset,” caused by changes in who holds Bitcoin and year-end trading pressures.

Why He Believes the Market May Be Near a Bottom

Pompliano pointed to several signs suggesting Bitcoin could be stabilizing. Among the strongest is extreme sentiment data.

Specifically, the Fear and Greed Index recently plunged to 8 for Bitcoin and 6 for equities, levels he described as “very, very rare”. “You can’t stay there that long,” he said.

Pompliano added that fear-driven conditions typically signal that leverage has already been flushed from the market. According to him, open interest and leverage levels were far more elevated in early October, right before widespread liquidations.

With high-risk positions wiped out and sentiment crushed, he believes the market may now be forming a base. He expects a period of sideways movement followed by a gradual grind higher over the next several weeks.

Screenshot 2025 11 24 at 44151 pm
Bitcoin and crypto greed index

Role of Volatility as Bitcoin Matures

Pompliano also pointed out that Bitcoin’s volatility has dropped a lot over the past two years. Quoting VanEck’s Matt Seigel, he said that if volatility is “cut in half,” then big price drops might shrink too.

Instead of the historic 80% crashes, Bitcoin may now see pullbacks around 40%, which matches the current 30–37% drop. Lower volatility might mean less dramatic bull runs, but it could also make future crashes less severe.

“Volatility is actually a strong signal,” he said. “You need volatility for the asset to go up.”

“I’m Buy More Bitcoin”

Interestingly, Pompliano said that despite Bitcoin’s ups and downs, he has increased his holdings every year, including this one. He expects Bitcoin to keep outperforming stocks, even with slower growth, noting that a 20–35% annual return would still make it a top long-term investment.

He called Bitcoin the “category winner” in crypto, pointing out that Wall Street adopted it first and still invests heavily. While other cryptocurrencies like Ethereum and Solana have fallen more, he believes Bitcoin remains the main store-of-value and “will continue to be the king of the crypto market.”

Expert Explains How a Small XRP Price Move Could Trigger Market volume Frenzy

0

XRP community pundit Chad Steingraber has identified how he believes XRP ETFs could “influence market dynamics.”

Notably, discussions across the XRP community have centered on newly launched XRP exchange-traded products, mainly because these funds have attracted substantial inflows in a very short time. Analysts believe these inflows will soon impact XRP’s price behavior.

XRP ETFs Seeing Early Success

For context, the conversation gained steam after Canary Capital introduced its XRPC fund on Nov. 13. Interestingly, the product drew strong interest immediately, having observed more than $306 million in net inflows within seven trading days. 

Bitwise also launched its own XRP fund on Nov. 20, and it has gathered over $116 million in just two days. Together, these two products recorded $422 million in cumulative inflows. This has strengthened the speculation that institutional activity around XRP is picking up quickly.

Moreover, Grayscale plans to debut its XRP-focused product, GSOL, which could bolster the inflow momentum. With three major products attracting substantial capital influx in the same month, community members believe that these inflows will eventually show up in XRP’s price action.

Software engineer and long-time XRP advocate Chad Steingraber is one community figure who has persistently pushed this narrative. He has always maintained that these funds could increase liquidity and lead to XRP price spikes.

How XRP ETFs Could “Influence Market Dynamics”

In his latest commentary, Steingraber highlighted a third party’s view, which suggested that these products could expand liquidity, boost trading activity, and “influence market dynamics.” The pundit presented one way through which the ETF products could actually “influence market dynamics.”

To do that, he talked about XRP’s weekly price close and how a higher opening price could lead to FOMO among ETF participants. Specifically, XRP ended Friday’s trading session around $1.9490, when the traditional market closed for the week. 

Steingraber said that if XRP opened the following Monday at about $2.10, roughly twenty cents higher, ETF shares would immediately gain value because of the way they are structured. He noted that each fund assigns between ten and twenty XRP to each share. As a result, even a small increase in XRP’s opening price would produce a noticeable jump in the value of each share. 

He suggested that such a jump could trigger investor excitement and create a rush of ETF trading as fear of missing out spreads. According to him, repeated price lifts at the start of each week could eventually help these XRP ETFs “influence market dynamics,” since traders would react more aggressively to those early-week moves.

Notably, XRP did open the new week higher, although not at the level Steingraber described. The token began Monday at $2.04, which marked an increase of $0.091 from its Friday close. While the price did not reach the $2.10 mark, the higher opening could still lead to spikes in ETF shares at open.

Grayscale XRP ETF Officially Begins Trading on NYSE

0

The Grayscale XRP ETF has now begun trading on NYSE Arca, giving investors a new way to gain exposure to XRP through a regulated market product. 

Grayscale, which manages $35 billion in assets, announced the launch today through a press release and called the debut a meaningful step in widening access to the XRP ecosystem.

The Grayscale XRP ETF Begins Trading

Grayscale explained that the product trades under the ticker GXRP and functions as an exchange-traded product rather than a fund governed by the Investment Company Act of 1940. As a result, the Grayscale XRP ETF does not follow the same rules that guide traditional ETFs and mutual funds. 

Krista Lynch, who leads ETF Capital Markets at Grayscale, said the Grayscale XRP ETF seems to give investors simple and efficient access to XRP. She also highlighted that the launch reflects the company’s larger effort to open up digital assets to a wider audience.

In its press release, Grayscale spotlighted the background and strengths of the XRP Ledger. The company pointed out that the network launched in 2012 and has already processed more than 4 billion transactions. 

According to Grayscale, developers built the XRP Ledger to support fast cross-border payments and modern financial services. The company added that XRP serves as the network’s native asset and powers transaction fees, liquidity functions, and currency bridging. 

Growing List of XRP ETFs

Notably, the Grayscale XRP ETF first appeared as a private placement in September 2024, but its public listing arrived at a time of rapid growth for XRP-related market products. The launch makes GXRP the third spot XRP ETF introduced since mid-November.

Specifically, Canary Capital released the first of these products, XRPC, on Nov. 13. Impressively, the product brought in $243 million on its first day and has reached $306 million in inflows after seven trading sessions. 

Bitwise entered the market a week later, launching its own ETF, named XRP, on November 20. The ETF attracted $105.36 million on the first day and another $11.28 million the next day. Combined, both products have now pulled in $422.66 million as of press time, which shows how much demand the market currently holds for XRP exposure.

Now, analysts expect the Grayscale XRP ETF to lift these inflow numbers even further because of Grayscale’s reach and long-standing presence in the digital-asset market. Franklin Templeton also plans to join the competition soon with its own ETF, XRPZ, which will list on the NYSE. The Canary Capital CEO expects these products to rake in $5 to $10 billion in their first month.

Bitcoin and Ethereum Lead $1.94B Exodus in Third-Largest Outflow Run Since 2018

0

Amid last week’s broad market sell-off, crypto investment products, particularly those tied to Bitcoin and Ethereum, recorded $1.94 billion in combined outflows. 

Last week marked another difficult stretch for the broader crypto market, with major assets suffering steep declines. Bitcoin plunged to a multi-month low of roughly $80,600, while Ethereum slipped to around $2,600, reflecting the heightened volatility that gripped the sector. Much of this downturn was fueled by sustained withdrawals from crypto investment products.

Crypto Investment Products See Third Largest Outflow Run Since 2018 

According to a new report from CoinShares, digital asset investment products recorded more than $1.94 billion in outflows over the past week, underscoring the depth of bearish sentiment among institutional investors. 

The outflows extended the losing streak for crypto investment products to a fourth consecutive week, bringing the four-week total to $4.92 billion. Notably, this four-week total marks the third-largest outflow run for crypto investment products since 2018.  

Bitcoin and Ethereum Lead Outflows 

The report identified Bitcoin and Ethereum as the top assets that suffered the highest outflows. While Bitcoin experienced roughly $1.27 billion in outflows, Ethereum saw $589 million in outflows. 

Despite this, Bitcoin still offered the clearest indication that sentiment may be stabilizing. On Friday, the final day of the trading week, BTC investment products recorded $225 million in inflows, helping lift overall market confidence after seven straight days of redemptions. Similarly, Ethereum-based investment products rebounded on Friday with $57.5 million in inflows. 

Besides Bitcoin and Ethereum, other major assets, such as Solana, multi-asset, and Sui, also posted significant outflows, totaling $156.2 million, $35.9 million, and $5 million, respectively. 

XRP Defies Trend, Posts Inflows 

Interestingly, XRP emerged as a rare bright spot in a gloomy week for digital asset products. Investment vehicles tied to XRP attracted $89.3 million in inflows, lifting its total assets under management to $2.23 billion. 

The asset’s resilience was largely supported by heightened interest following the launch of the Canary XRP ETF and the Bitwise XRP ETF, both of which helped draw fresh institutional capital.

Beyond XRP, a handful of other products also recorded modest inflows. Short Bitcoin continued to gain traction with $19 million in new investments, while Litecoin and Cardano products saw inflows of $3.3 million and $100,000, respectively. 

Flows by Assets
Flows by Assets

Regional Flows 

On the regional front, the United States accounted for the bulk of outflows, with crypto investment products in the market recording $1.68 billion in redemptions. Germany, Switzerland, Canada, and Sweden followed with outflows of $118.2 million, $79.7 million, $27.1 million, and $26.8 million, respectively. 

Brazil and Australia defied the trend, as investment products in these regions attracted inflows totaling $3.5 million and $2 million, respectively. 

Flows by Country
Flows by Country

Here’s Potential Shiba Inu Buy Opportunity After Support Retest

0

A recent analyst has projected a considerable price rebound for Shiba Inu as a key support area stands strong despite bearish trends.

Bearish pressure has been building for Shiba Inu, the second-largest meme coin by market cap. Despite today’s slight rebound, SHIB corrected by 11.80% last week, recording its fourth consecutive red weekly candle.

The apparent price weakness has seen SHIB retrace by 20% since November 1, with its year-to-date performance at a negative 62% trend. However, SHIB could see a relief bounce, according to a market commentary.

Shiba Inu Holds Support

The November 22 TradingView analysis came from Lingrid. She shared a buy opportunity for SHIB, as its reaction around recent support suggests momentum.

As her earlier analysis predicted, prices moved to the lower support boundary of a descending channel on the 4-hour chart. SHIB dropped to a low of $0.00000755 last week amid a broader market bearish trend.

However, bulls heavily defended the support area between $0.00000741 and $0.00000767, steering a slight rebound to its current price of $0.00000803. Lingrid suggests that the bounce signals early absorption as Shiba Inu makes another lower low to the structure’s lower trendline.

Shiba Inu Analysis/Lingrid

The quick bounce builds her confidence that Shiba Inu would see higher prices in an upward relief pump. While the whole market setup remains largely bearish, she highlights conditions that could spearhead a short-term recovery.

SHIB Buy Opportunity

Notably, the analyst sees the current market level as a buy opportunity zone. According to her, Shiba Inu would target an 11.2% rally to $0.0000089, stating it is the most probable scenario as liquidity builds below the channel’s lower support trendline.

Nonetheless, the rally depends on certain criteria, including a sustained trend above the $0.00000741-$0.00000767 demand zone. Additionally, Lingrid noted that Bitcoin would need to remain stable, as broader market weakness would invalidate the recovery momentum.

Importantly, the market commentator considers this $0.00000890 push imperative for Shiba Inu. The resistance zone aligns with the descending channel’s “trendline,” and reclaiming it would catalyze further uptrends.

However, failing to recapture the area would keep SHIB consolidating around the lower trendline support. This could eventually lead to a breakdown below the channel to much lower price levels.

Ecosystem developments could provide bullish momentum for this rally. For perspective, Shiba Inu’s daily burn rate increased by 859%, suggesting that more tokens are being wiped out from supply.

Expert Says ‘Absolutely Nothing Happened’ to XRP as ISO 20022 Officially Goes Live

0

The XRP community is abuzz as the long-anticipated transition to ISO 20022 is finally here, a major change in global payments messaging.

Despite the hype built over the years within certain pockets of the XRP community, activity on the XRP Ledger remained unchanged as the new standard went live.

ISO 20022 Goes Live, But XRPL Traffic Stays Flat

On November 22, the coexistence period between SWIFT’s legacy MT messages and ISO 20022 officially ended. From now on, all bank-to-bank payment instructions on SWIFT will use the ISO 20022 format.

While this marks a major transformation for global financial infrastructure, the XRP Ledger saw no notable change in usage or transaction flow. XRPL throughput remained around 22 transactions per second, according to validator and XRPL developer Vet.

This confirms what many technical experts have reiterated for years: ISO 20022’s activation does not automatically translate into increased XRP usage or liquidity demand.

XRP Is Not an “ISO Coin” The Myth Ends

For years, a narrative circulated in the crypto community claiming that ISO 20022 would “force” banks to use XRP. However, XRPL validators and former Ripple staff have reiterated that ISO 20022 is merely a messaging standard, not a settlement system tied to any cryptocurrency.

With the official activation and no impact on XRPL, ex-Ripple developer Matt Hamilton joked on X that the myth is now over. He also acknowledged that those still attached to the narrative “will come up with another ISO 20022 nonsense theory.”

Indeed, the XRP Ledger is not connected to ISO 20022 by default, nor does the standard grant XRP any special status. Any digital asset or none at all can be used alongside ISO 20022.

Ripple’s own CTO has previously stated that XRP has no inherent link to the standard. He stressed that the two operate on entirely separate layers of the payments stack.

The Real Role of ISO 20022

ISO 20022 is a significant upgrade for the payments industry, bringing richer data, better compliance, and more automation. Banks around the world prepared for it, with SWIFT advising institutions not to send messages during the transition to avoid processing problems.

However, this upgrade affects banking infrastructure, not crypto settlements or XRP Ledger activity. Now that ISO 20022 is live, the results show it hasn’t changed anything for XRPL.

Accordingly, past predictions that it would cause huge transaction spikes, automatic institutional adoption, or higher demand for XRP have not materialized.

Ultimately, ISO 20022 matters for global finance, but it doesn’t automatically boost XRP or other cryptocurrencies. XRPL continues to grow based on its own technology, ecosystem, and real-world use — not because of banking messaging standards.

Is Cardano Forming a Base as It Hovers at Weekly Lower Bollinger Band?

Cardano trades near its weekly lower Bollinger Band, signaling strong downside pressure with the mid-band acting as key resistance.

Cardano is trading around $0.4124, edging up about 0.6% over the past 24 hours as short-term traders test support near the $0.40 mark. The 24-hour range between $0.4059 and $0.4202 shows intraday volatility, while market capitalization sits near $15.1 billion with roughly $825 million in daily trading volume.

Zooming out, however, the picture is far less stable. ADA is down about 16.7% over the past week, 30.0% in the last two weeks, and 36.7% during the last month. Its one-year performance shows a decline of more than 60%. This sharp drawdown, set against a modest 24-hour bounce, raises key questions about whether Cardano is forming a short-term base or simply pausing before another leg lower.

Cardano Price Analysis

On the weekly Cardano chart, Bollinger Bands highlight how aggressively the trend has turned lower. Specifically, ADA is trading below $0.41, almost exactly on the lower band around $0.414, after sliding from the mid-range just a few weeks ago. The mid-band (20-week simple moving average) is around $0.73, and could serve as an initial resistance zone. 

Screenshot 2025 11 24T120127379
Cardano

Any rebound will likely meet resistance first at the mid-band and then near the upper band around $1.05. The broadened bands reflect elevated volatility and may eventually be followed by contraction if Cardano begins to consolidate.

Elsewhere, the Directional Movement Index (DMI) reinforces this bearish picture. The ADX line is holding at 28, signaling a strong, established trend, while the negative directional index (-DI) around 32 stands well above the positive index (+DI) near 13.

This confirms that downside momentum is dominant and that selling pressure has been sustained rather than a brief shakeout. Until +DI begins to rise and crosses back above -DI, the indicator set continues to frame Cardano’s structure as a live downtrend rather than a completed correction.

ADA Approach Key Volume Zone Cluster

On his end, market commentator Trend Rider frames Cardano’s recent pullback as a return toward a major demand zone. He notes that after the large downside wick that took Cardano to $0.28 a few weeks earlier, the price has been drifting lower.

Image

It is now approaching a highlighted “yellow zone,” which he describes as the lower boundary of a key volume cluster. In that area, between $0.29 and $0.41, a high amount of trading previously occurred, and buyers stepped in aggressively.

According to his view, this zone still represents one of the more reasonable regions for a “buy-and-hold-for-weeks” strategy. He also points out that Cardano’s long-term trend-support line sits just below, arguing that the closer price moves toward this support, the more attractive the long-term entry becomes.

Cardano Founder Calls in FBI After Developer’s ‘Careless’ Test Caused Cardano First Major Chain Split in Eight Years

0

Cardano network faced unexpected disruption on November 21 when a developer’s flawed test triggered the blockchain’s first major chain split in eight years. 

The event exposed an old software vulnerability and prompted a strong response from Cardano founder Charles Hoskinson, who noted that the matter was serious enough to warrant the involvement of federal authorities.

Flawed Test That Unraveled the Network

The situation unfolded at 08:00 UTC, after an improperly structured delegation transaction passed validation on updated node versions but was declined by older ones. Consequently, this divergence immediately created two separate ledger states.

Intersect, the ecosystem organization monitoring the anomaly, observed that a similar issue had emerged on the testnet a day earlier. This finding indicates that the problematic transaction was likely tested before it occurred on the main network.

Although the ledger split created confusion throughout the ecosystem, the network itself continued to operate without interruption. Both chains continued processing blocks, and several identical transactions appeared on each, making the fragmentation harder to untangle.

Service Disruptions Spread Across the Ecosystem

As the split deepened, services built on Cardano began to feel the impact. Major exchanges paused ADA deposits and withdrawals to avoid processing transactions on the wrong chain.

Coinbase applied the longest halt, freezing operations for roughly 14 hours. Other platforms, including Upbit and Kraken, paused activity for short periods while verifying chain integrity.

The instability rippled through the supporting infrastructure. Block explorers displayed conflicting or frozen data, and DeFi protocols struggled with mismatched contract states. These inconsistencies delayed transaction confirmations and caused several failed interactions as users unknowingly operated on different versions of the chain.

Coordinated Response Brings the Network Back Together

In the hours that followed, Cardano’s core entities, IOG, the Cardano Foundation, Intersect, and EMURGO, mobilized a unified emergency response. 

Developers released patches within three hours of detecting the flaw. Once deployed, the network progressively converged back to a single chain through Cardano’s usual consensus process, completing its recovery by November 22.

Amid the disruption, ADA, the native token of the Cardano blockchain, fell by about 16% before recovering slightly to around $0.4125.

Developer Claims Accident, Hoskinson Signals Intent

The situation escalated further when an X user known as “Homer J” came forward and admitted to causing the split. The user characterized the incident as an unintended outcome of a personal challenge that went wrong. He formally apologized to the community for what they termed a “careless” testing process.

However, Hoskinson publicly rejected that explanation. He described the act as a “premeditated attack” and said federal investigators, including the FBI, had already been notified.

A fact sheet later circulated by Hoskinson and Intersect confirmed that relevant authorities were being informed about the developer’s actions.

Internal Fallout as Developer Resigns

Hoskinson’s remarks and the decision to involve law enforcement created concern within parts of the development team. 

Soon after the statements were issued, an IOG employee known as “effectfully” on X announced his resignation. He explained that they had contributed to several simulated attack exercises in the past and now worried that future development mistakes could be interpreted as criminal acts.

He added that many vulnerabilities in the computational layer had emerged from their own research, and they had never expected routine testing or experimentation to carry potential legal risk.

Analyst Says Short-Term Bitcoin Holders Have Surrendered, But a Bigger Move May Still Be Ahead

0

CryptoQuant analysts believe short-term Bitcoin holders have surrendered, but key metrics suggest the market may still be at a crucial turning point.

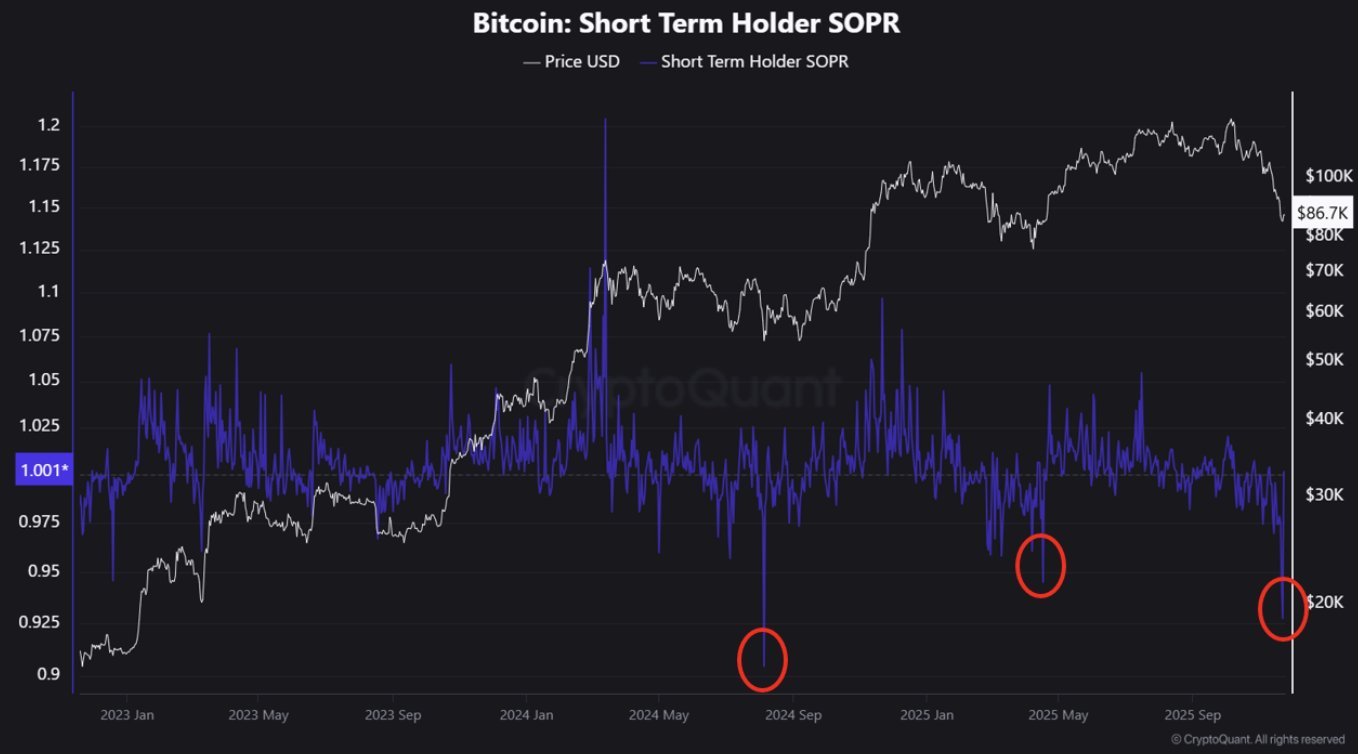
This comes as fresh data from the Short-Term Holder SOPR (STH SOPR) shows another round of capitulation, with the metric dropping below 1.0.

According to CryptoQuant analyst Crypto Dan, the latest decline reflects a new wave of loss realization among recent buyers as BTC trades around $86,812. He notes that this mirrors the stress patterns seen during earlier pullbacks in the current bull cycle.

Sentiment Flips as STH SOPR Breaks Below 1.0

Dan noted that the downward move in STH SOPR shows a shift from optimism to negativity, with a portion of newly acquired coins now being sold at a loss. 

He explains that although this capitulation is smaller than previous ones, the behaviour mirrors the same bottom-forming action observed at earlier correction lows. This aligns with earlier reports that short-term holders have been the main drivers of recent sell-offs.

Image

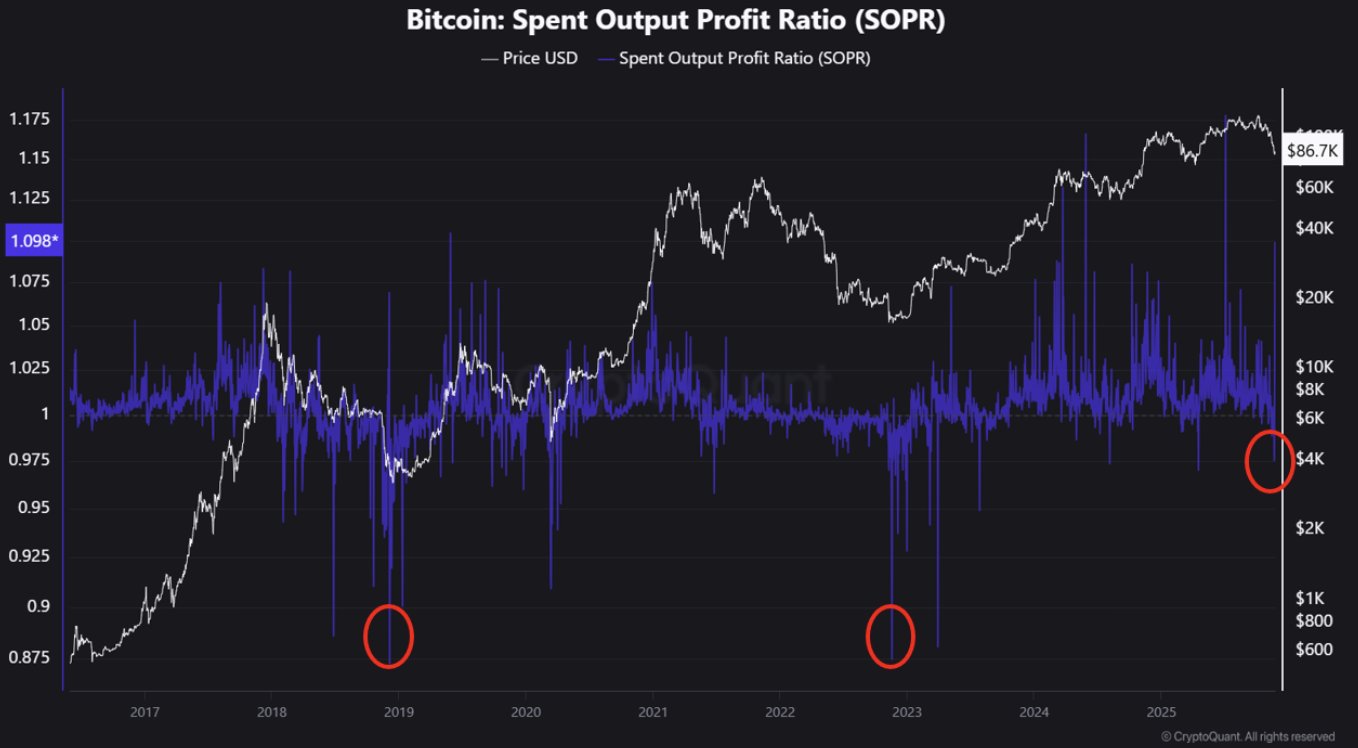
The analyst adds that the combined long- and short-term SOPR currently sits in a zone that can be interpreted in two possible ways. It may represent a typical mid-cycle correction, or it could be the early stage of a broader structural downturn. 

Recurring SOPR Patterns Highlight Capitulation Waves

A historical view of Bitcoin’s SOPR from 2016 to 2025 shows that major corrective phases consistently feature deep troughs below 1.0. The sharpest dips occurred in early 2019 (0.87) and 2022–2023 (0.88–0.90), both followed by months of consolidations and eventual recoveries.

From 2023 to 2025, short-term holders experienced three distinct stress waves. August–September 2024 (STH SOPR at 0.98), April 2025 (0.94), and the latest spike in November (0.94) while BTC traded between $80k–$90k. 

Image

Essentially, the current drop looks just like past cycles. Short-term holders panic and sell at a loss, then the market partially recovers, something that has happened throughout every Bitcoin bull cycle.

What Does This Combined SOPR Mean for Bitcoin? 

Dan concludes that the market has reached a turning point. If Bitcoin is still in a bull market, this recent wave of selling could be the last stage of the correction, similar to past bottoms. But if a new bear market is starting, these losses may be just the beginning of a longer, deeper drop. 

Despite this dual outlook, he stresses that a catastrophic 70%-style bear-market collapse from the all-time high appears unlikely based on current structural signals. 

Still, he warns that a Bitcoin price below $80,000 would significantly increase the likelihood of a tougher market environment. Notably, Bitcoin is 32% away from its all-time high recorded in early October after another 10% drop in the past week.

Analysts Predict What is Next for Bitcoin 

Captain Faibik noted that Bitcoin remains trapped beneath a downward-sloping resistance line. According to him, a successful breakout above this line would be a key trigger, potentially opening the way for a 10%–12% rally, lifting Bitcoin from its current $86,864 toward roughly $96,541.

Meanwhile, CryptoQuant warns that Bitcoin is in its most bearish state since January 2023, with its Bull Score Index at 20 and a drop below the 365-day moving average. Weak demand from Treasury companies and institutions limits price support, and some analysts now expect the current cycle to extend into 2026.