Home Blog Page 430

Where is BNB Price Headed as $8.20M is Erased from the Market?

BNB technical indicators show the altcoin could experience further decline as liquidation events punish the bulls. 

BNB, the native token of the Binance ecosystem, mirrors the turbulence in the broader crypto market sector. It closed at $903.69, down 0.1% in the last hour and showing a 6.5% decline over the past 24 hours.

In the last seven days, BNB has shed 3.1%, with a descent from early November highs, preceded by fleeting green recoveries that failed to sustain above $1,303 on October 6.

This short-term weakness extends to a 16.2% drop in 14 days and a steeper 23.4% plunge over the past month. Amid this decline, the question remains if the token is poised for a deeper correction testing sub-$850 supports before staging a rebound.

BNB Price Analysis

Looking at technical charts in a weekly timeframe, the key resistance zone is around $1,138, where the price has previously struggled to break through.

BNB 1W Chart
BNB 1W Chart

On the indicator end, the Moving Average Convergence Divergence indicator on the chart provides a clear indication of the bearish trend. The MACD line, which represents the difference between the 12-period and 26-period Exponential Moving Averages, is currently below the signal line, which is a key bearish signal. 

Additionally, the MACD histogram is negative. If the MACD continues to stay below the signal line and the histogram remains negative, BNB could experience further declines in the near term. 

Additionally, the Stochastic RSI is in oversold territory, with the %K line at 18.46, indicating that a short-term bounce or consolidation could be possible. However, no immediate bullish reversal signal is present.

$8.20M Liquidated from BNB Market

The liquidation data for BNB shows substantial volatility, with $32.59K liquidated in the past hour, predominantly from short positions ($21.57K). Over the last 4 hours, $2.62M faced liquidations, with $2.48M from long positions, indicating a bearish shift. 

BNB Liquidation Data Coinglass
BNB Liquidation Data | Coinglass

On the 12-hour and 24-hour scales, liquidations have reached $3.96M and $8.20M, respectively, with long positions being more impacted, totaling $3.77M and $7.80M. These figures suggest that the market has been pressuring long holders, with significant downward price action causing these positions to liquidate.

Market Veteran: If Bitcoin Loses This Level, The Bear Market is Confirmed

0

Ki Young Ju, the CEO of CryptoQuant, has identified the level that, if lost, would confirm Bitcoin (BTC) has entered a bear market.

The veteran analyst disclosed this in a post on X today on the back of the panic that has followed Bitcoin’s latest downward trend. For context, BTC has witnessed three consecutive intraday gains since hitting a high of $107,465 on Nov. 11 and is on track to record a fourth one amid a discouraging 4.68% drop today alone.

Notably, since Nov. 11, the firstborn cryptocurrency has declined over 10%, currently trading for $95,139, as it battles the bears to maintain the $95,000 support level. As a result of this downtrend, Bitcoin has lost over $200 billion from its market cap since Nov. 11, having relinquished the $2 trillion valuation mark.

Bitcoin Not in a Bear Market Until It Loses $94K

With these struggles, investors have rightly entered a panic mode, with the fear and greed index (FGI) now at 16 (extreme fear). Despite this, Ki Young Ju believes the market has still not entered the cyclical bearish phase as some have suggested.

He called attention to the Bitcoin Realized Price UTXO Age Bands, specifically highlighting the 6 to 12-month band. For the uninitiated, this metric shows the average buy price of different holder groups sorted by coin age. It helps analysts identify which age groups are in profit or loss to judge bullish or bearish conditions.

Ki Young Ju has suggested that the cost basis of investors who bought BTC between 6 and 12 months ago is especially important in determining whether Bitcoin has entered a bear market. Notably, this figure currently stands at $94,635, representing the average price at which this group of investors procured their BTC tokens.

Bitcoin Realized Price UTXO Age Bands CryptoQuant
Bitcoin Realized Price UTXO Age Bands | CryptoQuant

At the time of Ju’s disclosure, Bitcoin changed hands at $99,620. He noted that as long as the BTC price remains above the 6 to 12-month band cost basis at $94,635, the bear market has not slipped in. “Personally, I do not think the bear cycle is confirmed unless we lose that level,” the market analyst said. Currently, BTC is just a 1.1% drop away from losing $94,000.

Industry Leaders Remain Unfazed

Meanwhile, amid the panic, some industry leaders have called for calm. For instance, Binance founder and former CEO Changpeng Zhao recently called attention to the persistent trend involving investor panic when prices go sideways. He implied that each time this happens, regardless of the level of panic, the market always bounces back. 

Expectedly, Bitcoin permabull and Strategy Chairman Michael Saylor is unfazed. Speaking with CNBC, he called attention to the fact that Bitcoin has had around six drawdowns in history. Notably, it has always recovered.

He pointed out that BTC has grown 50% a year on average over the past half a decade, outperforming gold and other asset classes. “We all want to go to the Moon, but if you ride the rocket, you gotta prepare to pull the G’s,” he said.

Unknown Whale Moves 95M XRP to Binance Amid 8% Price Dip

0

An unknown crypto whale has transferred a significant amount of XRP to popular cryptocurrency exchange Binance. 

Leading blockchain tracking platform Whale Alert flagged the major XRP transaction today, revealing that an unidentified whale transferred 94,699,869 XRP (94.69 million tokens) to Binance. At the time of the transfer, the haul was valued at roughly $217 million, marking one of the largest XRP exchange inflows seen this week. 

Imminent Sale? 

Transfers of this size usually spark speculation within the crypto community. Most users in the comment section have been interpreting that the so-called unknown whale behind the transaction might be preparing to sell.  

One user speculated that the anonymous whale may be preparing to dump the tokens on the market, potentially aiming to buy back XRP at a lower price. However, data from XRPScan shows that the transaction is part of an internal shuffling by the world’s largest crypto exchange. 

The transaction, which occurred today at 08:25 (UTC), shows Binance moving 94.69 million XRP from one of its wallets, labeled “Binance 17,” to another, tagged “Binance 13.” Following the transaction, the Binance 17 wallet had a balance of 162.58 million XRP, while the recipient address had 95.21 million tokens in its balance as of the time of publication. 

Other Large XRP Transfers 

Beyond the Binance transaction, Whale Alert also flagged another sizable XRP movement involving a major exchange. In the early hours of today, U.S.-based crypto exchange Coinbase shifted 92.63 million XRP, worth approximately $214.27 million, between its internal wallets. 

Additionally, two unidentified whales transferred another 92.6 million XRP, valued at roughly $214.14 million, in a wallet-to-wallet transaction. Over the past 24 hours, Whale Alert has also tracked several other massive XRP movements by unidentified whales, including transfers of 96.94 million XRP ($224.95 million) and another 96.96 million XRP ($225.16 million). 

XRP Dips Over 8% in 24 Hours 

Meanwhile, the series of transactions occurred amid a broader downturn in the crypto market. Top assets, including Bitcoin, Ethereum, and XRP, have experienced significant declines over the past day. 

Specifically, XRP has fallen 8.14% over the past 24 hours, currently changing hands at $2.26 per token. Despite the recent dip, the token is still up 3.66% over the past week. 

Bitcoin Not in Bear Market Despite Correction, Says CryptoQuant CEO

0

CryptoQuant CEO Ki Young Ju says Bitcoin remains outside a bear market as long as inflows persist.

A chart shared by Young Ju on X revealed that Bitcoin’s realized capitalization has reached $1.1 trillion, marking its highest level to date as capital continues flowing into the market. 

Ju cited this chart to mention that on-chain data does not yet support the claim of a bear market, despite the fear of one, as Bitcoin dropped to $95,000 from a high of $127,000 in October.

Indeed, he acknowledged that early large holders have been selling into the market, creating short-term pressure. The market pundit believes this trend could ease if their selling slows and macro sentiment improves. 

Realized Cap Hits New Record

For the uninitiated, the realized cap metric measures the value of coins based on the last price at which they were traded, presenting a clearer view of actual capital in the system than the spot price alone. Its rise to $1.1 trillion indicates ongoing accumulation through both the late-year rally and the recent pullback.

Line chart with x-axis from 2017 to 2025 labeled by years, y-axis from 0 to 1.5T in USD, blue line for Price USD rising from near 0 in 2017 to about 1.2T in 2024 with projections, orange line for Realized Cap starting higher and steadily increasing to 1T, legend identifying lines, title Bitcoin Price USD Realized Cap.

Historical trends reinforce this pattern of steady growth. In 2017, realized cap increased during Bitcoin’s surge to nearly $20,000, but remained well below current levels, reflecting a smaller long-term capital base. 

Between 2018 and 2020, realized cap held relatively firm despite Bitcoin spending much of the period under $10,000. Afterward, the 2021 bull cycle pushed both price and realized cap significantly higher as capital entered at scale.

During the 2022 bear market, however, Bitcoin’s realized cap experienced a consistent and noticeable decline, reflecting sustained capital outflows and long-term holders exiting the market.

From 2023 to 2024, the metric continued to rise throughout a broad consolidation phase, marking one of its most consistent periods of growth. Ju argues that this steady expansion is a key reason the current environment does not resemble a true bear market.

Meanwhile, Ju also pointed to the 6 to 12-month holder cost basis at roughly $94,000 as the key threshold, arguing that Bitcoin is not in a bear phase as long as the price stays above this level.

Other Analysts Offer Contrasting Views

Notably, a pseudonymous on-chain analyst offered a different interpretation, suggesting that the rise in realized cap while price momentum weakens may be driven by long-term holders taking profits while still in the green, rather than by fresh capital inflows.

He highlighted the recent drop in long-term holder supply as unusual, since heavy spending typically occurs during rallies, not during periods of price weakness.

DeFi Planet also warned that renewed whale selling could place fresh downward pressure on the broader crypto market. While smaller participants continue to add exposure, heavy sell-offs from major holders often outweigh retail demand and can accelerate volatility.

Amid this fear of a bear market, Binance founder Changpeng Zhao has advised traders to remain calm. Addressing the emotional swings that accompany every market dip, he reminded investors that reactions tend to become extreme during corrections, yet market cycles continue over time.

TRON Set to Challenge $0.30: Will Bullish Momentum Prevail?

TRON faces key resistance at its biweekly high, while liquidation data suggests critical levels that could influence price action.

During this writing, TRON (TRX) trades at $0.2927, reflecting a 1.9% decline over the past 24 hours. This slide, from a daily high of $0.2995 to a low of $0.2884, comes amid a trading volume of over $1.03 billion, signaling active but bearish sentiment possibly driven by market-wide corrections.

Broadening the view, TRON demonstrates mixed signals. Over seven days, it posted a 2.3% gain, with the chart showing jagged peaks and troughs that suggest ongoing volatility after an early-week dip on November 7. However, extending to 14 days reveals a minor 0.6% loss, and the past month with a 7.7% drop.

Tron Price Analysis

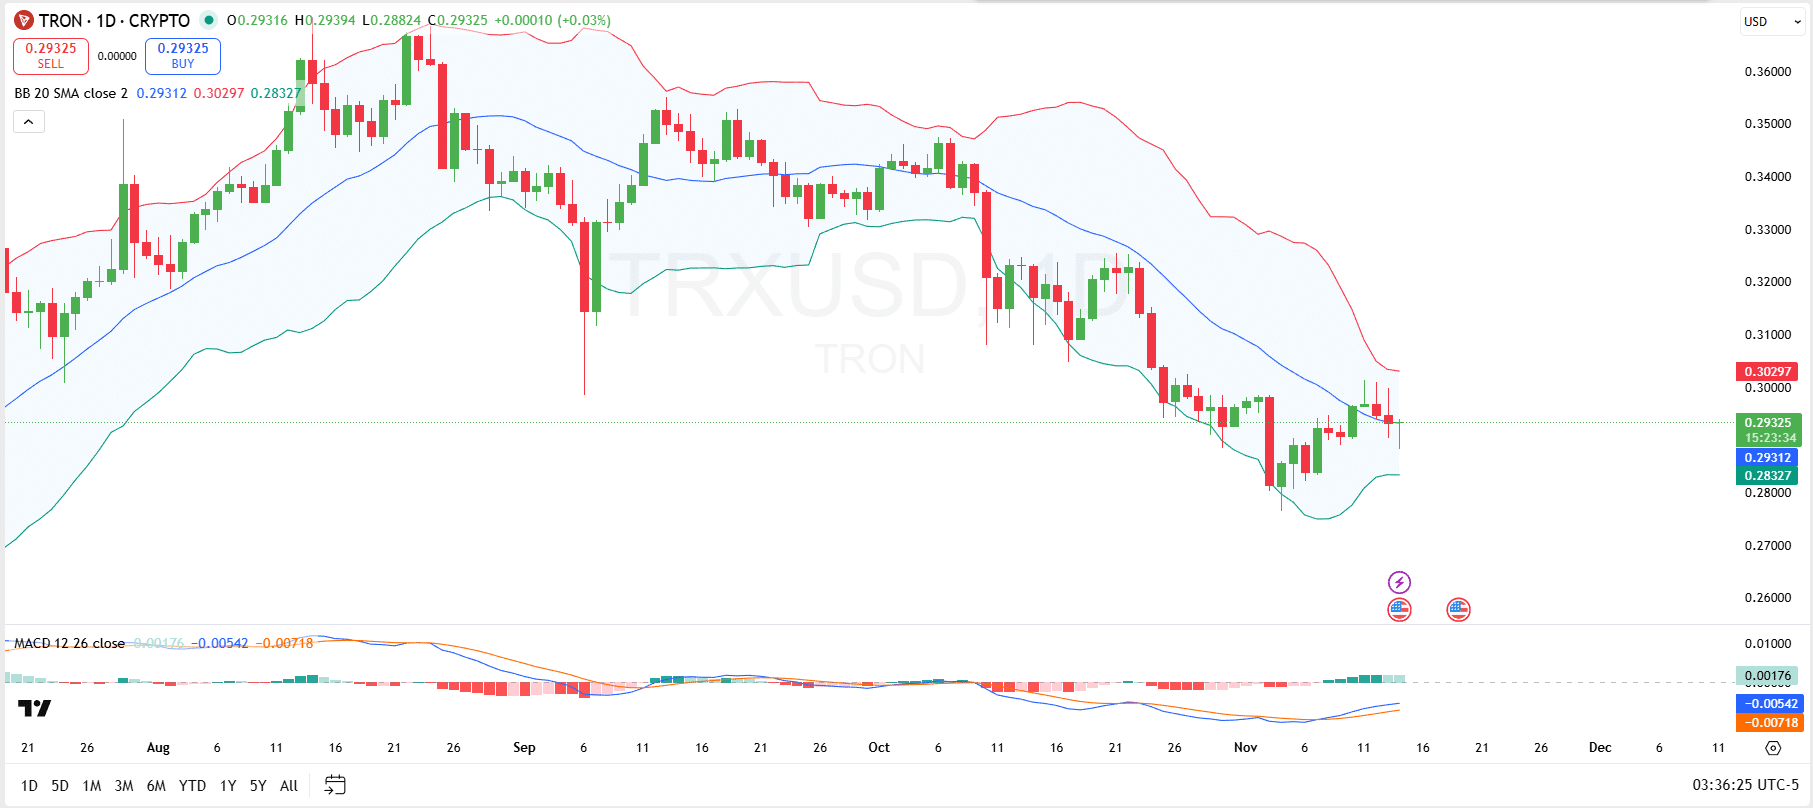
Amid this performance, technical indicators suggest a spike in volatility could be imminent for TRON. For instance, the Bollinger Bands are currently showing a squeeze, with the price hovering near the middle band at $0.29312, indicating that the market is in a consolidation phase, and a surge in volatility could be next.

Screenshot 2025 11 14T113639142
TRON

Notably, a sustained move above the upper band could signal renewed bullish momentum, potentially targeting $0.31, while a drop below the lower band might accelerate selling toward $0.281 support levels observed in early November. 

Additionally, the MACD indicator is showing a bullish crossover, suggesting that momentum may be shifting to the upside unless the bears exert more pressure. The MACD line is at -0.00542 crossing above the signal line at -0.00718. 

This bullish crossover indicates that the buying pressure is increasing, and if it continues, TRON could break above the key resistance near the upper Bollinger Band around $0.30297.

However, if the MACD line begins to turn downward or fails to maintain this bullish crossover, it could signal a loss of momentum, with the price potentially revisiting lower levels, including the $0.28327 support at the lower Bollinger Band.

TRX Liquidation Data

Meanwhile, the liquidation heatmap for TRON provides valuable insights into recent market behavior and potential price levels that could trigger significant moves. Over the past 24 hours, the chart reveals strong liquidations occurring around the $0.298 and $0.286 price levels. 

Screenshot 2025 11 14T122214980
Coinglass

Specifically, the $0.298 area appears to be the nearest liquidity zone to watch. 

Overall, the heatmap suggests that this level is a critical point of contention for TRX, and a sustained move above it may see further short squeezes, while a dip back below $0.28 could trigger more selling pressure.

Binance CZ on Bitcoin Dip: “Some Think It’s the End of Time, But Time Continues”

0

Binance founder Changpeng Zhao (CZ) has offered a calm message to traders as the global crypto market faces intense selling pressure. 

His brief comment on X (formerly Twitter) came while Bitcoin and major altcoins extended their November decline.

Bitcoin Slips Below $100K Once Again

Bitcoin once again slipped below $100,000, trading at $97,392 as of the time of publication. The drop pushed the world’s largest cryptocurrency more than 6% lower in 24 hours and nearly 23% beneath its October 6 peak of $126,080.

The retreat followed earlier November dips, when Bitcoin fell to $99,607 on November 5 and $99,376 on November 7.

The downturn likewise impacted major altcoins, which posted substantial losses over the same period. Ethereum dropped close to 10% and hovered around $3,202.

Solana recorded a fall of about 9%, reaching $142. XRP also slid by 8%, moving to $2.30. These moves highlight broad pressure across major digital assets.

CZ Shares a Measured Take on the Market Slide

Amid the turbulence, CZ addressed the growing anxiety in the trading community. In a short message on X, he noted that each market dip often prompts extreme reactions and apocalyptic predictions.

He reminded his 10 million followers that markets move in cycles and that “time continues,” even during periods of sharp decline. In his words: 

“Every dip, some people think it’s the end of time. Time continues.”

His post drew a quick response from an X user known as DOGE OG, who claimed markets tend to react after CZ tweets.

Zhao rejected the idea, saying people tend to notice only events that appear to confirm such assumptions. He emphasized that numerous counterexamples exist and that this belief reflects perception bias rather than actual influence.

Zhao Points to His Own Trading Missteps

To give traders a perspective, Zhao has recently shared personal examples of poorly timed entries. He recalled buying Bitcoin for approximately $600 in 2014, only to watch it drop to $200 soon after.

He also noted that his 2017 BNB purchases dropped 20–30% shortly after he entered the market. Zhao said he often ends up “in a losing position” and urged traders to manage their risk carefully.

Zhao’s latest investment also moved against him. He disclosed a $2.5 million buy of the ASTER token, which powers the Aster perpetual DEX.

The token briefly surged more than 30%, rising from $0.91 to $1.20 after his revelation. The surge quickly faded, and ASTER slid to $0.84, placing him in another unrealized loss.

Analyst Says Canary Capital Could Buy a Quarter Billion Dollars Worth of XRP Tomorrow

0

The debut of the Canary Capital XRP ETF (XRPC) has triggered fresh speculation across the XRP community.

Some analysts are now discussing how much XRP the issuer may need to purchase following the fund’s massive first-day inflows. After pulling in $245 million on November 14, one prominent commentator believes Canary may need to buy a similar amount of XRP as early as tomorrow.

Big Day One

As Canary Capital celebrated its “big day one,” reporting $58.5 million in trading volume and $245 million in net inflows, crypto analyst Alex Cobb made a remark that caught speculative interest. 

Responding to the announcement, he suggested Canary Capital could be “buying a quarter billion of XRP tomorrow in the open market.”

His speculation echoes a common belief among ETF watchers. When a spot ETF sees large inflows, the issuer may need to acquire equivalent exposure to the underlying asset. In this case, that would mean sourcing roughly $245 million worth of XRP to match XRPC’s first-day demand.

Would Canary Buy XRP on Open Exchanges?

Technically, this scenario is plausible. Spot ETFs must hold the underlying asset, and inflows typically translate into real purchases, especially after the initial creation process settles.

Meanwhile, in practice, large funds often prefer to source assets through over-the-counter liquidity providers, not public exchanges. This approach helps reduce slippage and avoids aggressive price impacts.

If Canary follows that path, the associated XRP buying might be less visible on spot charts, even if the dollar value is substantial.

Record Debut That Attracted Ripple CEO Praise

Regardless of the exact timing of any XRP acquisition, XRPC’s launch stands among the most successful ETF debuts of 2025. The fund recorded:

  • $26 million in trading volume in its first 30 minutes
  • $58.5 million by market close, surpassing the Bitwise Solana ETF (BSOL)
  • $245 million in net inflows on day one, the strongest start among crypto ETFs this year

This early performance also places XRPC ahead of more than 900 ETFs launched during the same period. It even approached the first-day inflows recorded by BlackRock’s Ethereum ETF last year.

Ripple CEO Brad Garlinghouse praised the milestone, saying the long-awaited institutional moment for XRP is now underway. His reaction reflects years of confidence that an XRP ETF would eventually reach the U.S. market.

Why XRP’s Price Has Not Reacted Yet

Even with these strong institutional signals, XRP traded around $2.28 on ETF launch day and slid more than 8% over 24 hours. Community members initially questioned why the ETF’s inflows did not immediately lift the market.

Part of the answer lies in how ETFs source assets. If most early purchases occur through OTC channels, the XRP market may not show immediate price movement. This is consistent with how Bitcoin and Ethereum ETFs behaved in their early stages.

Meanwhile, other community analysts have already begun modeling the impact of future XRP ETFs. Some estimates suggest that if all 12 planned XRP ETFs mirrored Canary’s $245 million debut, the market could see close to $3 billion in daily inflows, though this remains speculative. 

Only eight of those ETFs hold true spot exposure, and there is no guarantee they will match XRPC’s performance.

Cardano Founder Says ‘This Is Why Midnight Exists’ as EU Calls for End to Online Anonymity

0

Cardano founder Charles Hoskinson has highlighted the fundamental purpose behind the network’s privacy-focused sidechain, Midnight. 

In a recent commentary, Hoskinson responded to claims that the European Union aims to end online anonymity.

Specifically, his comments came in response to a viral post from political commentator and Freedom Train International founder Jim Ferguson, who criticized comments made by Spanish Prime Minister Pedro Sánchez at the 2025 World Economic Forum (WEF).

Notably, Sánchez was advocating for an EU-wide policy requiring all online accounts to be linked to a government-issued digital ID wallet, framing online anonymity as a threat to security.

Criticizing the proposal, Ferguson argued that the EU aims to eliminate digital privacy by requiring residents to link their names and biometric data to all online activity. He emphasized that the initiative is less about accountability and more about total traceability.

As a result, Ferguson warned that it could create a “digital surveillance grid” in which every online action is tied to an individual’s identity.

Why Midnight Exists

Interestingly, Hoskinson positioned Midnight as a direct countermeasure to the potential threat to traceability. Notably, Midnight is a privacy-focused sidechain on the Cardano blockchain. It aims to allow people to engage online while maintaining control over their personal information and identity.

Through Midnight, users can transact privately, maintain selective disclosure, and comply with regulators only when necessary. Hoskinson frames Midnight as Cardano’s response to growing concerns that governments may impose mandatory identity verification, biometric tracking, or comprehensive monitoring of all online activity.

He cautioned users to “not let the vampires in,” encouraging them to adopt Midnight as a means to protect their privacy and prevent unauthorized access by institutions or other entities.

Upcoming Launch

Since its introduction in November 2022, Midnight has undergone various developmental phases, including DevNet and token distribution.

The first phase of Midnight (NIGHT) token distribution, dubbed Glacier Drop, took place in August. During the event, eligible beneficiaries across eight blockchains, including Cardano, Bitcoin, Ethereum, and XRP Ledger, were allowed to claim a share of the 24 billion NIGHT supply.

The second phase, known as Scavenger Mine, is currently underway, allowing users to earn unclaimed tokens from the Glacier Drop by completing computational tasks.

Currently, crypto enthusiasts are eagerly anticipating the Midnight Summit, scheduled for November 17–19, where many expect the team to reveal the final roadmap for the project’s mainnet launch. There’s optimism that the privacy sidechain could launch later this year.

Glassnode: Ripple Has Issued 3.4B XRP or 5.6% of XRP’s Circulating Supply in 12 Months

0

A recent Glassnode report found that Ripple has released or “issued” about 5.6% of the circulating XRP supply in the last 12 months.

The XRPL architects launched XRP with a pre-mine of its entire supply. However, after gifting a sizable amount of the supply to Ripple, the firm locked up most of its allocations, and a recent Glassnode report claims over 3 billion tokens entered the market over the past year.

Specifically, Cryptovizart, Glassnode’s pseudonymous lead analyst, revealed that Ripple has released or “issued” about 3.4 billion XRP tokens since December 2024. He shared an accompanying chart which details the rate at which XRP tokens entered the circulating supply since April 2021.

Ripple Has Released 3.4B XRP Since December 2024

Data from the chart shows that from April to August 2021, the “issuance” rate remained relatively flat despite a gradual uptick observed within this period. However, a spike emerged in Q4 2021, which continued until early 2022. Notably, another spike in issuance emerged in Q4 2023, with Ripple maintaining the momentum until November 2024.

XRP Issuance Glassnode

Interestingly, from December 2024, the issuance rate saw a more considerable increase. This surge came on the back of the November 2024 rally, which saw XRP break above the $1 and push toward the $2 mark. By January 2025, XRP had also recovered the $3 price. 

Amid the spike in issuance rate, the total cumulative tokens released hit the current figure of around 18 billion. According to the disclosure, of this cumulative 18 billion figure, Ripple released 3.4 billion XRP worth about $8 billion from December 2024 to date. 

Specifically, the 3.4 billion XRP represents 5.6% of XRP’s circulating supply of 60 billion tokens, while the $8 billion represents 42% of all XRP released in dollar terms. 

For context, the Ripple escrow system often releases 1 billion XRP tokens each month, which should add up to 12 billion tokens over a year. However, the firm typically locks up 700 million to 800 million XRP each month. They then leverage the 200 million to 300 million tokens for funding purposes.

Spike in XRP Profit-Taking Volume

The recent disclosure from Cryptovizart follows an official report five days ago in which Glassnode confirmed that profit realization around XRP had spiked. According to the analytics platform, profit realization spiked to $800 million per day in December 2024 before dropping below $100 million from April to July 2025.

Another spike occurred in late July 2025, as XRP soared to a new all-time high around $3.66, but this spike was also short-lived. Glassnode reported that a gradual increase had now emerged, with profit-taking volume growing from $65 million per day in late September to $220 million now. This has contributed to XRP’s price struggles.

Bitcoin Near $97,000 as Analyst Revisits 2022 Buy Zone Call – Is Now the Best Time to Buy?

0

Bitcoin dips to a six-month low after recent highs as crypto analyst Income Sharks reexamines a 2022 sub-$20K buy zone chart.

Bitcoin is trading at $97,242 amid a turbulent month that has seen the premier crypto asset swing between $97K and $111K. BTC began November near $110K but could not sustain the rally, retracing to levels last seen in May.

Over the past 24 hours, Bitcoin has declined by 6.2%, further extending its monthly loss to 13.6%. The current price is roughly 23% below its all-time high of $ 127,000, recorded in early October.

Analyst Analyst Revisits 2022 Buy Zone Amid Pullback 

The current market pullback prompted crypto analyst Income Sharks to revisit a chart he published in Q3 2022. The chart highlighted a major buy zone between $17,000 and $20,000 during the previous cycle’s downturn, along with a summer accumulation period where price movement slowed, signaling a midterm rally above consolidation.

The 2022 chart also outlined resistance levels, including a mid-range sell zone and a higher profit-taking zone, with a long-term exit target above $40,000. Income Sharks noted that low points in Bitcoin’s price tended to be brief, and selling at sub-$20K levels would have likely resulted in missed gains. 

Image

Interestingly, since the 2022 low of $17K, Bitcoin has surged 471%, demonstrating its resilience through multiple cycles and reinforcing lessons from historical market behavior. 

Today, the analyst has confirmed that the market bottoms often feel like the worst time to buy, yet they frequently become the smartest opportunities. He says this as BTC drops to another low that many believe could be a golden entry opportunity.

Bitcoin Current Structure and Prediction 

Notably, technical indicators suggest Bitcoin may be setting up for a rebound. Crypto Express mentioned that Bitcoin is trading above the support trendline of a falling wedge, indicating a potential bounce if the level holds. However, the 21-day and 50-day moving averages are acting as resistance, and a break below support could trigger further losses.

Price chart for BTC/USDT displays candlestick patterns in green and red over time from July to December with upward and downward trends blue and orange moving average lines support trendline in falling wedge pattern resistance levels marked volume bars below timeframe labels.

Meanwhile, CryptoQuant founder Ki Young Ju noted that Bitcoin whales have been selling since prices surpassed $100,000, contributing to the recent downward pressure. Additionally, Bitcoin ETFs experienced $963.7 million in net outflows over the past nine trading days, starting with BTC’s surge to $115,000 on October 28.

Line chart dashboard titled Bitcoin ETF Total Net Outflows Have Exceeded 963.7M Over the Past 9 Trading Days from Santiment, displaying blue and purple fluctuating lines representing inflows and outflows over time on a dark background, with a highlighted section showing a sharp drop after October 28 marked as net outflows.

Despite a likely end to the 2025 bull cycle, he suggested that institutional support and ETFs can help cushion the market with favorable macroeconomic conditions, making current levels a potential buying opportunity.

Similarly, CryptoQuant analyst Moreno highlights that Bitcoin is in a liquidity setup often seen before major rallies. Even with bearish trends and cautious market sentiment, current conditions could offer favorable entry points for traders.