Home Blog Page 491

50% of Institutions Plan to Increase Allocations to Bitcoin in a Year: State Street Report

0

A new report from State Street shows that institutional investors are steadily increasing their exposure to Bitcoin and other crypto assets. 

Specifically, the report found that 50% of the surveyed firms plan to raise their crypto allocations over the next 12 months, while another third intend to keep their positions unchanged. 

Meanwhile, nearly seven in ten institutions expect to boost their holdings within five years, and a quarter of them plan major increases. Notably, this trend shows how crypto assets are becoming more acceptable in global investment strategies.

Asset Managers and Owners Increasing Exposure to Crypto

The report notes that crypto assets currently make up 7% of institutional portfolios, but the number could more than double to 16% within three years. 

Interestingly, asset managers are leading the trend, taking bigger positions than asset owners. Specifically, 14% of managers hold between 2% and 5% of their portfolios in Bitcoin, compared to 7% of owners. 

Managers are also three times more likely to invest 5% or more of their assets in Ethereum. Moreover, 6% of managers hold at least 5% in smaller cryptocurrencies, meme coins, or NFTs, compared to just 1% of owners.

Further, tokenized assets are gaining ground. Per the report, asset managers have higher exposure to tokenized public and private assets, coming in at 6% and 5% respectively, while owners sit at 1% and 2%. 

Managers also hold more digital cash at 7%, compared to 2% for owners. Meanwhile, despite expressing caution, more than half of all respondents expect between 10% and 24% of all investments to be made through digital or tokenized assets by 2030.

Bitcoin and Crypto Delivering Impressive Returns

According to State Street, the respondents are seeing impressive returns from crypto assets. Expectedly, Bitcoin delivers the highest gains for 27% of respondents, and a quarter expect it to stay on top for the next three years. 

Notably, Ethereum follows closely, with 21% saying it’s currently their best performer and 22% expecting it to remain so. However, tokenized public and private assets deliver smaller returns, about 13% and 10%, but still play an important role in diversified portfolios.

In addition, institutions also believe mainstream adoption is approaching. For instance, 68% expect digital investments to become standard within ten years, more than double last year’s 29%. 

While most respondents cited challenges around cybersecurity, regulation, and education, they see crypto assets as long-term growth drivers. Respondents expect investment returns to improve by up to a third and anticipate cost savings between 23% and 37% as they include blockchain, automation, and AI into their operations.
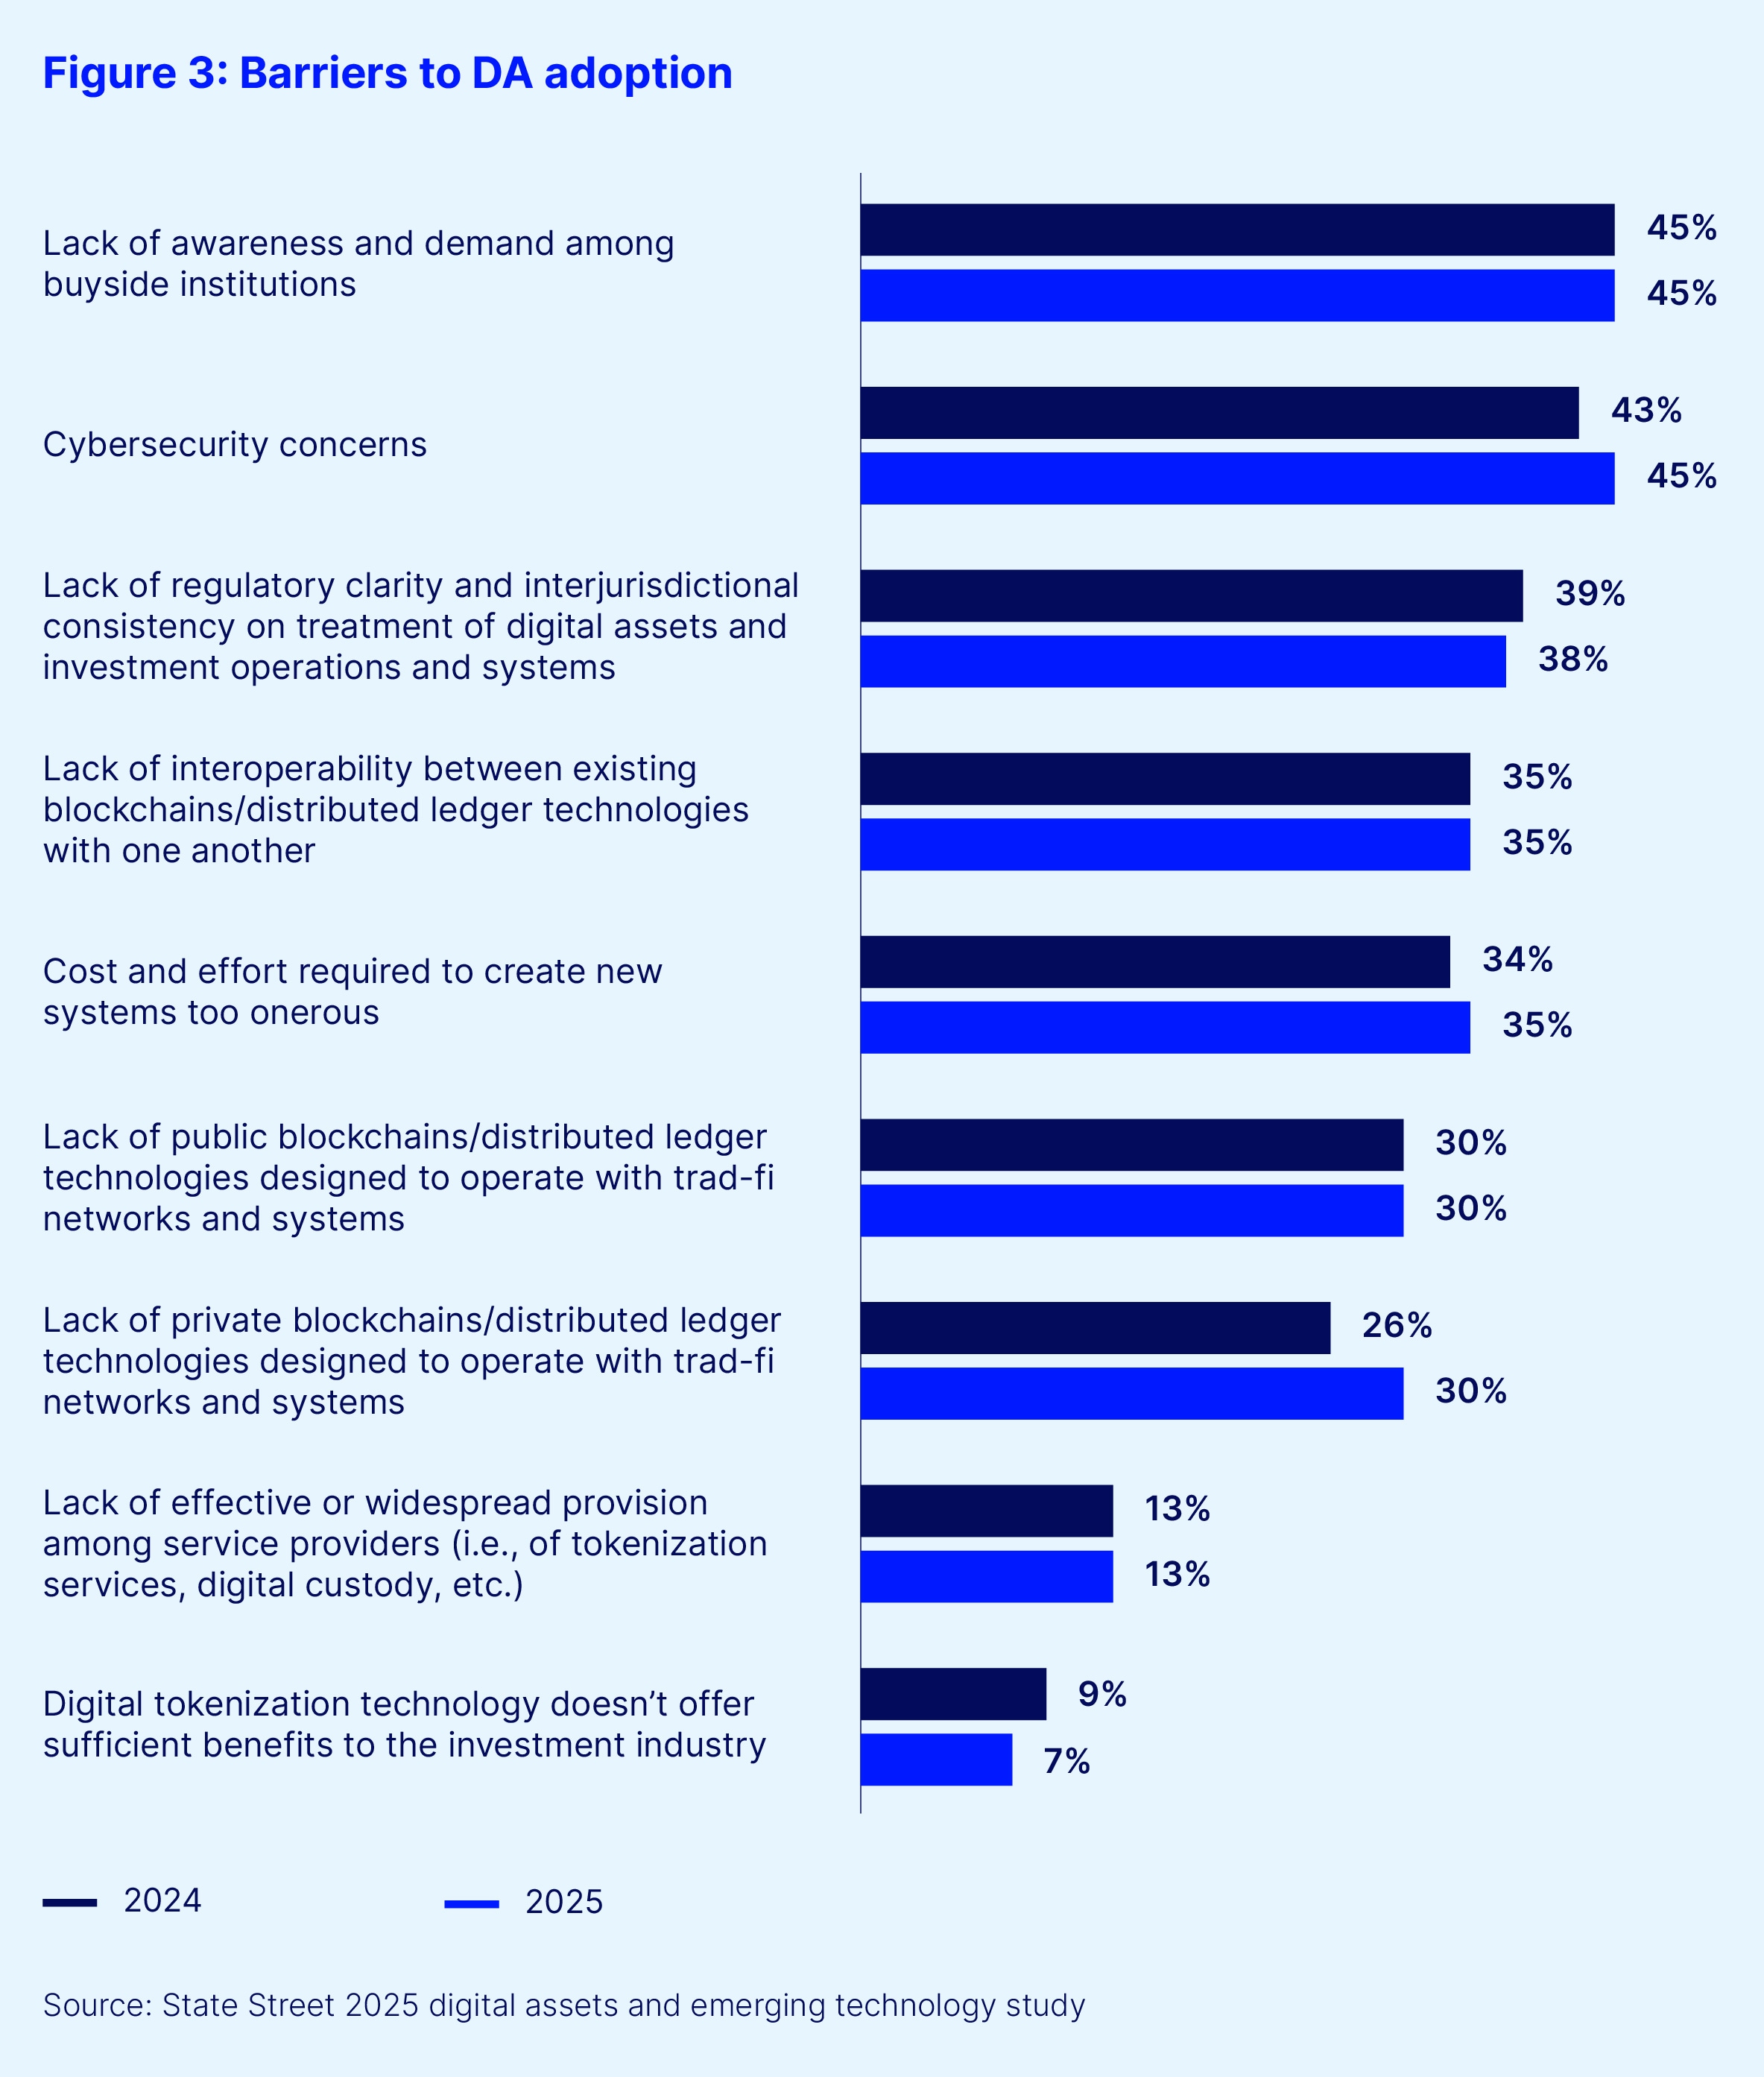
Figure 3. barriers to da adoption

Global Surge in Institutional and Retail Crypto Adoption 

Interestingly, these institutional trends align with external data showing accelerating crypto adoption worldwide. For one, a September 2025 report from Chainalysis found that assets in tokenized funds jumped from $2 billion in August 2024 to over $7 billion a year later. 

In the United States, institutional confidence remains strong amid favorable policies. A June 2025 study from Coinlaw.io reported that 80% of U.S. institutional investors planned to increase crypto exposure in 2024, while partnerships between banks and crypto firms have grown by 52% since 2022. 

Chainalysis also revealed that North America handled $2.3 trillion in crypto transaction value between July 2024 and June 2025, with 26% of global activity coming from institutional trades such as ETF flows and portfolio rebalancing. 

Importantly, retail investors are showing the same momentum. A January 2025 research article from Security.org found that 28% of U.S. adults now own crypto, up from 27% the previous year. 

Crypto.com’s February 2025 report estimated that global crypto ownership reached 659 million by the end of 2024, a 13% jump from the year before. JPMorgan Chase Institute data through May 2025 showed that 17% of active checking account holders moved funds into crypto accounts, up two percentage points from early 2024.
Silver Hits Record $50—Can XRP, the “Digital Silver” Follow Suit?

0

With many referring to XRP as “digital silver,” investors are now questioning whether the token can mirror the precious metal’s performance, especially as silver reaches a new all-time high. 

Recently, silver’s price per ounce surged past $50 for the first time in history, marking a major milestone for the precious metal. 

Analysts attribute this rally to a combination of factors, including the Israel–Hamas ceasefire agreement and growing expectations of an imminent interest rate cut by the U.S. Federal Reserve. These expectations have bolstered investors’ confidence in precious metals like silver, as well as alternative financial instruments. 

Can XRP Replicate Silver’s Impressive Performance? 

At press time, silver is currently trading at $50.72 per ounce. It currently boasts a market cap of roughly $2.85 trillion, surpassing the valuation of Bitcoin. 

Silver Price
Silver Price

Following silver’s historic milestone, several investors have begun speculating about the possibility of XRP charting a similar path. Many are envisioning what it would mean for the cryptocurrency to reach the same $2.85 trillion market valuation as silver. 

For context, XRP has long been referred to as digital silver, while Bitcoin is conferred with the title of digital gold. Last month, XRP community figure Dpac highlighted this point, describing the XRP as “digital silver” due to its practical use case in facilitating transactions. 

In addition, some community members are referencing an old X post from Diep Sanh, who suggested XRP was mirroring silver’s 2005 performance before the precious metal embarked on a parabolic run. 

XRP Price If It Matches Silver Market Cap 

Consequently, we explored how much one XRP token will be worth if XRP matches the market cap of silver. For context, XRP is changing hands at $2.82 per token, with a market cap of $169.12 billion. 

The cryptocurrency’s valuation is currently down 21.95% from its peak market cap of $216.69 billion, registered in July 2025. This dip has also pushed XRP’s price below the psychological $3 level.  

For XRP to match silver’s $2.85 trillion, its market cap would need to rally by 1,585%, potentially bringing it to the same valuation as Earth’s second most precious metal. With a circulating supply of roughly 60 billion tokens, one XRP will be valued at $47.5 if the cryptocurrency eventually reaches silver’s $2.85 trillion market cap. 

While this may seem too ambitious, XRP has seen more audacious projections in its lifetime. Some analysts, including 24hrscrypto1 and Moonshilla, have suggested that its price could surpass the $47.5 mark and climb to loftier targets like $100. 

However, while XRP is often dubbed “digital silver” and its focus on cross-border payments is profound, there is no assurance that it will ever reach silver’s market capitalization at any point in its lifespan. 

Expert Says When XRP Starts Moving, You Won’t Have Time to Build— Build Now or Regret Late

0

As anticipation grows around an XRP price explosion, industry leaders are now emphasizing the importance of strategic preparation. 

Jake Claver, CEO of Digital Ascension Group, recently outlined a blueprint for XRP holders to protect and grow their wealth ahead of any major price movement.

Beyond Price Targets: The Real Challenge for XRP Investors

While many investors focus on speculative price targets, Claver stressed that simply predicting when XRP will hit a certain value isn’t enough. “Being right about what goes up means nothing if you can’t execute when it does,” he argues. 

He noted that the dopamine rush from watching numbers rise can cloud judgment, leading many to miss the opportunity to build lasting wealth.

Stage 1: Establishing Legal and Security Foundations

According to Claver, in order to successfully take advantage of a price run, preparation must start before gains arrive. This involves setting up legal structures such as LLCs and trusts to protect assets from lawsuits and creditors. 

Additionally, he stressed the need for enterprise-grade security solutions. This includes multi-signature wallets and cold storage to guard against hacks and theft, which could wipe out years of gains in minutes.

Stage 2: Leveraging Crypto for Sustainable Cash Flow

Meanwhile, instead of selling XRP during price surges, Claver advocates for collateralized lending, allowing holders to borrow against their assets. 

This approach preserves XRP positions while generating cash flow that can be reinvested into income-producing investments. The strategy aims to create sustainable wealth that works regardless of market conditions. Moreover, this strategy could help avoid taxable events.

Stage 3: Building Family Wealth

For investors with substantial holdings, the blueprint extends beyond individual wealth management. Claver highlights the importance of creating family office frameworks to govern wealth across generations. 

Essentially, without such systems, even large fortunes can vanish within one generation.

Stage 4: Educate, Elevate, and Expand

Claver also emphasized the importance of education and legacy planning. He argued that unprepared heirs pose one of the greatest risks to long-term wealth sustainability. Implementing financial literacy programs and digital asset education ensures future generations understand and manage wealth responsibly.

Preparation Over Reaction

Claver’s overall message is that the difference between building and losing generational wealth lies in preparation. 

As optimism about XRP’s price explosion intensifies, industry observers like Claver believe the window to implement legal, security, and wealth management frameworks will close quickly. Hence, they urge XRP holders to act now before the gains arrive, not after.

Notably, Claver is one of the most ambitious commentators in the XRP community. His price outlooks for the coin include $100, $1,000, and $10,000, which he believes could happen “pretty fast” if certain catalysts converge to create what he often calls “a perfect storm.”

Tether CEO Reacts as Tether Gold Hits $1.5B Market Cap

0

Tether CEO Paolo Ardoino has reacted to the recent market cap milestone from the firm’s proprietary gold stablecoin Tether Gold (XAUt).

For context, Tether Gold has seen substantial growth in recent months, recently surpassing the $1.5 billion market cap mark, as seen in a chart shared by the analytic and market research firm, Katusa Research.

The surge, especially noticeable since August 2025, reflects increasing interest in stablecoins tied to precious metals. According to data from CoinGecko, XAUt is trading at $4,038, a 4.7% uptick in the past seven days and a 7.4% surge in the past two weeks. This is a reflection of gold’s performance.

Paolo Ardoino Reacts

Following this milestone, Paolo, Tether’s CEO, reposted the Katusa Research report, with the commentary: “Tether Yellow Rocks,” a playful reference to the asset’s performance. 

His reaction shows the growing excitement around the success of gold-backed stablecoins in the crypto space. The surge also coincided with a spike in gold’s spot price, which was at $4,038 during this press. Gold’s impressive push comes on the heels of the U.S. government shutdown, which is prompting investors to move to safe-haven assets.

Notably, before the sharp surge in August, Tether Gold had been stuck at a market cap between $0.6 billion and $0.9 billion, although it kept growing steadily. This gradual increase highlighted consistent, albeit slow, adoption among investors seeking a stable asset backed by gold. 

Additionally, the company recently revealed that Tether Gold’s total minted supply is 375,572.25 ounces, with 281,961.71 ounces currently circulating in the market. Additionally, 93,610.54 ounces are still available for purchase.

Institutions Accumulating Tether Gold?

This news also comes only days after Tether and Antalpha, a financial firm with ties to Bitmain, announced raising $200 million for an entity focused on a Tether Gold treasury. The goal of this initiative is to use the capital to acquire and accumulate XAUt.

Additionally, in September, Antalpha expanded its collaboration with Tether, adding new lending services backed by XAUt. If this latest initiative is successful, it would add to the market cap.

Gold Tokens Are on the Rise

Ultimately, XAUt is not the only gold token on the rise. Notably, the overall tokenized gold ecosystem surged by 1.4%, reaching a market capitalization of $3.09 billion. Additionally, PAX Gold (PAXG), hovering around $1.22 billion in market capitalization, took second place after Tether Gold, surging by 4.38% in the past seven days.

Tether Gold Leads Tokenized Gold Market

Another notable performer is Kinesis Gold (KGT), which is seeing gradual growth with a market cap of $186 million.

Cardano Bull Predicts Massive ADA Rally to $5–$8, Ignores Bearish Sentiment

0

Despite the growing bearish trend across the crypto market, a prominent Cardano community figure believes ADA is on track to reach a new all-time high this cycle.

Earlier this week, Cardano experienced a slight pullback with its price nearly dipping below $0.80. The retracement mirrors Bitcoin’s recent correction after the leading cryptocurrency hit a new all-time high earlier in the week. 

Chris Bullish on Cardano Price Amid Growing Skepticism 

Although the pullback has dampened market sentiment and tempered expectations for an immediate bull run, Chris O, a DRep in the Cardano ecosystem, maintains that his optimism for ADA’s breakout to a new high this cycle remains intact.

In an X post, the DRep said he is bullish on ADA’s prospects despite the prevailing bearish sentiment surrounding the token. In particular, he mentioned how community sentiment turned bearish when ADA plummeted to $0.30 a year ago. 

Meanwhile, the downturn did not erode his confidence in ADA, and he remains bullish, just as he was in the past two cycles – 2017 and 2021. The statement indirectly draws a parallel to Cardano’s historical pattern, where ADA faced similar skepticism before witnessing explosive growth 

For instance, many doubted ADA’s growth prospects in early 2021, when the token was worth less than $1. However, it rebounded later that year, hitting an all-time high of $3.10 in September 2021. 

ADA Price to Hit $5-$8 This Cycle 

Although the overall sentiment within the Cardano community has turned bearish, with ADA still trading 75% below its peak, Chris believes history will repeat itself. He predicted that ADA could rally to between $5 and $8 during this cycle.

From the current price of $0.8033, ADA requires a 522% rally to reach $5 and a 895% surge to hit $8. Interestingly, given Chris’s confidence in this prediction, he asked his followers to bookmark the post.  

Meanwhile, other Cardano commentators have issued similar predictions in the past. As reported earlier, pseudonymous analyst Mr. Banana urged investors not to sell their ADA tokens until the asset price reaches $5 this cycle. Popular market commentator Alex Becker shared a similar bullish outlook, framing ADA’s potential rally to the $5 territory as an “easy move.” 

Meanwhile, the $8 price target aligns with crypto analyst Dan Gambardello’s prediction, in which he outlined several strategic exit points for investors to secure substantial profits from Cardano during the current market cycle. 

AB Token Plummets 99% in Minutes on Binance Alpha

The AB token, listed on Binance Alpha, plunged nearly 99% within two minutes early on October 9.

According to live market data from Binance, AB’s price nosedived from $0.0083 to $0.0000051, erasing almost all its value. Subsequently, the token recovered to around $0.00151, though it is still down more than 80% for the day.

The event marks one of the sharpest intraday crashes on a Binance-linked platform this year.

Background: Binance Alpha and the AB Token

Binance Alpha is an on-chain trading platform within the Binance Wallet, designed to list early-stage crypto projects. Notably, the AB token was added to the platform on June 7, shortly after Binance announced its support for the project.

Because Alpha focuses on small, emerging tokens, such assets often face thin liquidity and limited trading depth, which in turn makes them prone to sharp price swings.

Trading Activity Surged Before the Collapse

In the moments leading up to the price drop, trading activity surged dramatically. More than 573,000 AB tokens were exchanged within a very short window, pushing 24-hour trading volume beyond $5 million, according to Binance Alpha data.

Despite the spike in activity, the token’s liquidity pool remains shallow at around $2.17 million, leaving little room for large trades without triggering slippage.

The market capitalization of AB is estimated at roughly $93 million, but the concentration of holdings paints a concerning picture.

Specifically, on-chain analytics show that the top ten wallets control over 97% of the token’s circulating supply. Such a high concentration means that a single large transaction can send prices spiraling, as appears to have happened here.

Image

Possible Causes Under Review

While the exact cause of the collapse remains unclear, several plausible explanations are being discussed among market participants.

For instance, one theory suggests a “whale dump,” where a large holder sold a massive stake, triggering a cascade of sell orders. Alternatively, others suspect a “liquidity pull,” where a market maker or liquidity provider temporarily withdrew support, leaving the order book thin.

In addition, another possibility involves “oracle or smart contract errors,” where automated systems misread market data, leading to unintended sell-offs. So far, no evidence of a hack or system breach has surfaced.

No Official Statement from Binance Yet

As of now, Binance has not issued an official comment on the incident. Meanwhile, the AB token continues to trade with high volatility, and its recovery trajectory remains uncertain.

Shiba Inu Still Looking for Bullish Breakout: Here’s a Possible Catalyst

0

Shiba Inu has persistently faced opposition around a critical resistance trendline, and breaking above it would set the pace for rallies to higher prices.

Notably, the second-largest meme coin by market cap is stuck between two critical areas, according to a TradingView analysis from SwallowAcademy. Above SHIB is the 200-exponential moving average (EMA), and just below is the key support level around $0.0000119.

Selling Pressure from Moving Averages Impeding Uptrend

The analyst identified a consistent trend of higher price rejection at each attempt to break above the moving average. For perspective, Shiba Inu rallied past the 200 EMA to a high of $0.00001765 in May, but the momentum did not last. Selling pressure from the resistance sparked a rejection, with the token falling below again.

The same happened when Shiba Inu broke above the resistance EMA in July and September to highs of $0.00001597 and $0.00001484, respectively. Each of the visits was temporary, with selling pressure from the moving average pushing prices lower.

Shiba Inu Analysis/SwallowAcademy

Support Could Act as Catalyst for Higher Shiba Inu Prices

Each rejection from the 200EMA has sparked a revisit of the support level around $0.0000119. Nonetheless, the area has also provided substantial support to cushion any form of weakness.

This is a positive sign for Shiba Inu, as it indicates that buyers still have sufficient firepower to defend against new lows. Moreover, the analyst highlighted that as long as the meme coin continues to hold its support, the chances of reclaiming higher prices exist.

He predicted a clean sweep to reclaim the 200 EMA, currently standing at $0.00001346. If Shiba Inu successfully breaks above this moving average, it would pave the way for moves to much higher price levels.

Shiba Inu Targets If It Loses Support Area

Nonetheless, current bearish trends suggest that Shiba Inu could still fall below the critical support area at $0.000010. SHIB is down 1.57% in the past 24 hours and 5% in the past seven days, signaling a clear downtrend.

If Shiba Inu loses this support, an earlier analysis from RTED_Investing predicts a dump to $0.0000110. Meanwhile, MMB Trader shared that Shiba Inu could potentially drop to $0.000010 and also possibly add one more zero to trade at $0.00000600.

However, these levels do not suggest a complete bearish shift for Shiba Inu, as the analyst noted that it could bounce from there to $0.00007730. In the meantime, Shiba Inu trades at $0.00001198.

Millionaire Trader Challenges Investors to Show Him a Chart with More Juice Than XRP

0

Experienced market trader Gordon recently emphasized the bullishness on the XRP chart, despite the recent dip, following a potential price breakout.

For context, XRP has reacted adversely to the uncertainties in the cryptocurrency market. The token lost its trend above the psychological $3 price mark again, falling by over 5% in the past seven days.

This has resulted in XRP moving two spots downward in the crypto market cap ranking, as red-hot BNB and Tether’s USDT surpass its current $169 billion market cap. Nonetheless, XRP remains “beyond bullish,” according to millionaire trader Gordon.

XRP’s Beyond Bullish

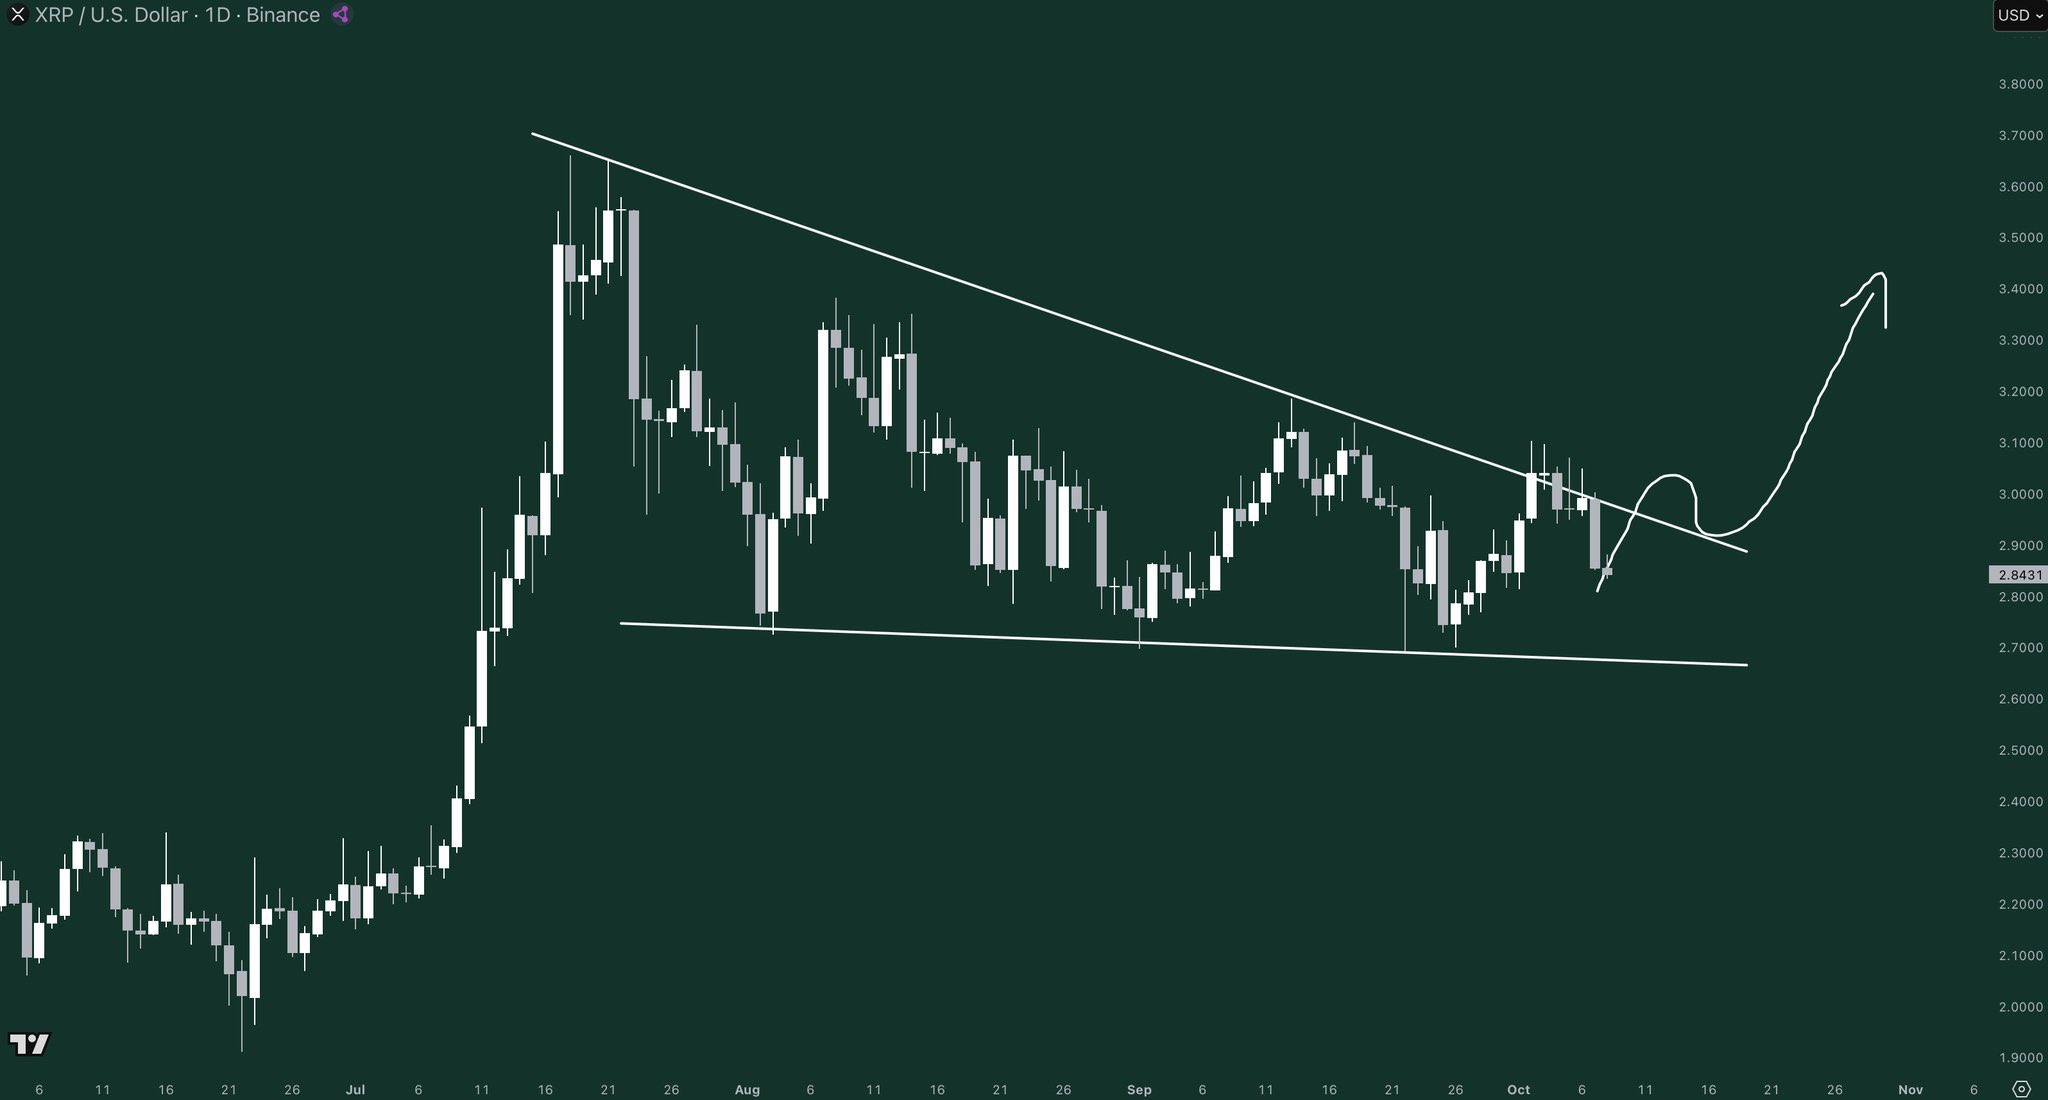
The widely followed trader insisted that XRP still has strong upward momentum despite the downside. He asked if anyone could show him a chart “with more juice” than XRP, referring to the bullish formations on the daily timeframe.

His accompanying chart shows a bullish setup in a descending triangle. The structure has its origin around the July highs, when XRP rallied to $3.66. Meanwhile, XRP has continued to build momentum within the wedge, shuffling between the resistance neckline and support trendline.

Potential XRP Triangle Breakout/Gordon

As prices begin to tighten within the triangle, Gordon sees a potential breakout imminent for XRP. The chart shows a possible price rebound from the current lows, targeting higher prices.

Meanwhile, XRP’s target upon breakout is a possible swing towards the July high of $3.66, representing an approximately 30% rally from the current market price of $2.82. Notably. Gordon has shared this thought repeatedly, noting late in September that the move will be “fast and aggressive.”

XRP Must Hold “Most Important Support”

Nonetheless, XRP appears weak at press time, with prices further correcting slightly over the past 24 hours. However, top analyst Ali Martinez has identified what he called the “most important support level” for XRP.

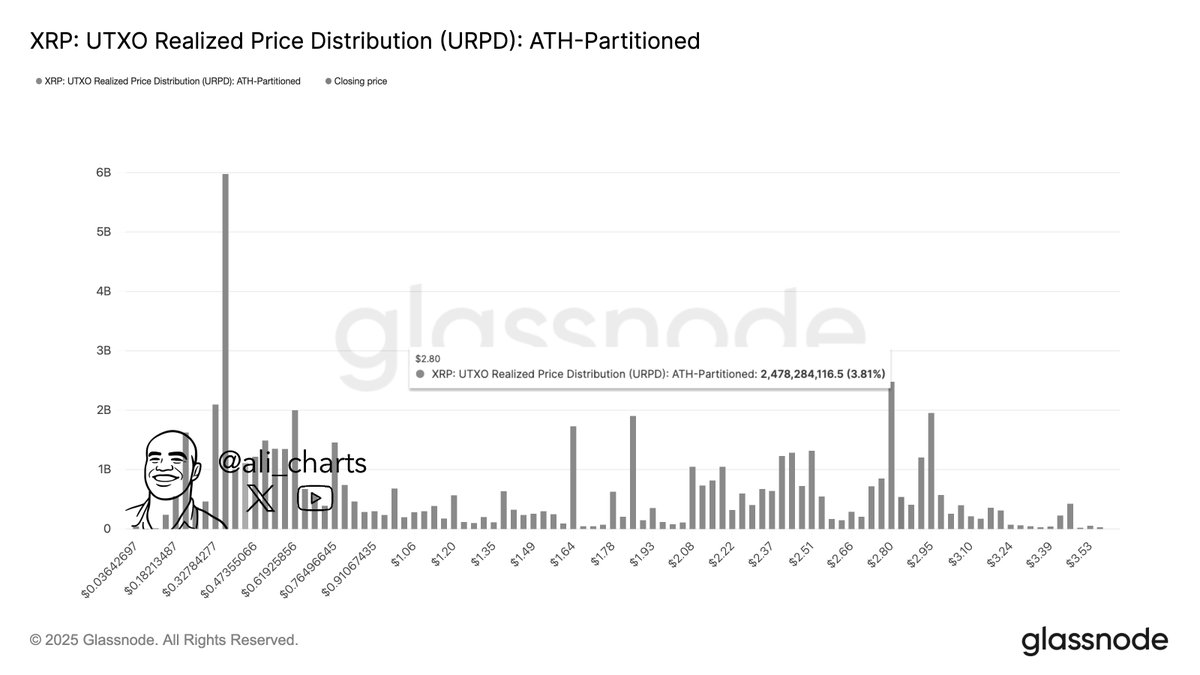
He shared this in an X post yesterday, citing data from Glassnode. The analysis shows that the demand zone around $2.80 is crucial for XRP according to the UTXO Realized Price Distribution (URPD): ATH_Partitioned metrics.

Most Important Support for XRP/Glassnode

About 2.48 billion XRP exchanged hands in the price region, suggesting it is an area with a massive demand wall. It also indicates that whales are likely to buy XRP at that price, further reinforcing the significance of the price level.

Keeping above the level keeps hopes of a rebound alive. However, falling below places XRP further into bearish territory.

XRP Tops Coinbase Search Rankings, Outperforms BTC, ETH, and BNB

0

In a remarkable development, XRP has emerged as the most searched token on the largest U.S.-based crypto exchange, Coinbase, over the past 24 hours.

Data from Coinbase’s internal metrics, shared by community figure Moonkie, reveals that XRP attracted 32,000 searches in the past 24 hours. This figure ranks it as the most searched cryptocurrency on the platform.

Notably, XRP outpaced other major digital assets, with Bitcoin recording 26,000 searches. Meanwhile, BNB saw 22,000 searches, and Ethereum generated 18,000 during the same period.

XRP Search volume on Coinbase

The spike in XRP’s search volume highlights the asset’s increasing popularity and renewed market interest.

XRP Outperforms Bitcoin and Ethereum Gains

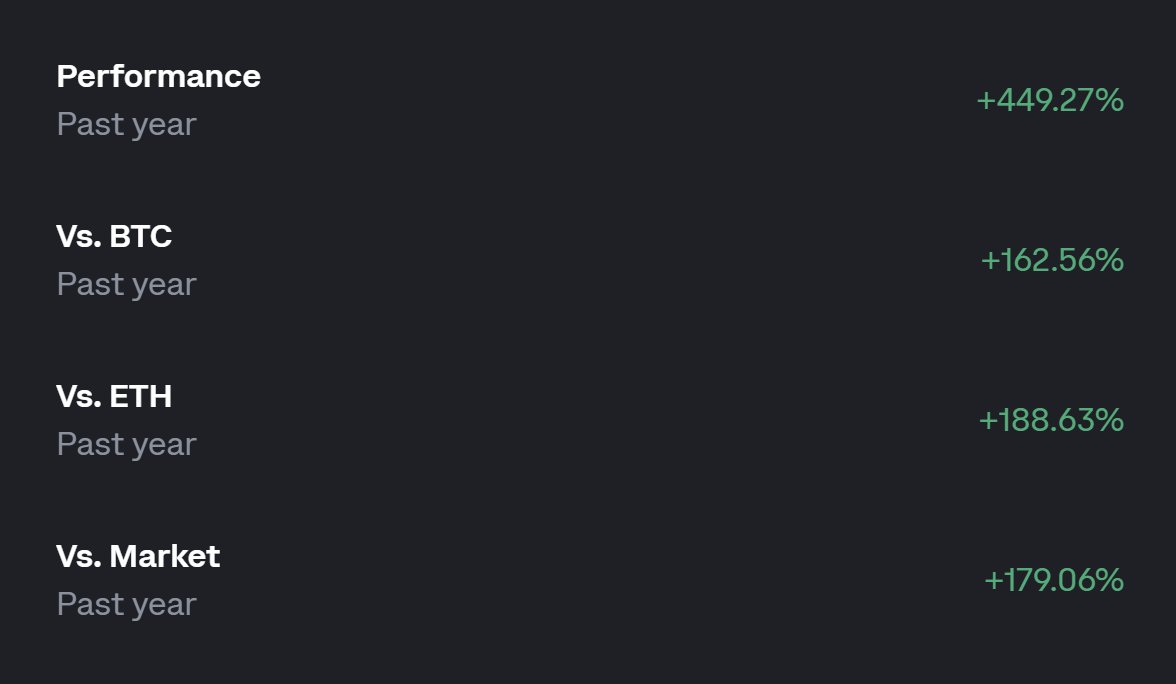
Additionally, Moonkie highlighted that over the past year, XRP’s price has surged by 449%, climbing from around $0.51 to $2.82.

XRP’s gains have notably outperformed those of other major assets during the same period. Compared to Bitcoin, XRP has seen a massive gain of 162.56%. Relative to Ethereum, XRP outperformed it by 188.63%. It also surpassed the broader market by 179.06%.

Image

Potential Reason Behind XRP Soaring Search Volume

Meanwhile, search trends often precede trading activity, suggesting XRP could be gaining short-term momentum or attention from new investors. While the exact reason for the surge in XRP searches remains unclear at press time, some observers speculate that it may be tied to the anticipation of an XRP ETF announcement.

For context, the SEC’s final decision deadline for some proposed XRP-focused ETFs is expected later this month. However, analysts suggest that the timeline could be pushed back due to the ongoing U.S. government shutdown, which has restricted the SEC’s operations.

Additionally, the regulator’s adoption of the Generic Listing Standards has rendered these deadlines ineffective, allowing the SEC to approve and disapprove products at any time. Despite this, optimism about an imminent approval remains high, which could be driving interest in XRP.

XRP Trading Volume on Coinbase Lags Behind Bitcoin and Ethereum

Meanwhile, the development comes on the heels of a modest correction across the broader crypto market. Amid the downturn, XRP has fallen below the $3 mark and is currently trading at $2.82 per token. This represents a 5.26% dip over the past week and a decline of 1.05% in the past 24 hours.

Following the dip, investors are shielding themselves from further losses with reduced trading activity. According to data from CoinMarketCap, XRP’s volume has plunged 36.97% over the past day to $4.59 billion. Notably, $180 million, representing 3.92% of the entire XRP trading volume, was recorded on Coinbase.

Declining XRP Activity on Coinbase

Despite leading Coinbase’s search metric, XRP currently stands as the fourth most traded asset on the exchange, ranking behind Solana, Ethereum, and Bitcoin, which recorded $265.32 million, $578.65 million, and $716.60 million, respectively.

In the meantime, the amount of XRP Coinbase holds in reserve has increased to 16.89 million tokens, marking a modest 3.05% increase from the figure reported on October 6, 2025.

“Send Dogecoin to Parabolic Phase,” Analyst Charges, Targeting $1.5 This Cycle

0

Expert analyst Trader Tardigrade is eyeing a Dogecoin parabolic phase for higher gains this cycle.

This prediction notably comes when Dogecoin has been struggling to recover its weekly losses. Since the start of this month, DOGE has seen massive fluctuations, hovering between $0.245 and $0.27. 

The largest meme coin by market cap is now trading at $0.2489, a 1.5% surge in the past 24 hours amid a 1.8% decline in seven days. Despite the weekly losses, an analyst on X, Trader Tardigrade, is eyeing this cycle’s parabolic phase for further gains.

Dogecoin Historical Phases

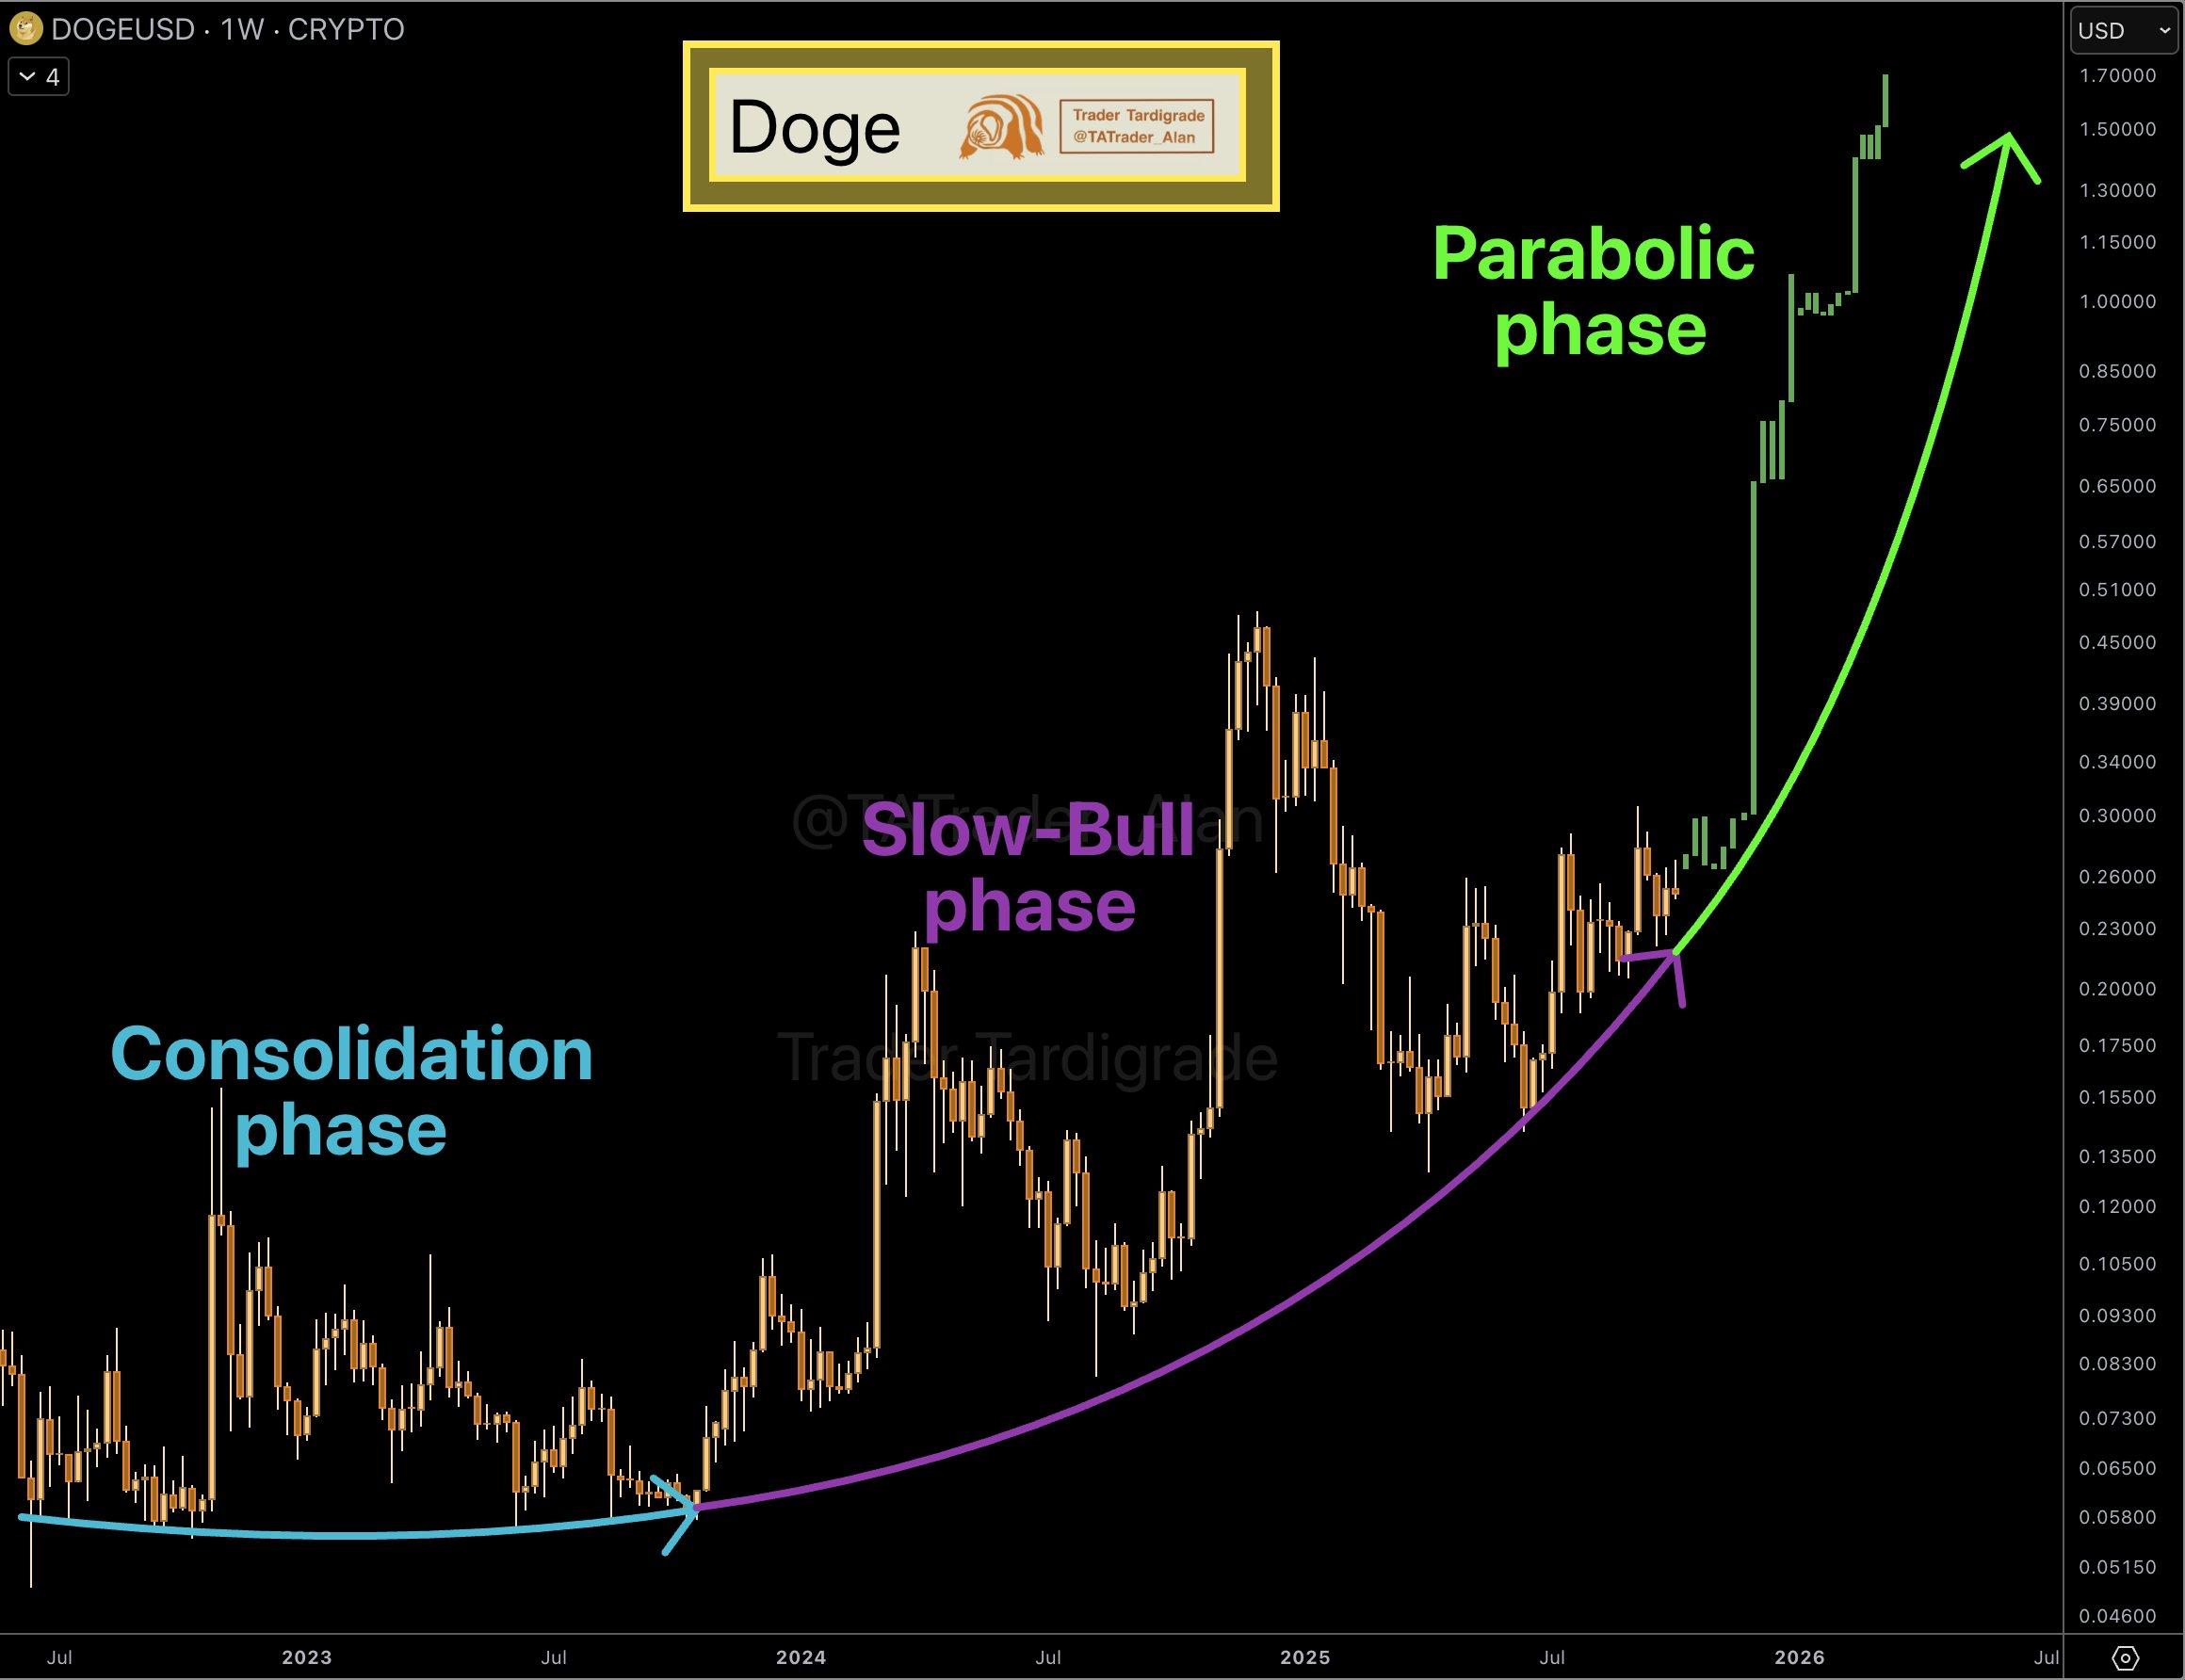
The chart shared by Tardigrade shows the historical price movements and projections for Dogecoin. Specifically, it indicates that Dogecoin typically follows three phases in its price action, namely consolidation, slow-bull, and parabolic phases.

Dogecoin 1W Chart Trader Tardigrade
Dogecoin 1W Chart | Trader Tardigrade

For context, at the beginning of the chart, labeled as the Consolidation Phase, Dogecoin’s price remains relatively stable. Per the chart, Dogecoin started this phase around mid-June 2022, when the price was hovering above $0.05. 

During this phase, the price fluctuated, even surging over $0.1 in early November 2022, but the bulls were not strong enough. Notably, this phase lasted till mid-October 2023, ending with a price below $0.06.

As Dogecoin exited the consolidation phase, it entered the Slow-Bull Phase from mid-October 2023. This phase saw Dogecoin surge to a peak at about $0.2288 on March 25, 2024, although it retraced to $0.09 by August 5 that year. 

Interestingly, after that, it peaked again at $0.46 on December 9, but again the bears overpowered the bulls and took Dogecoin back to $0.14 by April 9, 2025.

Parabolic Phase and Potential Target

Following the April 9 bottom, the price of DOGE has been rising gradually, albeit with fluctuations. However, from here, the upward momentum was not as dramatic as the earlier action. 

According to the analyst, the next phase ahead is the parabolic phase, which he anticipates might take DOGE to levels above $1.5. Notably, Dogecoin would need to surge by approximately 502.45% to rise from $0.2489 to $1.50. 

Recall, on October 3, Trader Tardigrade mentioned that Dogecoin had already entered the parabolic phase of this cycle. He also identified a “nice” pattern on Dogecoin’s 4-hour chart on October 7, which could take DOGE to $0.29.

Other Analysts Remain Bullish

Amid Trader Tardigrade’s anticipation, other bullish predictions for Dogecoin still exist. A recent analysis from Bithereum_io on October 5 highlighted a potential breakout for Dogecoin as it formed a tightening symmetrical triangle on the daily chart. 

This pattern, which often precedes significant price movements, suggests that Dogecoin could target its December 2024 highs if it breaks upwards. 

The analyst has recommended considering Dogecoin as a buy at its current levels, noting that if the breakout occurs, initial price targets could push the coin to $0.298. Other potential targets include $0.337, $0.394, and even $0.466.

Despite the overall bullish outlook, there’s a cautionary note regarding a possible correction. The analyst pointed out that Dogecoin could dip further to test key support zones between $0.220 and $0.209, which align with the 200-day SMA currently at $0.204.