Home Blog Page 612

Dogecoin Eyes Breakout as Technical Indicators Align for Rebound

Dogecoin might be eyeing a major breakout to higher levels as technical indicators indicate a possible price rebound amid the recent struggles.

Notably, Dogecoin is approaching a key technical level that may trigger a price reversal, as a prominent crypto analyst identifies bullish signals on short- and long-term charts. 

Trendline and RSI Support Could Trigger a Bounce

Analyst Trader Tardigrade shared a 4-hour price analysis showing Dogecoin nearing an upward-sloping trendline at $0.23, which has acted as support multiple times this month. Each previous touch of this trendline led to upward movement, making the current setup one to watch.

The trendline, first validated on July 10 when DOGE dipped to $0.186, marked the beginning of a sharp rally. From that point, Dogecoin surged to $0.258 by July 15, a 38.7% gain in just five days.

The second interaction occurred on July 19, when the price once again fell to the trendline, this time around $0.211. That dip triggered a new leg upward, pushing DOGE to $0.248 on July 22, a 17.5% increase within three days. These two bounces confirm the trendline’s role as a strong support zone.

Notably, Dogecoin trades at $0.2268, a 2.2% drop in the past day, reducing its monthly gain to 36%. Dogecoin’s price mirrors the broader market trends as Bitcoin is also trading at $115,257, a 2.7% decline in the past day.

The Relative Strength Index (RSI), which measures price momentum, also shows DOGE entering oversold territory. The RSI has bounced from the same level, 40, in past instances, aligning with the price trendline to suggest a potential recovery.

When the RSI reaches this level, it typically signals that the price has become oversold, suggesting a buying opportunity. 

Meanwhile, a trendline and RSI support confluence is often considered a strong technical indicator for bullish movement. Although there is no guarantee, such setups attract buying interest from short-term traders looking to catch early reversals.

Monthly Chart Forms Bullish Engulfing Pattern

Meanwhile, a more significant signal may be forming on the monthly chart. Tardigrade’s analysis highlighted that Dogecoin is close to printing a bullish engulfing candle for July. This type of candlestick forms when a large green candle fully engulfs the prior red candle, signaling that buyers have overtaken sellers.

The data also revealed that similar setups in previous cycles led to major rallies. The chart shows similar patterns in 2021 and 2023, which preceded periods of rapid price growth.

The close of the July candle will be crucial, and a close above $0.28 could confirm the strength of the bullish signal. The chart suggests that a move to $0.30 or higher is possible if the pattern holds.

Analyst Says Dogecoin Could See 610% Uptick. 

Adding to the bullish sentiment, an analysis by Bitcoinsensus reveals Dogecoin has printed a bullish MACD cross, signaling a potential major rally ahead. Historically, similar crosses have led to exponential gains, with past rallies delivering returns of +84%, +194%, and +446%. 

The latest signal suggests the next wave could push DOGE as high as 610% from current levels. This development follows other bullish indicators, including RSI support and a possible monthly bullish engulfing candle.

Meanwhile, an earlier report noted that Dogecoin whales accumulated 310 million tokens, worth over $73 million, in the last two days. The buying spree came during the current market dip and was led by holders of 100 million to 1 billion DOGE. 

Analysts suggest the dip is a retest of a 146-day ascending channel recently broken, rather than a sign of weakness. The continued accumulation by large investors has sparked renewed optimism, as such behavior often precedes a price rebound.

Here is How High Shiba Inu Could Reach If It Follows Bitcoin and BTC Soars to $500K

0

Shiba Inu could spike to unprecedented levels if it closely follows Bitcoin as the leading asset climbs to $500,000. 

Bitcoin remains the leader of the crypto market and its performance influences the price actions of altcoins like Shiba Inu (SHIB). 

Whenever the price of BTC soars, SHIB usually experiences a similar upsurge and sometimes outperforms it. Similarly, a decline in Bitcoin’s price hurts the performance of other tokens, such as SHIB.

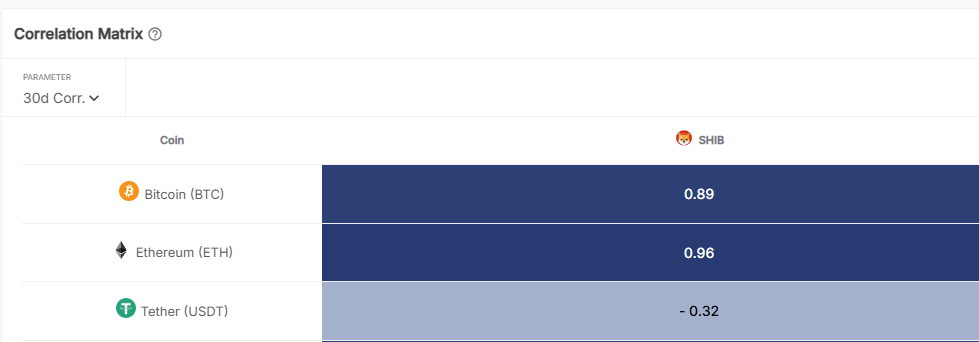
Over the past month, SHIB has exhibited a 89% correlation with BTC. However, the 60-day correlation matrix between the two assets stands at 71%. 

Shiba Inu correlation with BTC

Bitcoin to $500K Predictions 

Based on the strong correlation between the assets, Shiba Inu is expected to see significant gains should Bitcoin rally to the ambitious $500,000 target.

The $500,000 Bitcoin price prediction has gained momentum recently. Industry leaders such as Cardano Founder Charles Hoskinson have forecasted BTC’s surge to that level. 

In May, Geoffrey Kendrick of Standard Chartered predicted that Bitcoin would reach $500,000 by 2028. Kendrick’s projection was influenced by the government’s increased stake in Bitcoin treasury company MicroStrategy and strong institutional demand for the premier asset. 

For context, Bitcoin is currently trading at $115,832, with a market cap of $2.3 trillion. Hitting the $500,000 target demands a surge of 331% from the current price. If this happens, Bitcoin’s market cap would rally to $10 trillion with a supply of 20 million. 

Shiba Inu Price If It Follows Bitcoin Growth Rate to $500K 

Given Shiba Inu’s high correlation with Bitcoin, the doggy-themed token might also experience a significant spike if BTC hits the $500,000 target. Currently, Shiba Inu is trading at $0.00001343 per token, representing an 11.47% decline over the past seven days. 

If Shiba Inu mirrors Bitcoin’s potential 331% rally to $500,000, SHIB could climb to roughly $0.00005788. This estimated price translates to a market capitalization of $34.1 billion.

While the growth may not be particularly significant compared to Shiba Inu’s historical performance, investors can still expect substantial gains if it materializes. 

For instance, an investment of $10,000, equivalent to 744.6 million SHIB tokens at the current price, could be worth roughly $43,100 if SHIB reaches the $0.00005788 target. 

Can SHIB Hit $0.00005788?

Notably, the $0.00005788 target is not new to Shiba Inu. The coin had achieved the milestone in the 2020/2021 market cycle and even surpassed it to $0.00008845.

However, Shiba Inu has struggled to revisit the $0.00005 territory since 2022. Nonetheless, Telegaon predicted that Shiba Inu will clinch the $0.00005788 price target this year, projecting a rise to a maximum target of $0.00005728. 

Notably, experts at Changelly predict that SHIB will not reach its target until April 2028. In that month, Changelly predicted that Shiba Inu would reach a maximum target of $0.0000580. 

Meanwhile, several crypto analysts, including Himanshu Maradiya of CIFDAQ Blockchain Ecosystem, believe that Shiba Inu will not only reach $0.00005788 this year but will surpass it and aim for ambitious targets above $0.0001. 

Can SHIB Price Soar Even Higher?

This article aims to illustrate the potential value of Shiba Inu if it were to match Bitcoin’s growth rate and the premier asset reaches a price of $500,000. However, it undermines SHIB’s growth prospects as the token usually outperforms Bitcoin’s gains during a strong bull run. 

For instance, during the 2020/2021 cycle, while Bitcoin surged by 700%, SHIB’s price increased by several million percent, as The Crypto Basic reported.

Altcoin Daily Predicts Realistic XRP Price for 2025

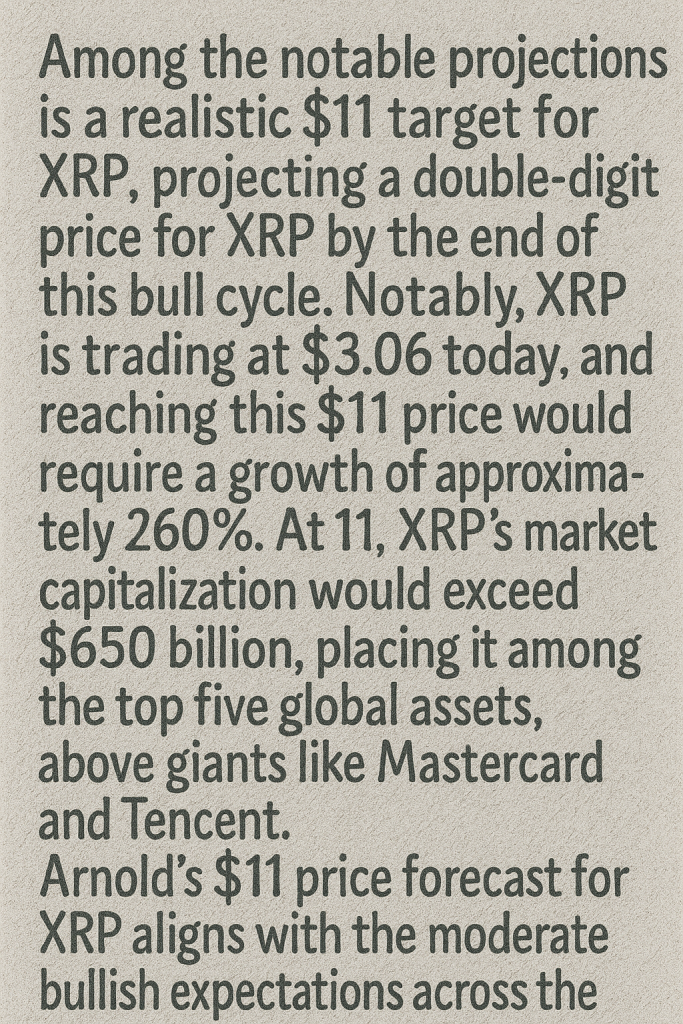
Aaron Arnold, host of the YouTube channel Altcoin Daily, has joined the ongoing discussion about how high XRP could reach this season.

He shared his thoughts on X, highlighting various price outlooks for some of the most prominent altcoins in the market. He described his price forecasts as “realistic” 2025 price expectations for these coins.

XRP Realistic Price for 2025

XRP Realistic Price for 2025 from Altcoin daily
XRP Realistic Price for 2025

Comparison with Previous Forecasts by Other Analysts

For instance, last week, Zubic, founder of the NFT project Space Riders, predicted XRP could hit $10 within a year if Bitcoin reaches $250,000.

Previously, analyst EGRAG also forecasted the $10 target, citing bullish technical indicators. Others like Edoardo Farina argue that $10 may be too conservative given XRP’s growing real-world adoption.

Meanwhile, crypto trader “ProfitMana” recently claimed he’ll “retire” his followers with massive gains from XRP and other coins. In his post, Mana noted XRP could surge up to 7X this season, up from his previous 5X estimate, implying a potential high of $15 to $21 this cycle.

Meanwhile, these outlooks still fall short of the ambitious $50+ targets floated by ultra-bullish XRP proponents.

Other Altcoin Projections

In addition to XRP, Arnold presented price expectations for several other leading altcoins. For Cardano (ADA), he suggested a price up to $4. Notably, ADA is still trading below $1, and its all-time high from 2021 is $3.01.

Some analysts like Ali Martinez have previously called for a peak price for ADA up to $10. However, such bold calls have reduced in recent times amid ADA’s price struggles. As of today, ADA is trading at $0.7974 but is up 36% in the last 30 days.

For Solana (SOL), Arnold suggested a peak at $400. Meanwhile, other commentators have previously called for prices up to $1,000 for SOL in an ultra-bullish market.

Notably, unlike ADA, SOL has broken its 2021 all-time high but currently trades 39% below the peak, which stands at $294. At press time, SOL changes hands for $174, up 20% over the past month.

Other altcoins featured on the list include Injective (INJ) with projections for $99 price. Arnold expects meme coin BORG to reach $3.50, PENGU to hit $0.10, and PUMP to claim $0.01.

The predictions suggest a major bull run across a wide range of assets, with meme tokens like PENGU and PUMP expected to outperform through sheer volatility, with up to 10X growth outlooks.

Market Braces for a New Bitcoin All-time High as Global M2 Reaches Record High

0

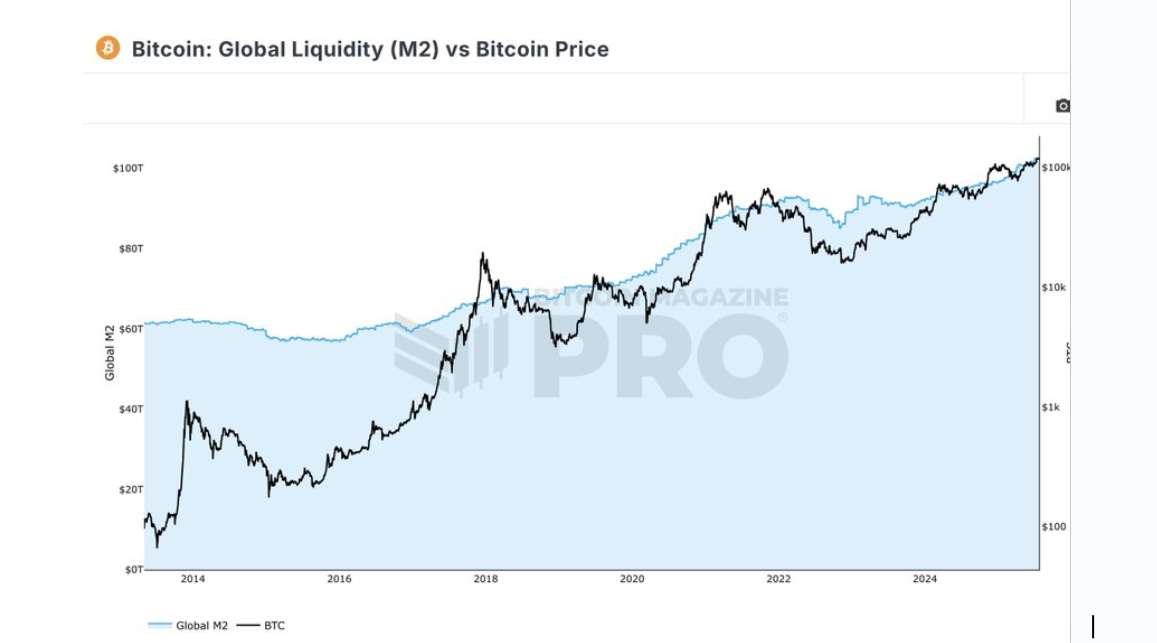
Market analysts expect Bitcoin to rally toward a new all-time high amid the recent spike in global M2 money supply to a record peak.

Notably, Bitcoin is trading at $115,308, reflecting a 2.2% decline over the past 24 hours and a 4.3% drop for the week. Despite this downturn, global M2 liquidity, a broad measure of the global money supply, hit a new all-time high. As a result, analysts predict Bitcoin could also reach a new all-time high similar to global M2 liquidity.

Global Liquidity Rises, Bitcoin Rise Could Follow 

The global M2 supply includes cash, checking accounts, and savings deposits across economies. For context, it serves as a broad measure of worldwide liquidity and monetary expansion. 

The chart accompanying the analysis compares Bitcoin’s price and global M2 from 2012 through mid-2025. The chart reveals a strong historical pattern: Bitcoin rises when M2 expands and falls during contractions involving the M2 supply.

BTC Global liquidity supply New114111
BTC Global liquidity supply

Global Macro Investor Raoul Pal’s founder had earlier noted the correlation between global liquidity and Bitcoin’s price. He said rising global liquidity drives up to 90% of Bitcoin’s price. 

Notably, major bull runs in 2013, 2017, and 2021 occurred shortly after notable increases in global M2. The same pattern appears to be repeating in 2024–2025.

Current Weakness May Be Temporary

For instance, after the COVID-19 pandemic in 2020, global M2 surged, and Bitcoin rallied above $60,000, reaching the then-new all-time high above $64,000. In 2022 and 2023, as central banks tightened liquidity, Bitcoin experienced a significant correction. 

On July 23, 2025, M2 climbed again to a new all-time high of $95,209 trillion, and Bitcoin’s recent price action has shown signs of following that trend, although with some delay. This alignment suggests investors treat the asset as a hedge or beneficiary of loose monetary conditions.

The latest upward move began in late 2023, as global M2 rebounded following a post-pandemic slowdown. Bitcoin responded by climbing sharply throughout early 2024 and remains elevated despite occasional price fluctuations.

While Bitcoin’s recent decline may reflect short-term profit-taking, the broader liquidity trend remains supportive. The analysis suggests that Bitcoin could potentially surpass previous highs, above $123,000, which was recorded last week as global M2 reaches a new all-time high.

Experts Expect Bitcoin to Trade Above $200K

Meanwhile, several industry leaders have made bold predictions about Bitcoin’s price trajectory this year. Robert Kiyosaki, author of Rich Dad, Poor Dad, forecasted that Bitcoin could trade between $180,000 and $200,000 in 2025. HC Wainwright, a New York-based investment firm, projected a year-end target of $225,000, citing Bitcoin’s historical cyclical trends. 

Similarly, Tom Lee of Fundstrat predicted Bitcoin could reach $250,000, attributing the potential surge to macroeconomic changes such as expected interest rate cuts by the Federal Reserve. Looking ahead, Michael Saylor, executive chairman of MicroStrategy, set a long-term price target of $13 million by 2045.

Think Twice Before Buying XRP or Become Exit Liquidity: CryptoQuant Analyst

0

CryptoQuant analyst Maartunn cautions investors to think twice before buying XRP, warning they risk serving as exit liquidity. 

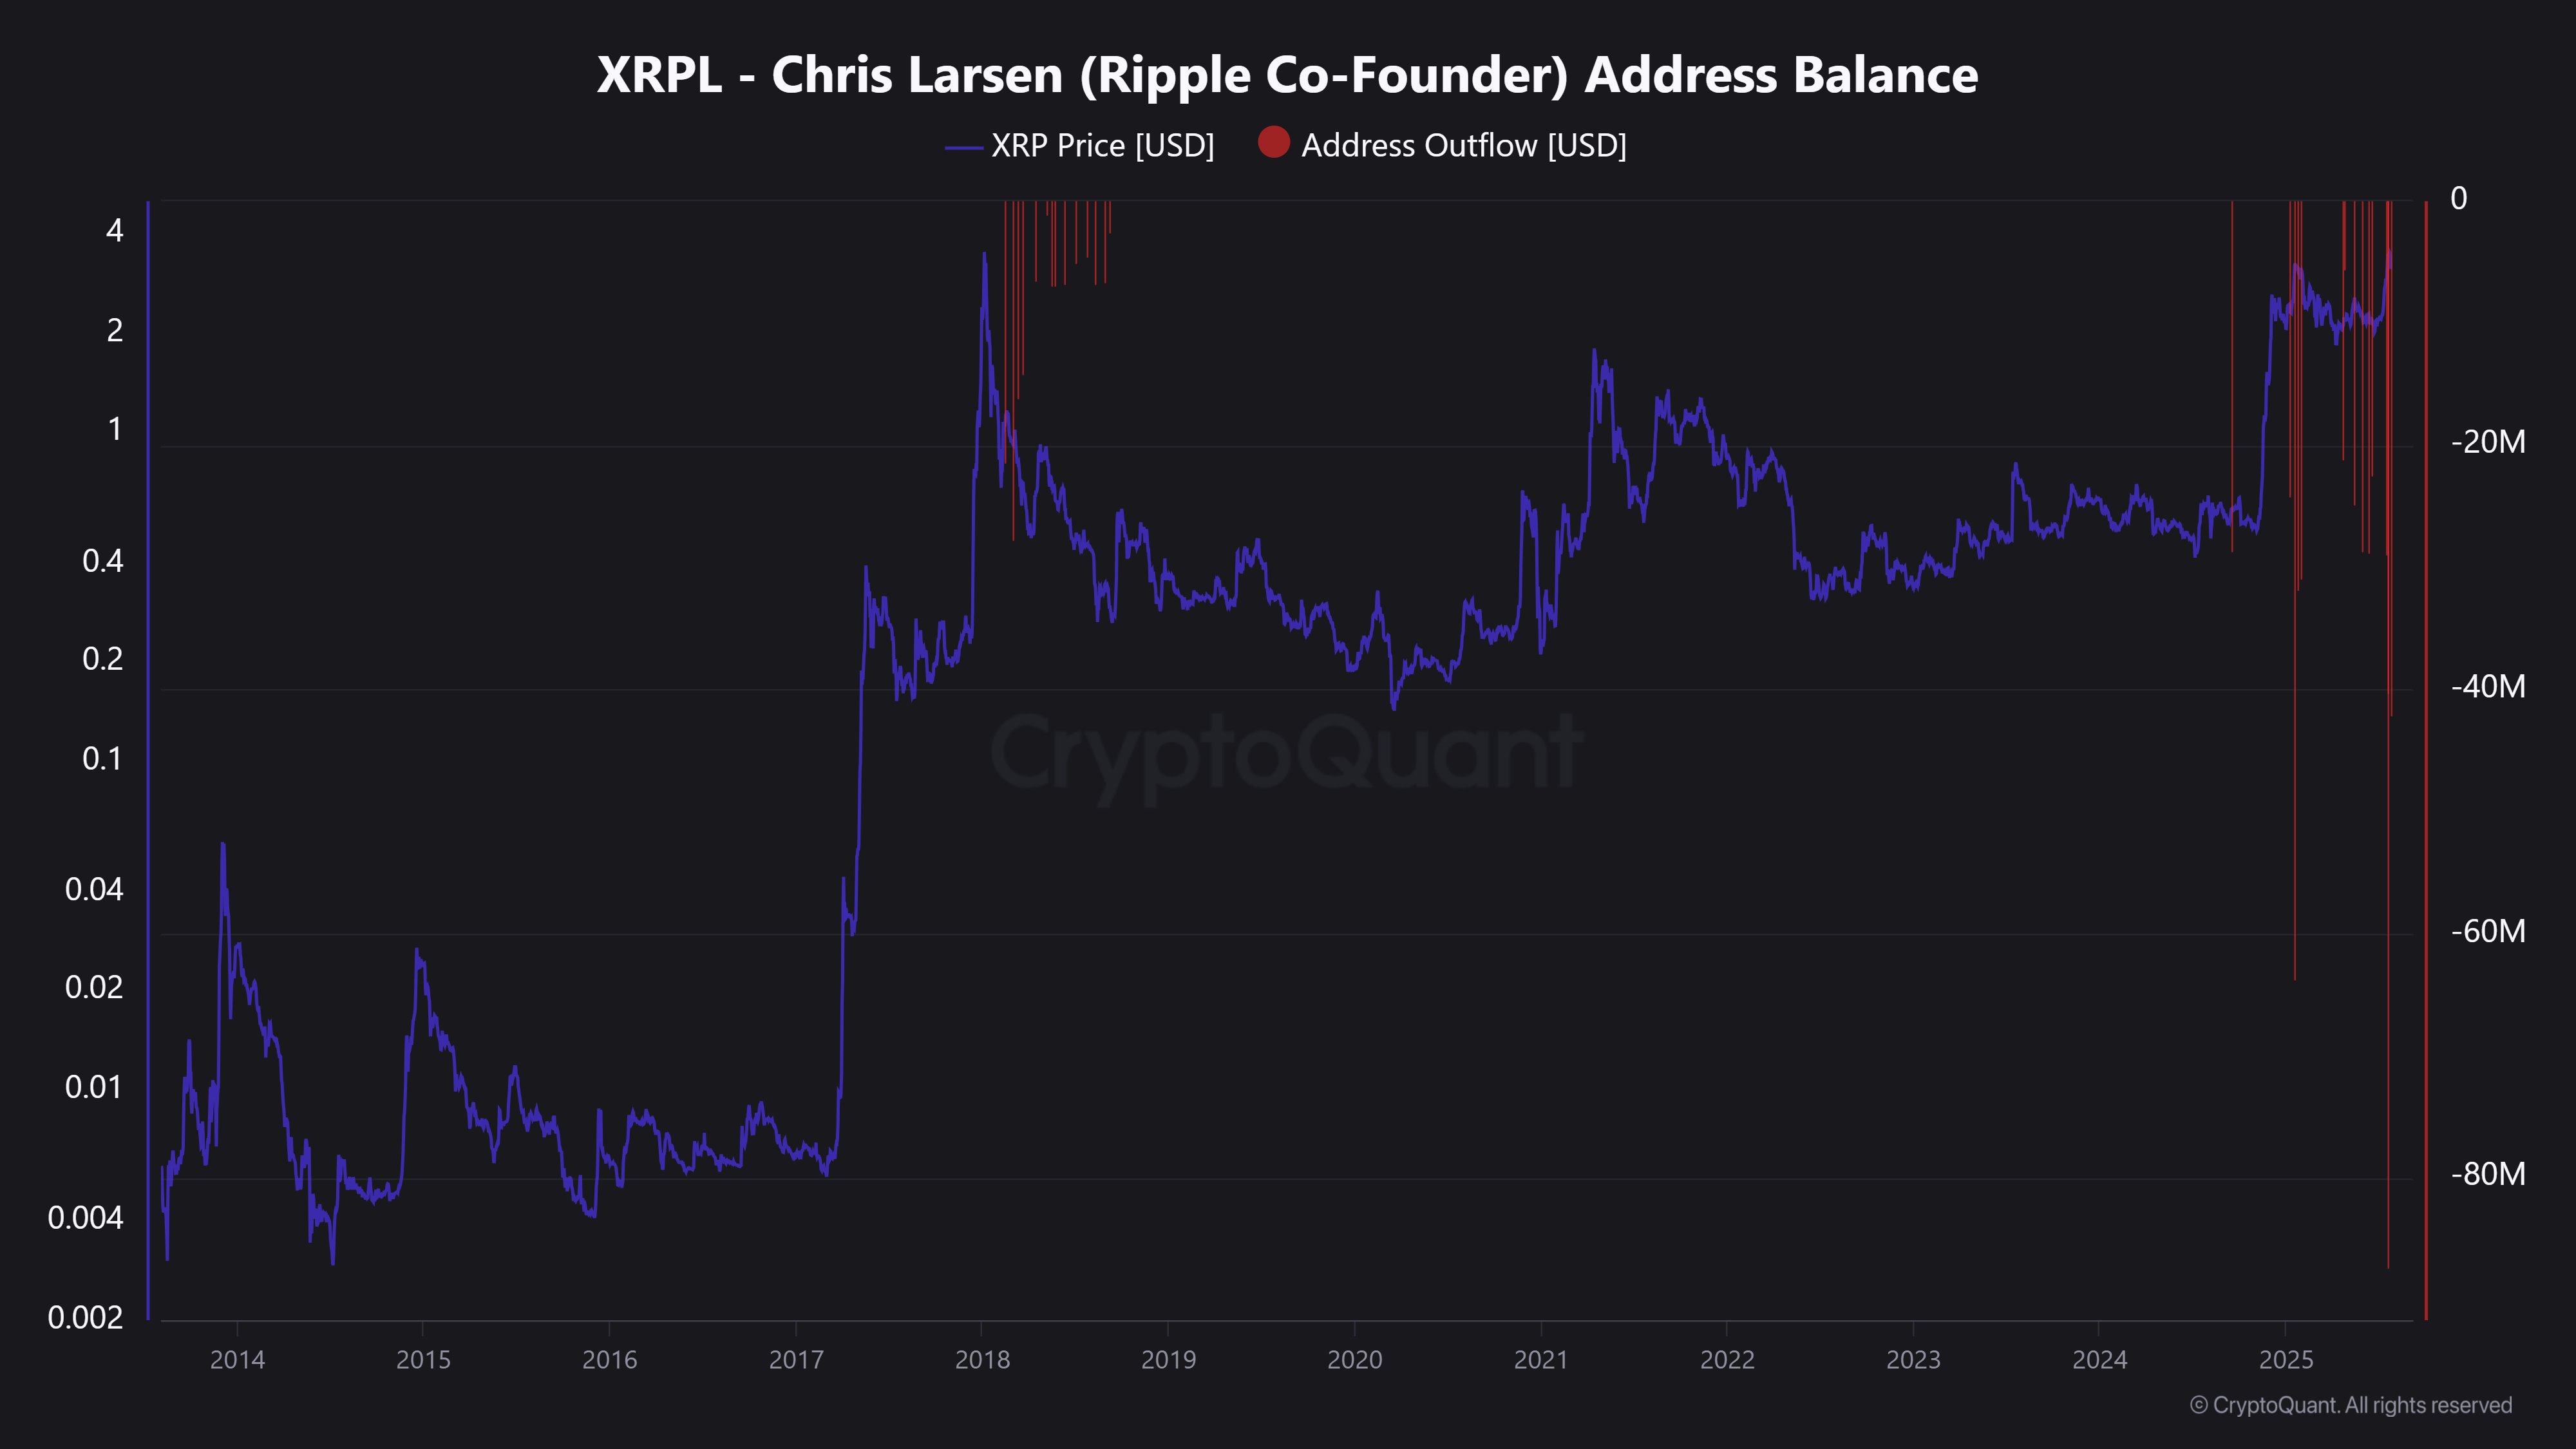
The prominent market watcher issued the warning yesterday, while highlighting the XRP outflows from Ripple chairman Chris Larsen’s wallet. According to Maartunn, the Ripple chairman has sold roughly $200 million worth of XRP over the past 10 days. 

Larsen Transfers $200M Worth of XRP in 10 Days 

The accompanying chart provided insights into Larsen’s wallet, detailing how much XRP has been transferred within 10 days. The data suggested that Larsen moved the funds in four separate transactions, with each worth $20 million, $40 million, $60 million, and $80 million. This brought the total outflows from Larsen’s wallets to roughly $200 million. 

Data from CryptoQuant shows that since July 15, the Ripple co-founder has transferred XRP from his public wallet on four occasions at different price levels. For the first transaction, which occurred on July 15, Larsen transferred roughly 10 million XRP, valued at $28.8 million (with each XRP priced at $2.88). 

Two days later, precisely on July 17, he moved another 12.5 million XRP when the token was trading at $3.22, bringing the total value to $40.25 million. When XRP rose to $3.49 on July 18, Larsen presumably sold another 25 million XRP, valued at $87.25 million. 

Notably, the last outflow was recorded on July 23, with Larsen’s wallet transferring another 12.5 million XRP, worth $42.12 million. Overall, Larsen’s XRP balance has decreased by 2.56% within 10 days from roughly 2.34 billion XRP to around 2.28 billion tokens. 

CryptoQuant chart of Chart Ripple Chairman XRP wallet
CryptoQuant chart of Ripple’s Chairman XRP wallet

“XRP Holders Are Exit Liquidity”

Following the transfers, Maartunn emphasized that anyone still buying XRP is probably being used as the exit liquidity for Larsen’s sell orders.

The market commentator warned that the Ripple co-founder is selling his XRP holdings to unsuspecting retail investors. Accordingly, he urged investors to reconsider buying XRP.

It is worth mentioning that Larsen has sold significant amounts of XRP this year. According to a July 17 report by The Crypto Basic, Larsen has offloaded approximately 106 million XRP, worth $344 million at the time, since January 1, 2025. 

The report suggested that the Ripple chairman transferred most of these funds to liquid exchanges, such as Coinbase. At the moment, he has an estimated net worth of $9 billion with about 2.8 billion XRP tokens. 

Expert Projects Shiba Inu Target After Explosive Breakout from Long-Term Downtrend

0

A market analyst believes that the recent downtrend is part of a larger bullish picture for Shiba Inu, following an explosive breakout.

The current Shiba Inu plight mirrors that of the broader cryptocurrency market. The meme coin has given back most of its gains from the previous week, retracing to $0.00001330 at the time of writing.

Nonetheless, optimism remains high among  Shiba Inu proponents. They view the setback as temporary, remaining resolute that prices will rebound quickly.

Momentum Shift After Shiba Inu Breakout

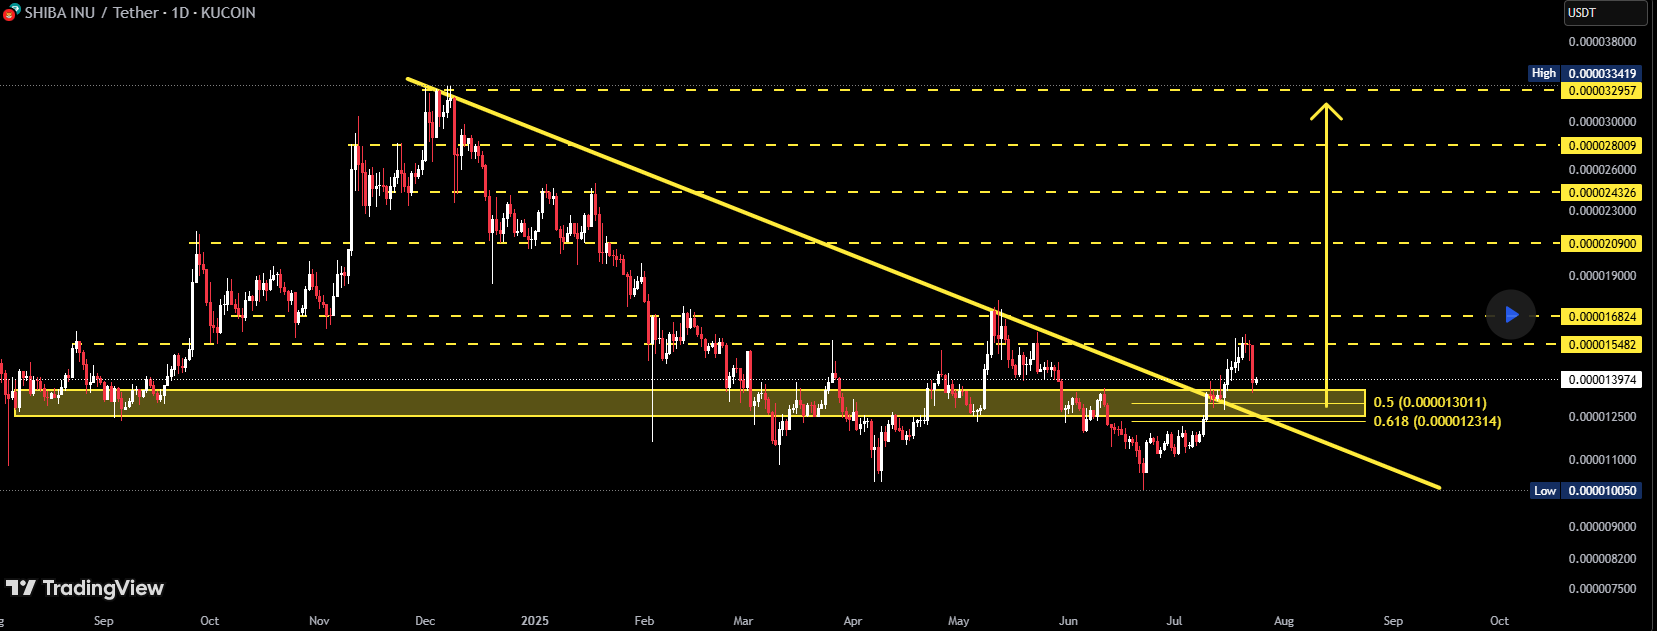
Notably, CryptoNuclear agrees with Shiba Inu bulls, sharing the sentiment that the correction is part of a broader bullish picture. His recent TradingView analysis highlights why Shiba Inu is likely to target higher prices in the near term.

For context, the market watcher noted that Shiba Inu recently broke out from a major descending resistance trendline on the daily timeframe after months of suppression. SHIB has been trading below the trendline since its December high of $0.00003343, with an attempt to break out in May failing to materialize.

Finally, Shiba Inu recorded an “explosive breakout” on July 15, drawing momentum from a broader market uptrend. According to CryptoNuclear, this was not a minor breakout but one that marked a macro trend reversal. He noted that this could build bullish momentum fast for Shiba Inu, setting it on course for new highs.

Shiba Inu Target After Resistance Retest

However, Shiba Inu’s price has receded from its high of $0.00001597 on July 21, tilting towards the descending resistance trendline from which it broke out. An accompanying chart suggests this is a retest of the former resistance zone before the next leg up.

Shiba Inu Target CryptoNuclear
Shiba Inu Target | CryptoNuclear

Meanwhile, the analyst highlighted the 0.50 Fibonacci level at $0.000013011 and the 0.618 Fibonacci level at $0.000012314 as possible targets for the retracement. After this, he predicts a quick reversal with momentum from the breakout and retest, sparking a price rally.

Remarkably, he has a target for the projected bullish reversal. While the chart shows multiple areas where Shiba Inu might have a brief stop, his ultimate projection is that Shiba Inu will reach $0.0000329. Notably, this is close to its December high of $0.00003342 and would mark a 144% rally from its current price of $0.0000133.

Interestingly, other analysts share a similar target. Maddox Metrics recently noted that Shiba Inu is ready to move, with its next target at $0.0000350. Meanwhile, Tradersboat predicted a rally to $0.0000250 first before any further uptrend.

Moreover, there are far higher targets for Shiba Inu this bull cycle. Ilagodzilla projected a run to $0.000158 and $0.000250, insisting that the current SHIB price is a bargain.

CryptoQuant CEO Says The Bitcoin Cycle Theory Is Dead: Here’s Why

0

CryptoQuant CEO Ki Young Ju becomes the latest to assert that the Bitcoin four-year cycle no longer applies, following the emergence of institutional traction.

He shared in a Thursday tweet that the Bitcoin cycle is now dead, as new institutional activities highlight a shift from the previous market stereotype. His comments build on his past admission that he was wrong about calling Bitcoin’s top a few months back.

From Calling The Bitcoin Top to Repentance

For context, Young Ju claimed in March that the Bitcoin bull cycle was over, stating that every indicator pointed to the start of a bear market. At the time, Bitcoin hovered around $83,000, with incessant whale liquidations fueling the sentiment.

The Bitcoin bull score dropped to multi-year lows. Also, the bull-bear market cycle (BBMC) indicator and the Market Value to Realized Value (MVRV) ratio all flashed bearish signals, causing the market to panic at the time.

Nonetheless, things quickly turned around for Bitcoin after April’s support retest, and BTC’s flight started. By May, Bitcoin had surpassed its January peak price, hitting a new all-time high of $112,000. Bitcoin went on to reach $123,000 this month before the present retracement.

This forced Young Ju to reconsider his earlier predictions and publicly admit that he was wrong. He noted that the crypto market has seen a new dynamic, following institutional influx through several Bitcoin-focused investment vehicles.

The End Of the Bitcoin Bear Market?

Yesterday, he reiterated his new bullish stance, citing the changing landscape in the cryptocurrency market once again. According to him, the Bitcoin cycle theory is dead amid the growing institutional adoption of Bitcoin.

The CryptoQuant founder emphasized that his “bull cycle is over” call was based on previous cyclical occurrences. Then, Bitcoin whales accumulated during the cycle’s first year. When Bitcoin rallies to new all-time highs three years later, they sell to retail traders, who usually join the party late.

However, this pattern has changed. Now, Bitcoin-hungry institutional players quickly accumulate the stash of profit-taking old whales, ensuring minimal price impact.

“Institutional adoption is bigger than we thought,” he noted, apologizing again for ignoring this market shift.

In truth, institutions are entering the crypto market in no small way. Bitcoin spot ETFs are consistently buying, facing competition from the ever-growing Bitcoin treasury companies, which purchased twice as much as the funds did in the first half of the year.

Meanwhile, Young Ju shares this new sentiment with major market players such as Michael Saylor and Binance’s CZ. Saylor recently stated that the bear market era is now extinct, with CZ projecting that his extended bullish phase would take Bitcoin to $1 million this cycle.

Christie’s Now Accepting Crypto for $1 Billion in Luxury Properties

0

Luxury auction house Christie’s has become the first major U.S. brokerage firm to launch a crypto-enabled real estate service tailored to high-net-worth buyers.

Christie’s International Real Estate has launched a new division dedicated to facilitating real estate transactions using cryptocurrency. The move marks a significant step forward in how luxury assets are bought and sold in the digital age.

According to a report by The New York Times, the initiative brings together legal experts, crypto analysts, and transaction specialists to manage property sales where both buyer and seller prefer digital currencies over traditional bank transactions. This makes it the first major U.S. firm to offer a crypto-enabled real estate service.

Aaron Kirman, CEO of Christie’s International Real Estate, said the move follows a series of successful multimillion-dollar deals, including a standout sale of a $65 million Beverly Hills mansion bought entirely in Bitcoin.

Crypto Use Grows Among the Ultra-Rich

While still a niche practice, the use of digital currencies in property transactions is gaining traction among high-net-worth individuals. One of the biggest draws of this method is the anonymity it provides. “For high-profile buyers, privacy is everything,” Kirman noted.

Wealthy individuals, particularly celebrities and tech entrepreneurs, often purchase homes through trusts or shell companies. But with internet sleuths increasingly able to trace ownership, crypto offers a deeper layer of obfuscation. 

“Some of our crypto-based sales were so discreet that even the seller didn’t know the buyer’s identity,” Kirman added.

$1 Billion Worth of Properties Open to Crypto

Christie’s now lists over $1 billion in properties whose sellers are willing to accept cryptocurrency. These luxury listings span from upscale Los Angeles neighborhoods to the desert hills of Joshua Tree.

One such property is a modernist home in Joshua Tree priced at $18 million. It is owned by film producer Chris Hanley, who believes that accepting crypto signals openness to the new generation of tech-savvy buyers.

Mainstream Institutions Eye Crypto Integration

Beyond private sales, there’s a growing conversation about integrating crypto into mainstream mortgage financing. Christie’s is reportedly in talks with major banks to explore incorporating digital assets into financed home purchases.

Meanwhile, the Federal Housing Finance Agency (FHFA) has urged government-backed mortgage firms Fannie Mae and Freddie Mac to assess how cryptocurrencies could be counted as reserve assets in home loan risk evaluations. The move could pave the way for broader institutional acceptance of crypto in residential markets.

A Strategic Move in a Competitive Auction Market

Christie’s latest move builds on its growing presence in the blockchain economy. The firm made headlines with its record-breaking NFT auctions, and in 2022, it launched a dedicated Ethereum-based platform for sales of digital art.

Though Christie’s saw a slight decline in total sales last year, $5.7 billion, down 6%, it remains at the forefront of innovation in luxury asset trading, closely competing with Sotheby’s.

Kirman believes the future is bright for crypto in real estate. “We anticipate that in the next five years, over a third of high-end home transactions could involve cryptocurrency,” he said.

XRP Measured Move Suggests $17 as Fibonacci Circle Projects XRP to Hit $6.5, $20, and Even $35

0

Market expert EGRAG Crypto has presented three bullish XRP Fibonacci circle targets alongside his measured move following the bull flag breakout. 

EGRAG’s latest market commentary comes on the back of the market-wide upsurge that has pushed XRP price beyond its multi-month range. For context, XRP had consolidated around the $2.2 to $2.5 level since March, but a breakout happened last week, allowing the price to retest $3.60 before pulling back to the current price of $3.10.

XRP Forms Bull Flag Following January Peak

Amid this renewed bullishness, EGRAG has presented its XRP targets for when the run leads to greater heights. His chart shows that XRP formed a bull flag following the impressive 580% run from November 2024 to January 2025. 

Specifically, after hitting the seven-year peak of $3.60 in July 2025, XRP witnessed intense selling pressure. This eventually led to a pullback and subsequent consolidation that has lasted for some time, resulting in the formation of the flag. 

For context, such flags indicate that an asset is “taking a breather” after an initial explosive surge. Notably, following such surges, the price could either pull back close to its initial position or consolidate. A consolidation is often bullish, confirming that the bulls have maintained the uptrend and are awaiting the second upsurge for a greater run.

This pattern occurred during the 2017/2018 bull run. First, XRP surged over 7,100% to $0.3988 by May 2017. However, it faced resistance and then consolidated for seven months, forming a bull flag. After this, XRP broke above the flag, embarking on a second push to the all-time high of $3.8 in January 2018. 

XRP Fibonacci Targets After Breakout

Interestingly, in the current cycle, XRP appears to have also broken above the bull flag this month, July. However, it will need to retest this fragile breakout to confirm it before the next leg up. 

In his analysis, he suggested that upon the breakout, XRP would first need to breach the Fibonacci 1.414 during the uptrend. According to him, this would be the most important move, as the Fib. 1.414 has served as the major resistance level since December 2024.

Accordingly, once XRP pushes past this level, EGRAG presents three bullish price targets, each representing a new all-time high. Notably, the first target is the $6.5 price level, which aligns with the Fibonacci 1.618 extension. The second target hovers around Fib. 1.888, sitting at $20. Meanwhile, the last target is an ambitious $35 price at Fib. 2.0.

However, EGRAG confirmed that its measured move target stands at an average of $17. The analyst advised that investors should adopt a Dollar Sell Average (DSA) approach. This would allow them to take advantage of lower targets until the top. According to him, they should not wait for one particular target.

ONDO Price Prediction: Analyst Targets $2.80 as Token Forms Bullish Pattern

0

Analyst predicts ONDO could surge to $2.80 as the token forms a bullish chart pattern, signaling strong upside potential for investors.

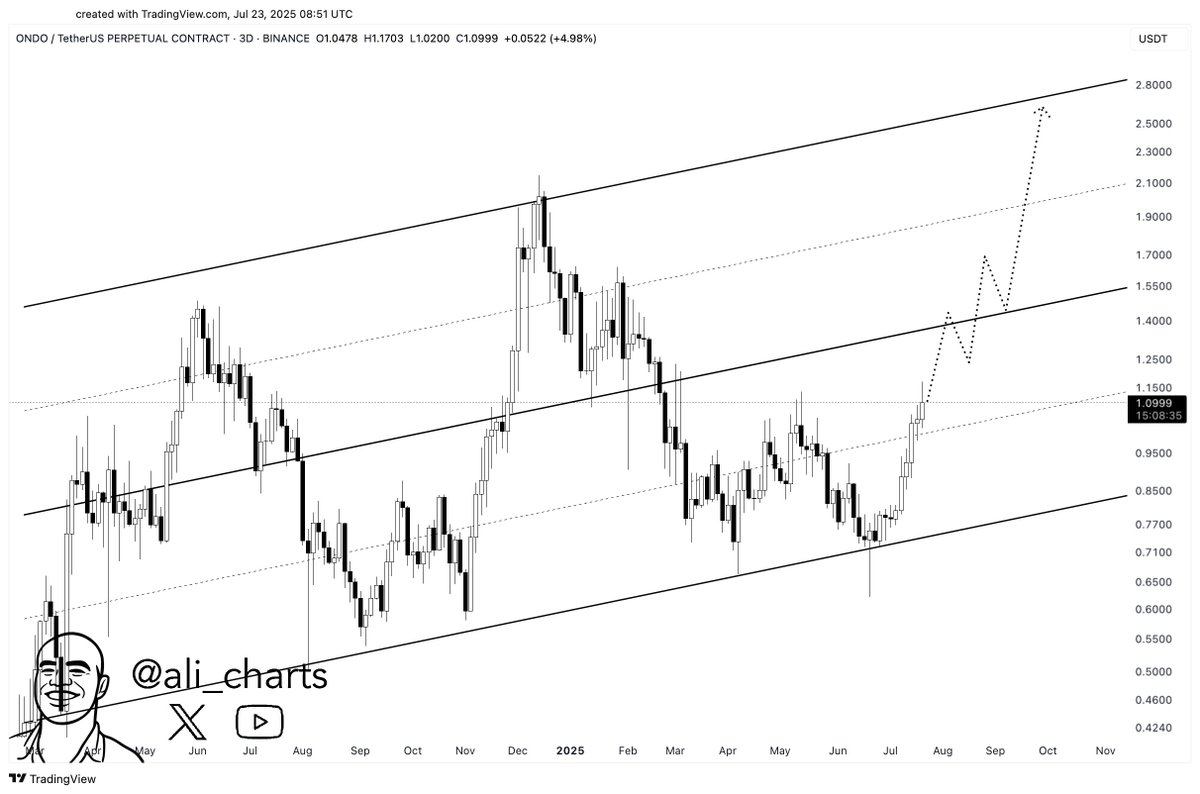
Prominent crypto analyst Ali has identified a bullish setup for ONDO, forecasting a potential rise to $2.80. The prediction, shared on X, is supported by technical chart data showing an ascending channel. Despite the bullish prediction, ONDO currently trades at $0.998, a 6.6% decline in the past week. 

Bullish Channel Remains Intact

The chart from TradingView outlines an ascending parallel channel that has guided ONDO’s movement since mid-2024. The pattern includes a lower support trendline near $0.70, a midline around $1.40, and an upper resistance near $2.80.

According to the chart, ONDO recently moved above the lower boundary and showed signs of upward momentum. While the recent price correction has pulled the token just below the $1 mark, the overall channel remains intact. The analyst suggests a breakout past the midline at $1.40 could trigger a stronger upward move toward the $2.80 level.

Short-Term Decline, Long-Term Potential

Although ONDO’s drop in recent days may raise concerns for short-term traders, the broader technical setup still signals growth potential. Price movement within ascending channels often reflects bullish conditions as long as the lower support holds.

The recent dip could represent a minor retracement rather than a trend reversal. The price had previously climbed from support near $0.70 to a local high above $1.20. If ONDO maintains structure within the channel and regains momentum above $1.00, the upward path remains open.

Adding to the bullish sentiment, Crypto Catalysts highlighted ONDO’s recent technical setup, noting that while the token was trading at $1.03 earlier, it has since dipped below $1. Despite the pullback, the analyst pointed to a breakout above previous resistance on the chart, supported by rising trading volume.

The shared chart includes an upward arrow, indicating expectations of a continued rally with a potential move toward $2. The crypto traders urged traders not to overlook ONDO, suggesting the technical structure remains valid.

Ondo Bullish Catalysts Go Beyond Charts 

Earlier this week, ONDO/USDT began trading on the Binance U.S., marking a key step in the project’s push to bring real-world assets on-chain. Historical records reveal tokens always surge in price once listed on the exchange.

For example, since listing, FARTCOIN surged 50% with no major pullbacks, maintaining a steady climb. SPX rose 50% despite an initial 25% drop, followed by a recovery. POPCAT gained 42% after a 23% dip post-listing. This suggests ONDO could have a similar rally post-listing.

Another bullish catalyst came from 21Shares filing a preliminary prospectus with the U.S. Securities and Exchange Commission for an ETF that would track the spot price of ONDO, the native token of Ondo Finance. The proposed “21Shares Ondo Trust” aims to offer passive exposure to ONDO by holding the token directly, with pricing based on the CME CF Ondo Finance-Dollar Reference Rate.

While chart patterns signal a possible move above $2.00, several external factors could still influence ONDO’s path. Broader market trends, including Bitcoin’s performance and macroeconomic news, often affect the behavior of altcoins. Notably, the recent decline in ONDO’s price coincides with Bitcoin’s performance. Bitcoin is trading at $115,564, a 2.0% decline in the past day, increasing its loss in the past week to 3.9%.