Home Blog Page 674

Here’s XRP Minimum, Average, and Maximum Price Outlook for 2030

Discussions about how high XRP could go by the end of this decade have resurfaced in the crypto community.

Crypto influencer Cobb Alex triggered the conversation with a recent tweet. He asked XRP enthusiasts if they agreed with a long-term price analysis published by Telegaon researchers. The analysis outlines how XRP’s price could evolve from this year to 2050.

Specifically, the analysis projects that XRP could rise from $2 to as high as $285 over the next 25 years. It highlights minimum, average, and maximum outlooks for the coin throughout this period.

XRP Price by 2030

For instance, Telegaon argues that XRP’s average price in 2025 would be $4.16, although this price has remained elusive. Six months into 2025, the coin has yet to break its all-time high. Meanwhile, the platform suggests a maximum price of $5.87 for XRP this year.

For next year, the analysts project an average price of $7.53 and a maximum price of $9.18. Telegaon’s forecasts suggest XRP will break the double-digit price level by 2027, though broader sentiment among enthusiasts and analysts is that XRP could hit that threshold this year.

Looking further ahead, the report argues XRP could trade at a minimum price of $36.86 by 2030. In that year, it expects XRP’s average price to be $42.34 and projects a maximum value of $48.03.

Five years later, it expects XRP to average $78.16 and reach a maximum of $87.49. As for 2040 and 2050, Telegaon believes XRP could break into the triple-digit price range. During this time, it projects a minimum price of $119.08 and a maximum value of $285.56.

Overall, the analysis sees a promising future for XRP over the coming decades, highlighting values that would place its market cap in the trillions of dollars.

No More Bear Market for XRP?

Essentially, the report suggests XRP’s price will only go up over the years, never dipping, and each year’s maximum price will become the next year’s minimum. In effect, it fails to account for bear market scenarios.

One commenter pointed this out, noting that the projected minimum prices flaw the analysis. He argued that XRP would likely fall below $1 during bearish periods, so projecting a scenario where XRP only moves upward is unrealistic.

Another commenter humorously reinforced this view, saying, “If you believe there will be no more bear markets, I have a bridge to sell you.”

“No Way It Takes a Decade for XRP to Reach $100”

Meanwhile, optimistic voices argued that the projections are actually conservative. Some even claimed the analysis underestimates XRP’s potential. One commenter argued that XRP could hit $20 by the end of this year, opposing Telegaon’s 2029 timeline.

Another insisted that there’s no way XRP would take 25 years to reach a $100 price, as the report suggests. This viewpoint implies XRP could reach that level much sooner. 

Given the long timeline to $100, some commentators speculated that the analysis might have come from Bitcoin maxis. Ultimately, these comments highlight the inflated short-term expectations many have for XRP.

PEPE Risks Breakdown Below $0.00001 Amid Whale Activity

The price of PEPE dropped 20% in six days as it tested the $0.000010 support. Whale activity surged, raising concerns of a deeper correction.

At a critical juncture, PEPE risks losing the $0.000010 psychological level as selling pressure intensifies. Will the increased whale activity, combined with the ongoing downtrend, push Pepe to a new monthly low?

PEPE Price Analysis

On the daily chart, Pepe is struggling to stay above the $0.00001037 support level. With an intraday pullback to $0.00001024, PEPE has recorded its lowest trading price in the past 30 days.

This reflects mounting overhead selling pressure, which has driven a 20% decline over the last six days. With market sentiment turning increasingly bearish, a daily close below the psychological $0.000010 level could extend the correction to the $0.0000090 support zone — a level that previously acted as significant resistance.

If bearish momentum continues, the downside risk could stretch further to $0.00000570, representing the lowest closing price of the year to date.

BINANCE:SHIBUSDT Chart Image by Trojan69420

On-Chain Data Signals Whale Sell-Off

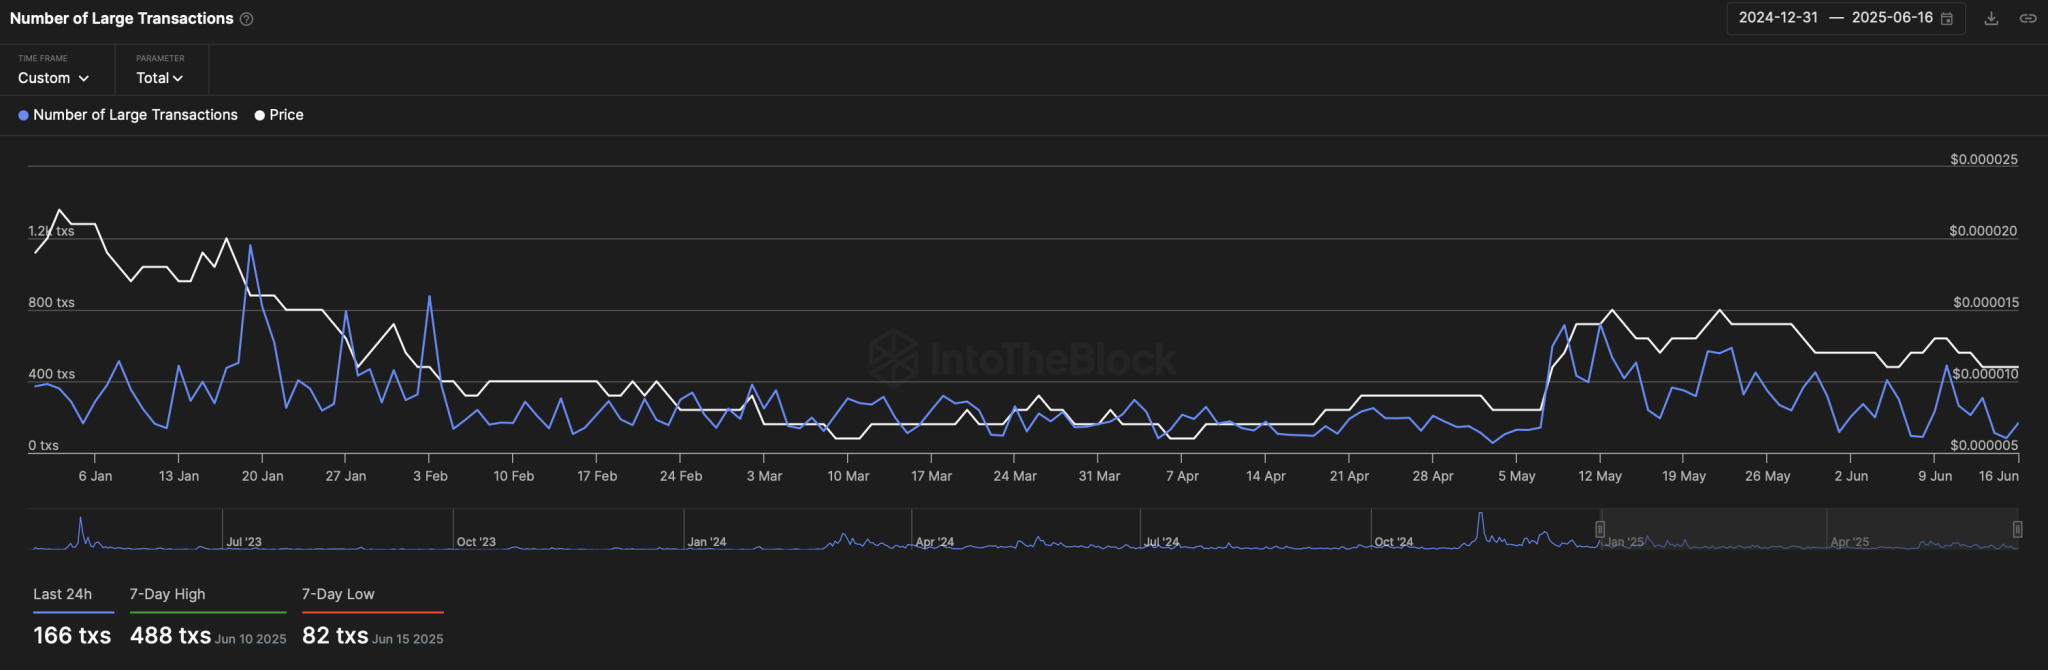
According to data from IntoTheBlock, the number of large transactions (over $100,000) has significantly increased over the past 30 days. Since early May, the number of these transactions has risen compared to the relatively quiet period between February and April.

Typically, a surge in large transactions can indicate the formation of a cycle top or bottom. Given the rising selling pressure, the uptick in large transactions may point to potential sell-offs by Pepe whales.

As such, the on-chain data supports the case for increasing downside risk in the frog-themed meme coin.

PEPE Number of Large Transactions

Fear Emerges in PEPE Derivatives

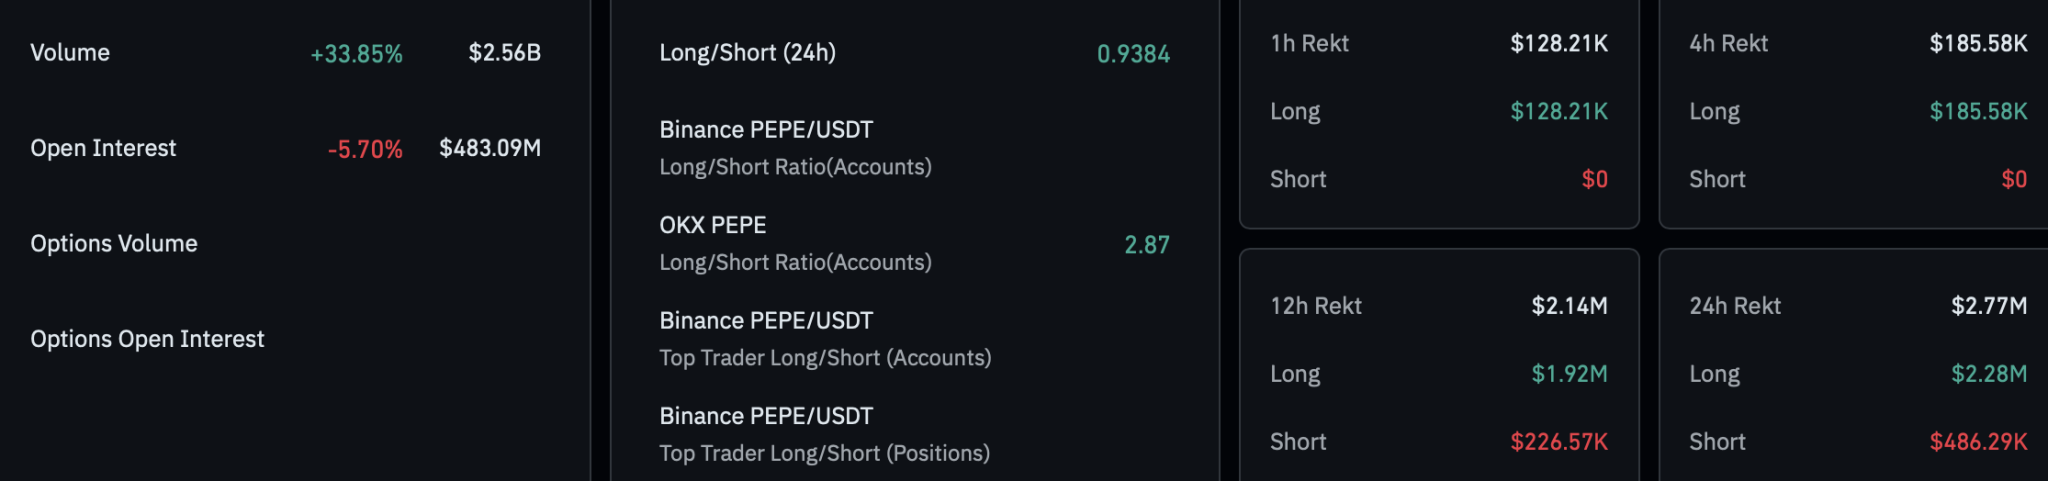
CoinGlass data also shows a decline in PEPE’s open interest by 5.70%, now at $483.09 million. Over the last 24 hours, liquidations totaled $2.28 million in long positions, compared to just $486,000 in short liquidations.

PEPE Derivatives
PEPE Derivatives

This imbalance has pushed the long-to-short ratio down to 0.9384, reinforcing the bearish sentiment. Overall, the PEPE derivatives market suggests traders are bracing for a significant correction.

Shiba Inu Price Eyes Channel Breakout: Can SHIB Bounce Back?

Shiba Inu is consolidating within a falling channel, as technical indicators hint at a potential bullish breakout. Will SHIB reclaim $0.00001390 or face further downside?

With the broader crypto market recovery gaining momentum, meme coins like Shiba Inu are positioning for a trend reversal. Holding support above $0.00001100, Shiba Inu is preparing for a channel breakout. Could this breakout rally test the 23.60% Fibonacci resistance at $0.00001390? Let’s find out..

Shiba Inu Price Analysis

On the daily chart, Shiba Inu’s recent pullback has formed a falling channel pattern, beginning in mid-May, after it failed to maintain momentum above the 38.20% Fibonacci level at $0.00001639.

Since then, the pullback has led to a 30% decline, bringing the current market price to $0.00001187. However, with multiple lower-priced exchange candles, Shiba Inu continues to hold support above the $0.00001100 level.

This suggests a potential trend reversal, with the possibility of a breakout above the overhead resistance trendline. In such a scenario, a breakout rally could propel SHIB to retest the 23.60% Fibonacci level at $0.00001390.

BINANCE:SHIBUSDT Chart Image by Trojan69420

A minor bullish divergence in the daily RSI line further supports the potential for a breakout. Meanwhile, the closely aligned MACD and signal lines are on the verge of a bullish crossover.

Thus, technical indicators maintain a positive outlook for Shiba Inu. However, a deeper correction within the channel could extend SHIB’s decline toward the psychological support level at $0.00001000.

SHIB Derivatives

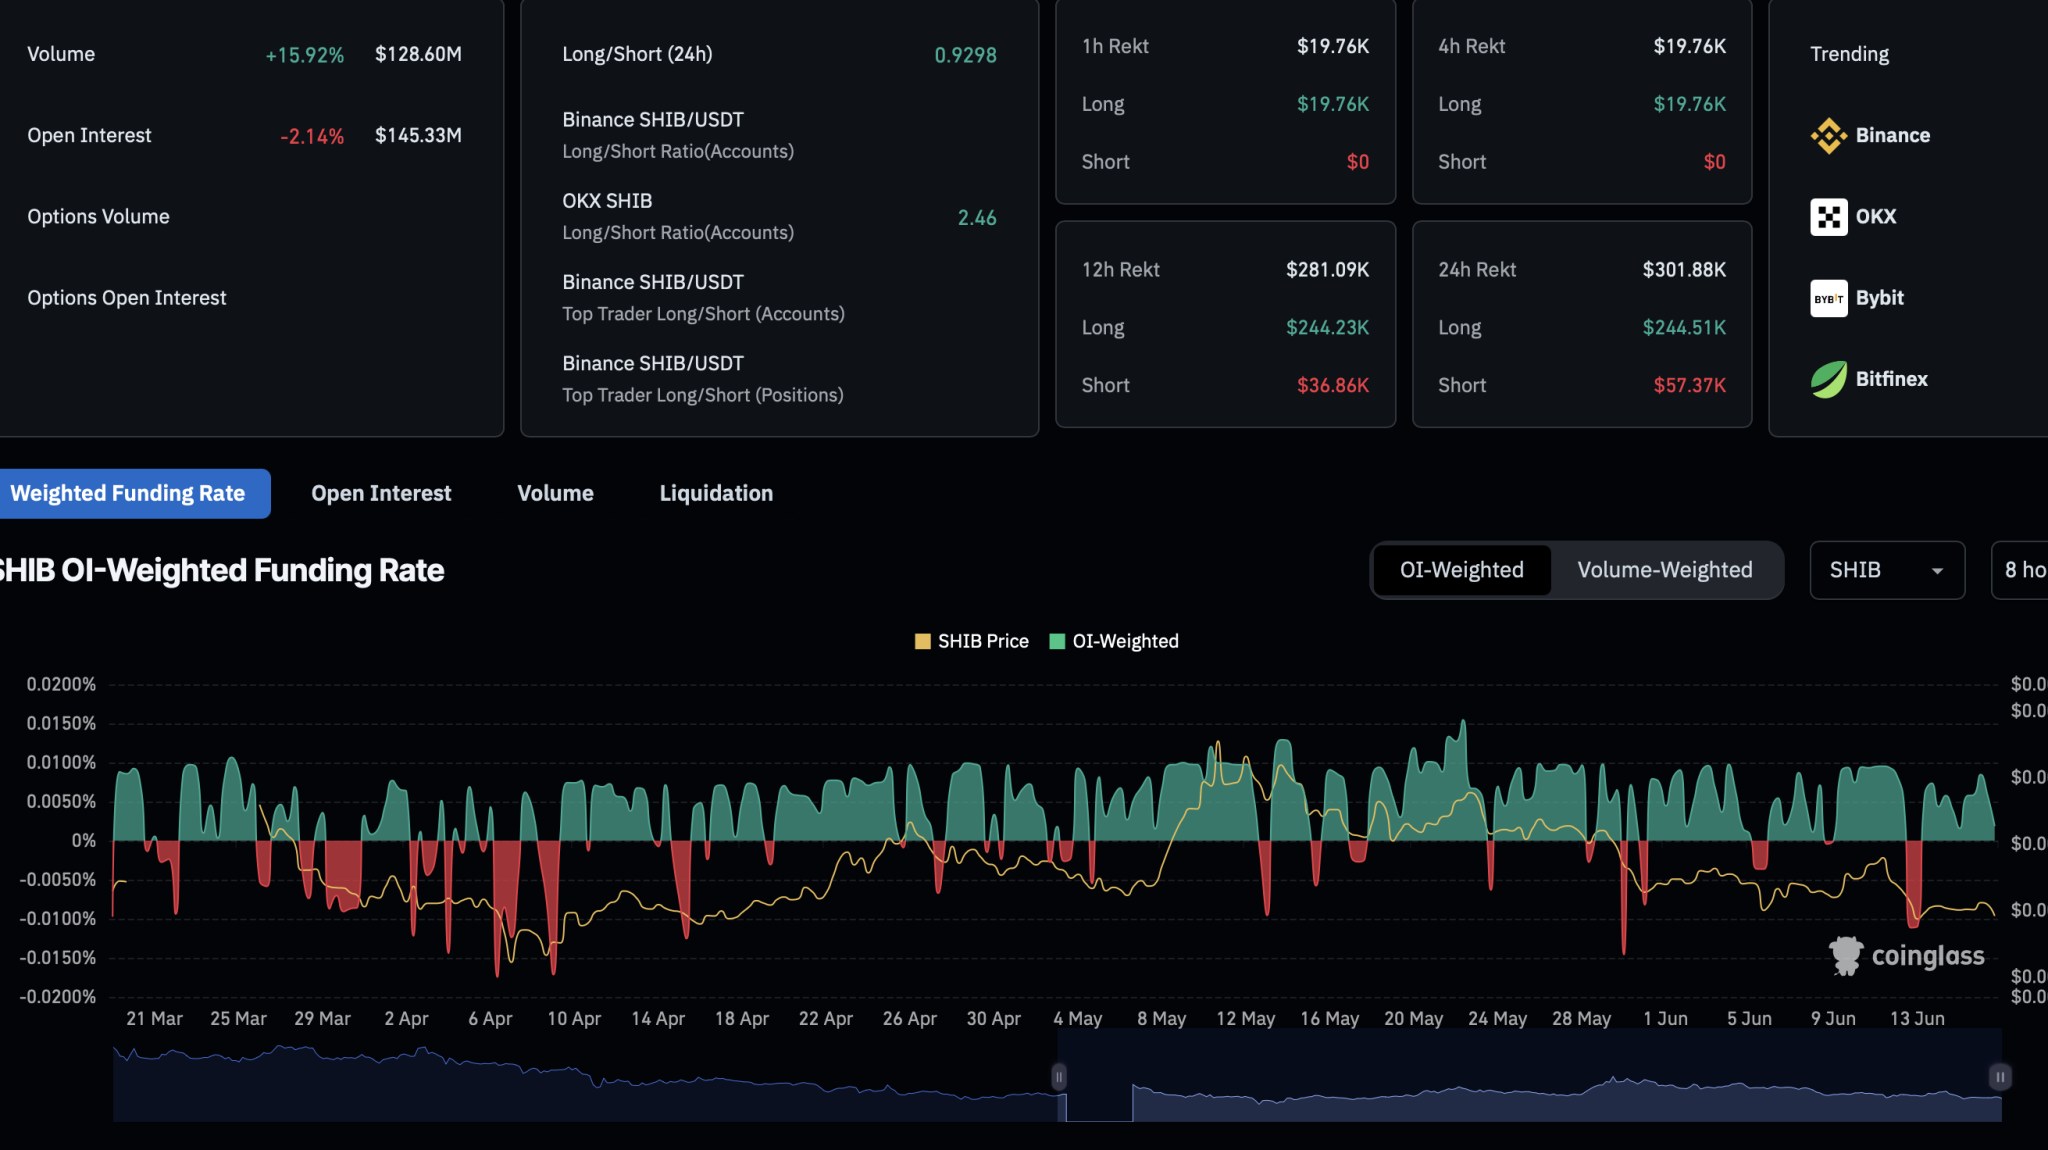
As Shiba Inu stands at a critical juncture, optimism in the derivatives market remains subdued due to ongoing price declines. According to Coinglass data, open interest has decreased by 2.14%, falling to $145.33 million, while liquidations over the past 24 hours indicate a bullish wipeout.

Long liquidations have surged to $244,000, whereas short liquidations remain limited to $57,000. This imbalance has pushed the long-to-short ratio down to 0.9298 over the past 24 hours, while the overweighted funding rate has dropped to 0.0019%.

SHIB Derivatives
SHIB Derivatives

With bullish-aligned traders being wiped out and buying activity declining, the derivatives market maintains a bearish bias. However, a breakout from the falling channel could shift sentiment and potentially revive bullish momentum for SHIB.

Analyst Shares What Cardano Needs to Do to Turn Bullish

0

A recent analysis suggests that Cardano must reclaim two crucial indicators to turn bullish amid a fifth consecutive week of price downtrend.

For context, Cardano has been correcting since the week of May 12 after hitting a high of $0.86. ADA sustained upward momentum for five weeks before the peak week, swelling 68% from an April 7 low of $0.51 to the high.

However, the tenth-largest cryptocurrency by market cap has decoupled from Bitcoin’s bullish trend, correcting nearly 27% from the $0.86 high to its current price. This places Cardano well within bearish territory.

Trend Below EMA34 and MA200 Bearish for Prices

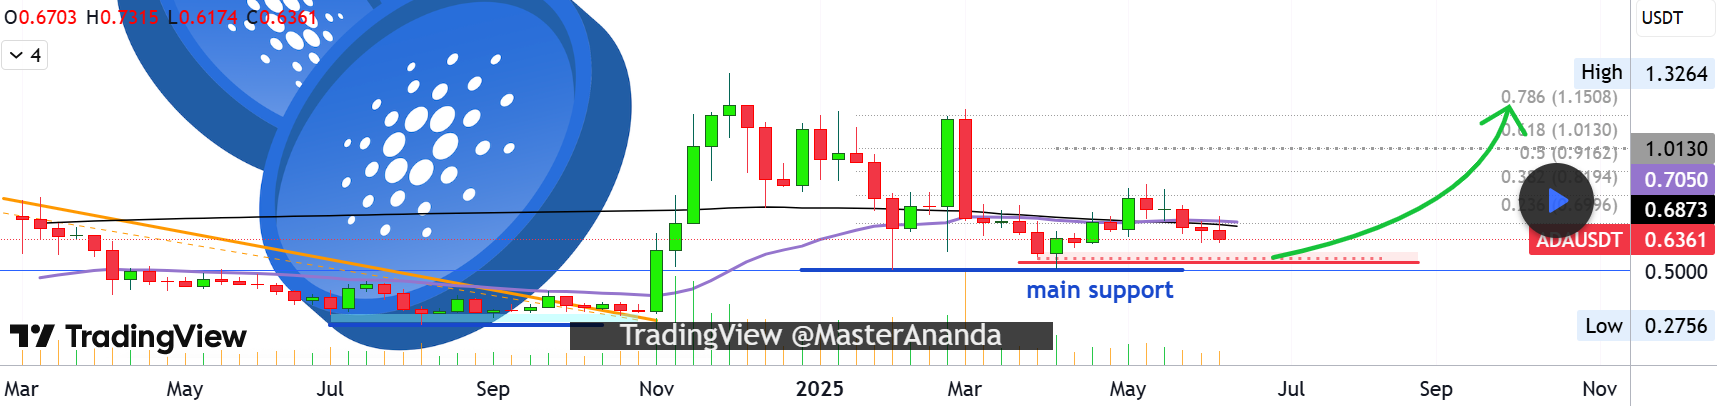
Meanwhile, the correction has seen it trend below the 34-period exponential moving average (EMA34) and the 200-day moving average, two major trend indicators. Crypto analyst MasterAnanda highlighted this bearish bias in a recent TradingView analysis.

Cardano Analysis MasterAnanda
Cardano Analysis | MasterAnanda

He noted that Cardano’s current standing between the two major trend indicators puts prices in bad shape. According to him, this makes ADA’s price look weaker compared to XRP and Ethereum. Also, he suggested Cardano could continue its bearish trend in the short term.

However, he highlighted that ADA has retraced for five consecutive weeks and may be nearing its point of price reversal. With the market seeking balance and the 27% correction already large enough, the asset could be eyeing a rebound.

Crucial Price Cardano Needs to Reclaim

Nonetheless, MasterAnanda identified the price level that Cardano needs to reclaim to regain bullish momentum. In the TradingView analysis, he stated that all things change for ADA if it regains or closes above the $0.68 and $0.70 price range.

Currently, the ADA’s EMA34 in the 1W chart stands at $0.70, while the MA200 is at $0.67, closely aligning with the range. As a result, the analyst noted that Cardano must reclaim this range and moving averages if it is to reverse predominant bearish trends.

Until then, the market watcher advised patience, especially for investors. Notably, at the current price of $0.62, a surge to the range would see ADA rally 10% and 13%.

Two Supports to Monitor

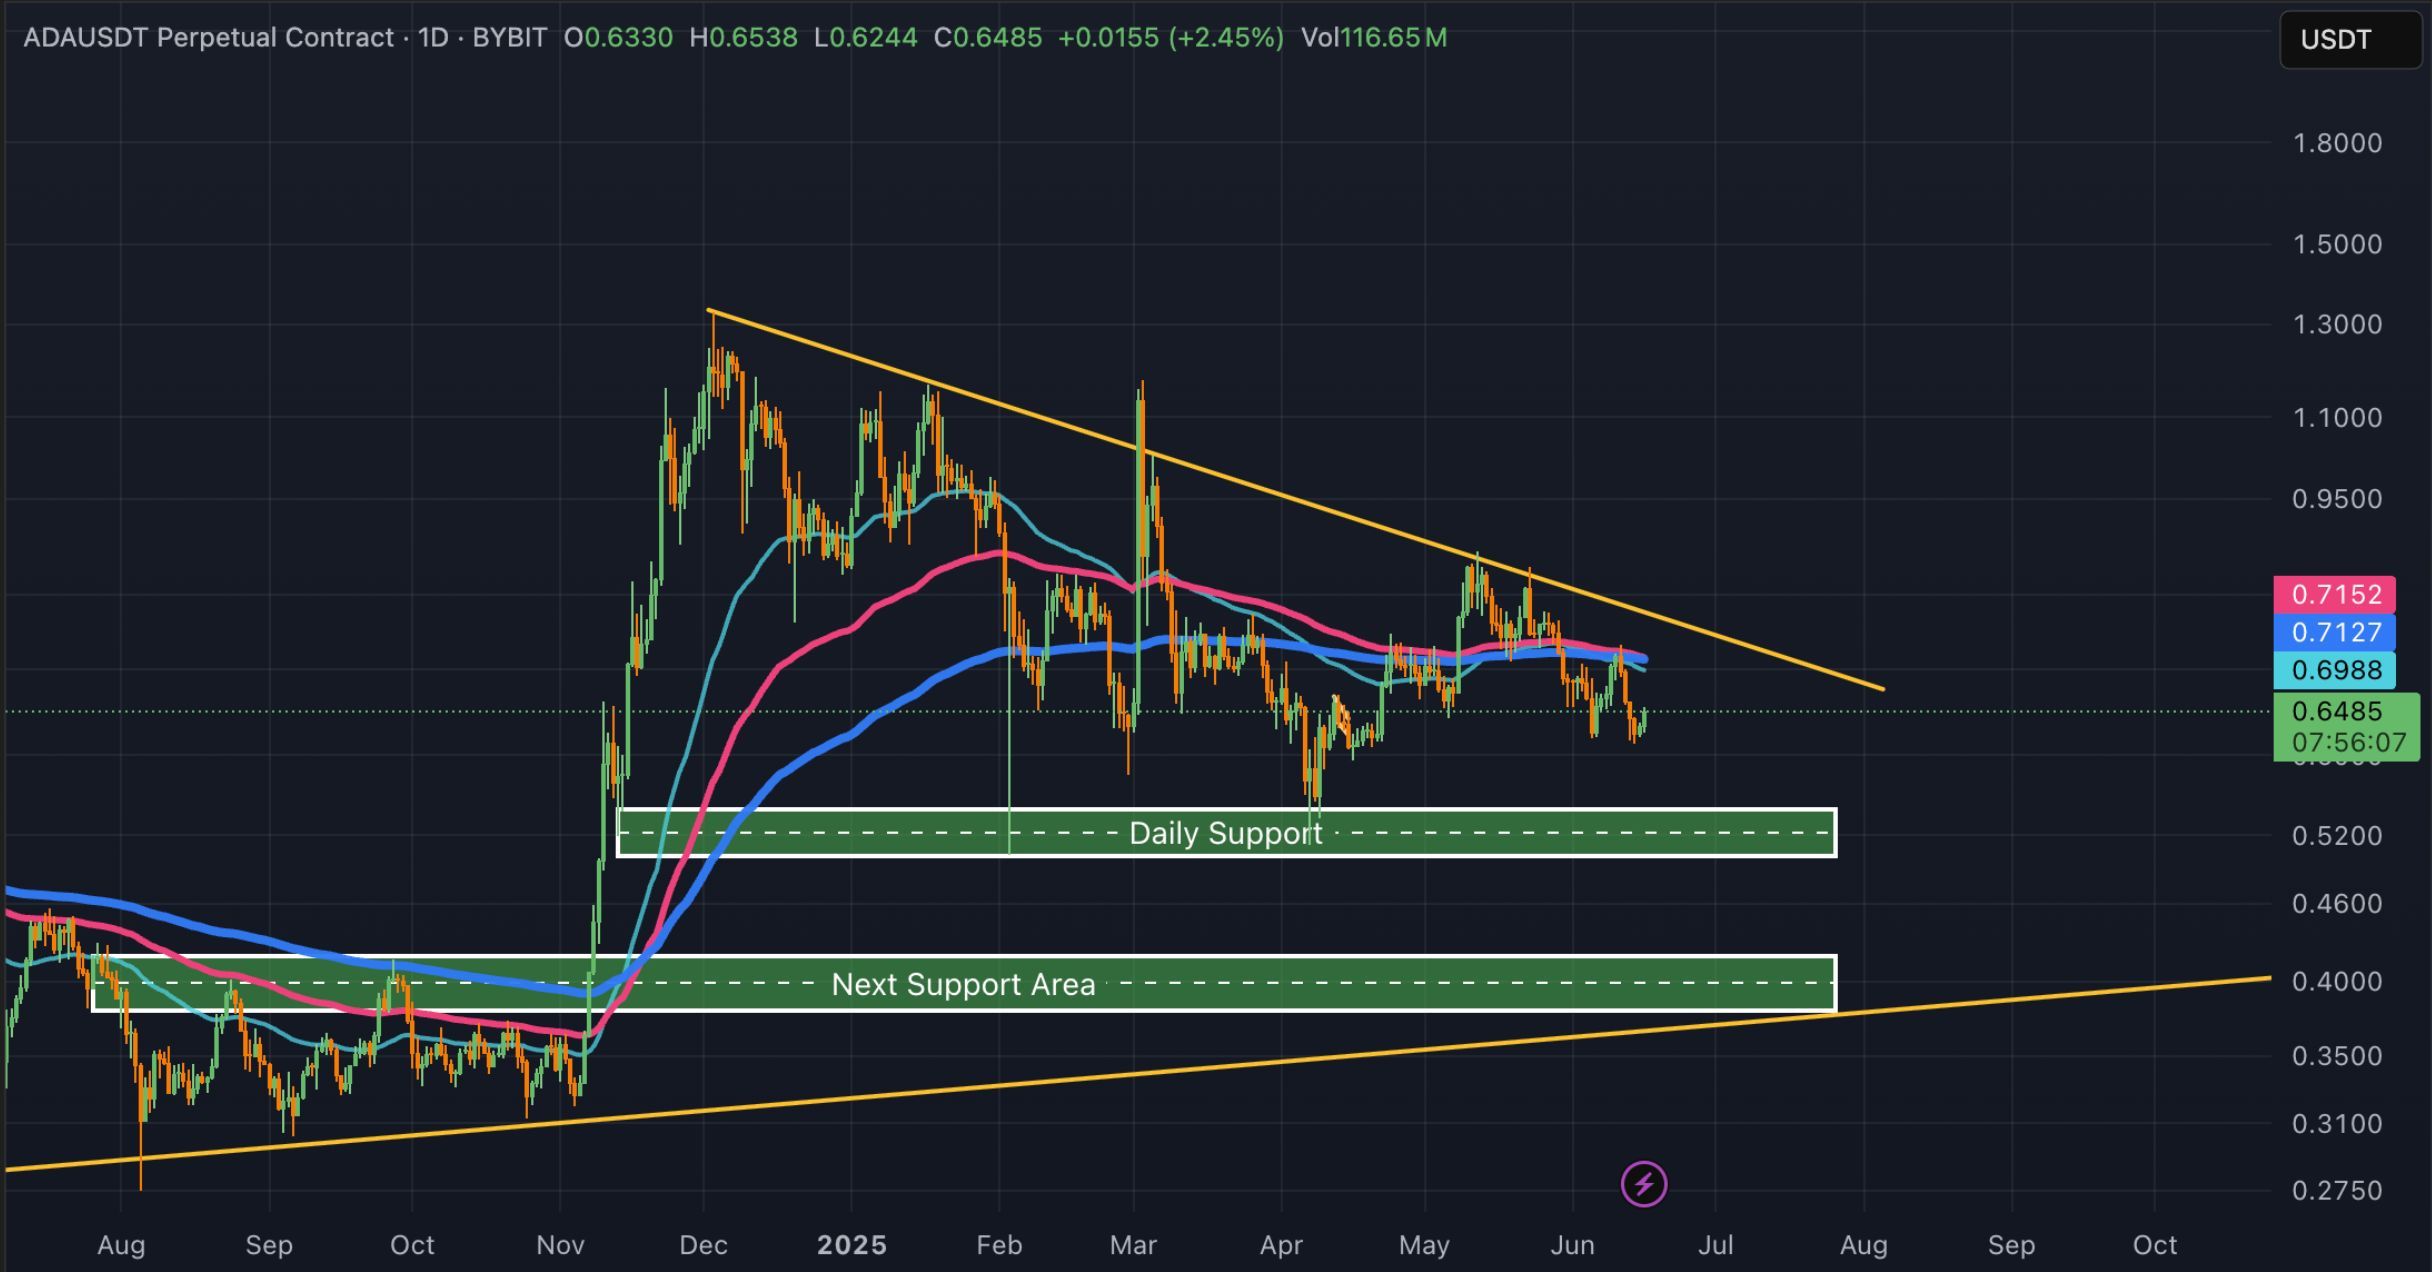
Meanwhile, analyst CryptoPulse has identified two supports to look out for amid Cardano’s bearish trends. In a parallel commentary, he highlighted the token’s trend within a descending triangle and levels to watch if price weakness persists.

An accompanying chart shows that the base of the triangle, which aligns with a major daily support, is one to watch. The demand area currently lies between $0.50 and $0.55, an area ADA has retested on two occasions this year, specifically in early February and April.

Major Cardano Supports/CryptoPulse

However, if support breaks, the analyst shared that the next major support is between $0.42 and $0.50. This support aligns with an ascending long-term trendline and was a former resistance for ADA before it broke free in November.

CryptoPulse noted that this area would be a good buy zone for ADA. Meanwhile, if the supports hold, he suggested that Cardano could reverse to retest the descending triangle’s resistance at the $0.71 and $0.75 area.

Here’s What 100M Shiba Inu Costs Today and What It Could Be Worth if SHIB Hits $0.001

0

A portfolio of 100 million Shiba Inu tokens could be worth a fortune if SHIB’s price rallies to $0.001.

Shiba Inu community members have mixed reactions following the asset’s recent bearish price action. SHIB has dropped 3.01% in the past 24 hours, falling below the $0.000012 territory.

As of press time, SHIB was trading at $0.00001189, marking a 7-day decline of 8.16% and a 30-day dip of 18.87%. This recent underperformance has dashed many investors’ hopes for a rebound, with some voicing their frustrations on social media.

However, others remain optimistic about Shiba Inu’s prospects, viewing the dip as a blessing in disguise. These investors aim to grow their SHIB holdings amid the downturn, anticipating a potential price surge to ambitious targets like $0.001. 

Current Worth of 100M SHIB

If SHIB reaches this projected target, a portfolio of 100 million SHIB tokens could be worth a fortune. At the current price of $0.00001189, investors can procure 100 million SHIB for $1,189. 

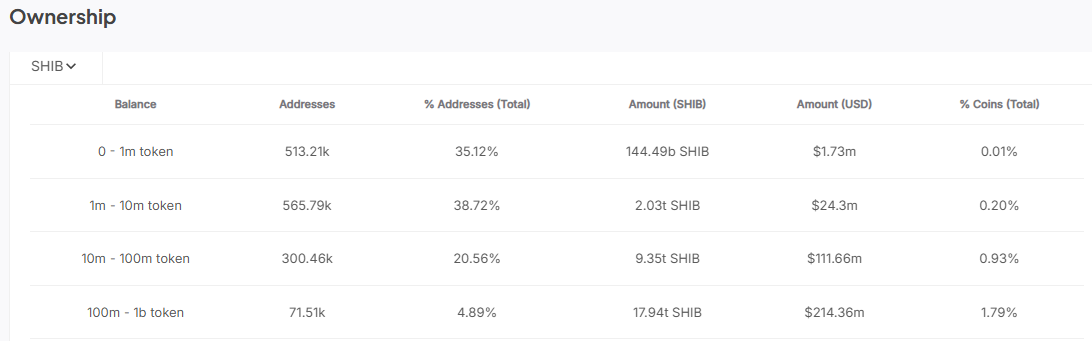
According to IntoTheBlock data, 71,510 addresses hold at least 100 million SHIB tokens, representing 4.89% of Shiba Inu’s on-chain addresses. The cumulative balance of this class of investors stands at 17.94 trillion SHIB, equivalent to $213.3 million. 

Although the cost of acquiring 100 million tokens may seem modest today, their value could increase dramatically if SHIB’s price rises to $0.001.

Addresses holding 100M SHIB

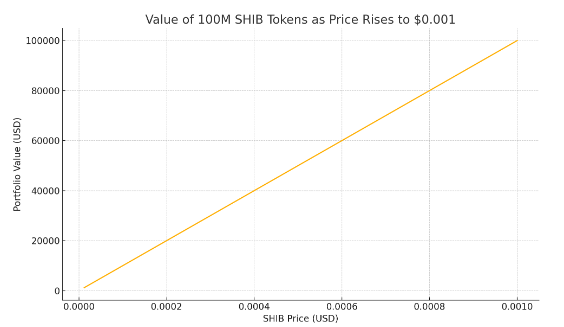
Value of 100M SHIB Portfolio at $0.001 

For SHIB to hit the $0.001 target, it would need to eliminate two leading zeros from its current price. From $0.00001189, this represents a required rally of approximately 8,310%.

At the projected price of $0.001, a holding of 100 million SHIB would be valued at $100,000, yielding a return of $98,811 from the initial $1,189 investment.

Value of 100 million Shiba Inu tokens at $0001

Most Analysts Think $0.001 Is Feasible for Shiba Inu 

While the potential gains are enticing, the big question remains whether SHIB could clinch the $0.001 target in its lifetime. For context, such a price surge would push Shiba Inu’s market cap to $589.25 billion, assuming its total supply remains around 589.25 trillion tokens.

Interestingly, several crypto analysts believe that $0.001 is a realistic target for Shiba Inu. 

In October 2024, widely followed analyst Crypto Sheriff projected that SHIB was on track to hit the $0.001 target. His prediction followed Shiba Inu’s breakout from a descending triangle chart pattern. 

Earlier, crypto expert LuckSide Crypto predicted that SHIB was poised for a move toward $0.001. According to LuckSide, potential catalysts include increased whale activity and minimal upside resistance.

Additionally, shortly after the SEC approved several spot-based Ethereum ETFs in May 2024, Coinpedia Markets speculated that inflows into ETH could positively impact SHIB’s price, potentially driving it to $0.001679.

Meanwhile, Changelly analysts forecast that SHIB could reach $0.001 sometime between 2035 and 2039. Telegaon offered a more specific estimate, predicting the milestone would be achieved by 2035.

Although many experts view $0.001 as a realistic long-term goal for SHIB, some remain skeptical, citing the token’s massive supply as a significant barrier.

Dogecoin ADX Pattern Resembles 2020 Setup, Eyes Now on $4.5 or More

0

Analyst identifies Dogecoin weekly ADX mirroring 2020 setup ahead of its last major rally.

Notably, Dogecoin (DOGE) has declined by 2.22% in the past 24 hours, trading at $0.1737, and remains down by 9.08% over the last seven days.

However, according to a recent analysis, the Average Directional Index (ADX) on Dogecoin’s weekly chart may be pointing to a developing trend shift. The ADX, used to measure trend strength, is now replicating a historical setup from late 2020 that preceded a major rally. 

ADX Weekly Setup Mirrors 2020 Pre-Rally Conditions

Tardigrade, a crypto analyst, has presented a breakdown of Dogecoin’s ADX behavior over time. His analysis shows that the current ADX pattern on the weekly timeframe closely resembles the structure seen between 2019 and 2020. 

Dogecoin ADX Trader Tardigrade
Dogecoin ADX | Trader Tardigrade

Back then, DOGE’s ADX started with a lower launch, indicated with a green arrow, then formed two mid-level peaks followed by a lower low, before surging to a top. This move aligned with Dogecoin’s breakout from $0.0025 in November 2020 to nearly $0.70 by May 2021.

Fast-forward to the 2024–2025 period, the ADX has again launched from a low, then formed two mid-level peaks—first when DOGE reached $0.22 in May 2024, and then $0.46 in December 2024. After those peaks, the ADX dipped to a lower low, which Tardigrade illustrated with a purple arrow on his chart. 

Currently, the ADX is rising again. A projected blue circle placed above the indicator suggests an anticipated breakout, which historically marked the top of a bullish trend. This potential breakout, if mirrored from the past, coincides with a speculative DOGE price around $4.50—about 2,491% above the current price.

MVRV Score Signals DOGE Still in Bear Market Territory

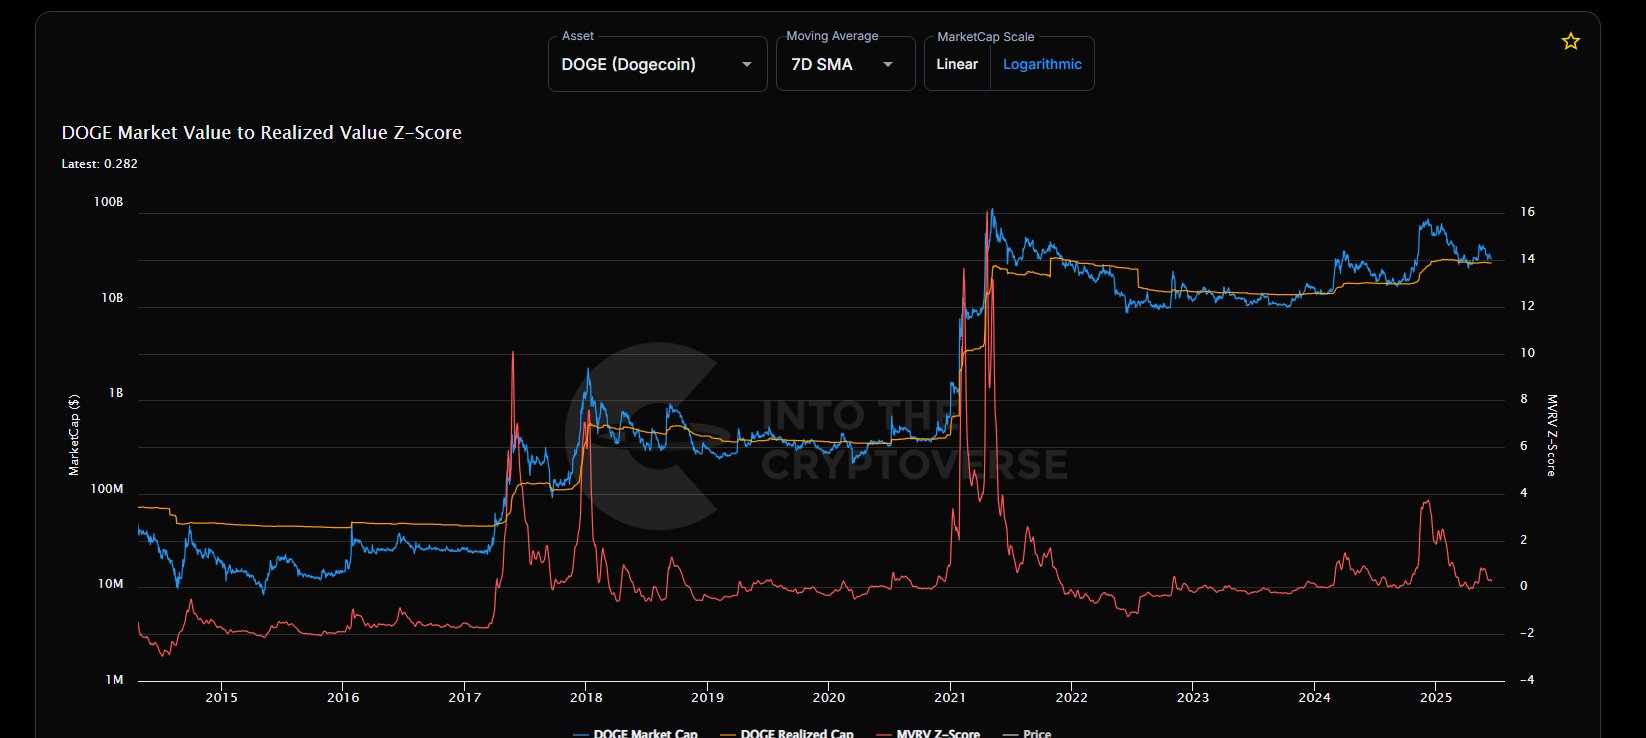
Meanwhile, another analyst, Kevin, has highlighted Dogecoin’s MVRV score as still being within bear market territory. The Market Value to Realized Value (MVRV) has reached only 3.5 in this cycle. 

Image

In contrast, DOGE peaked at an MVRV of 11 during 2017 and 16 during 2021, both of which marked full-scale bull runs. According to Kevin’s observation, this relatively low MVRV figure indicates that Dogecoin and the broader altcoin market have yet to experience a sustained upward cycle in the current market environment.

The analyst links this delay in altcoin performance to continued restrictive monetary policy and post-pandemic central bank adjustments. These macroeconomic conditions have, in Kevin’s view, contributed to a more measured pace for altcoin momentum, delaying the kind of explosive rallies seen in prior cycles.

He stated that this situation will eventually shift, allowing altcoins to gain momentum. He added that investors should aim to buy altcoins at lower valuations and avoid emotional attachment to their holdings.

Analyst Says Cardano Is Warming Up For Major Price Move

0

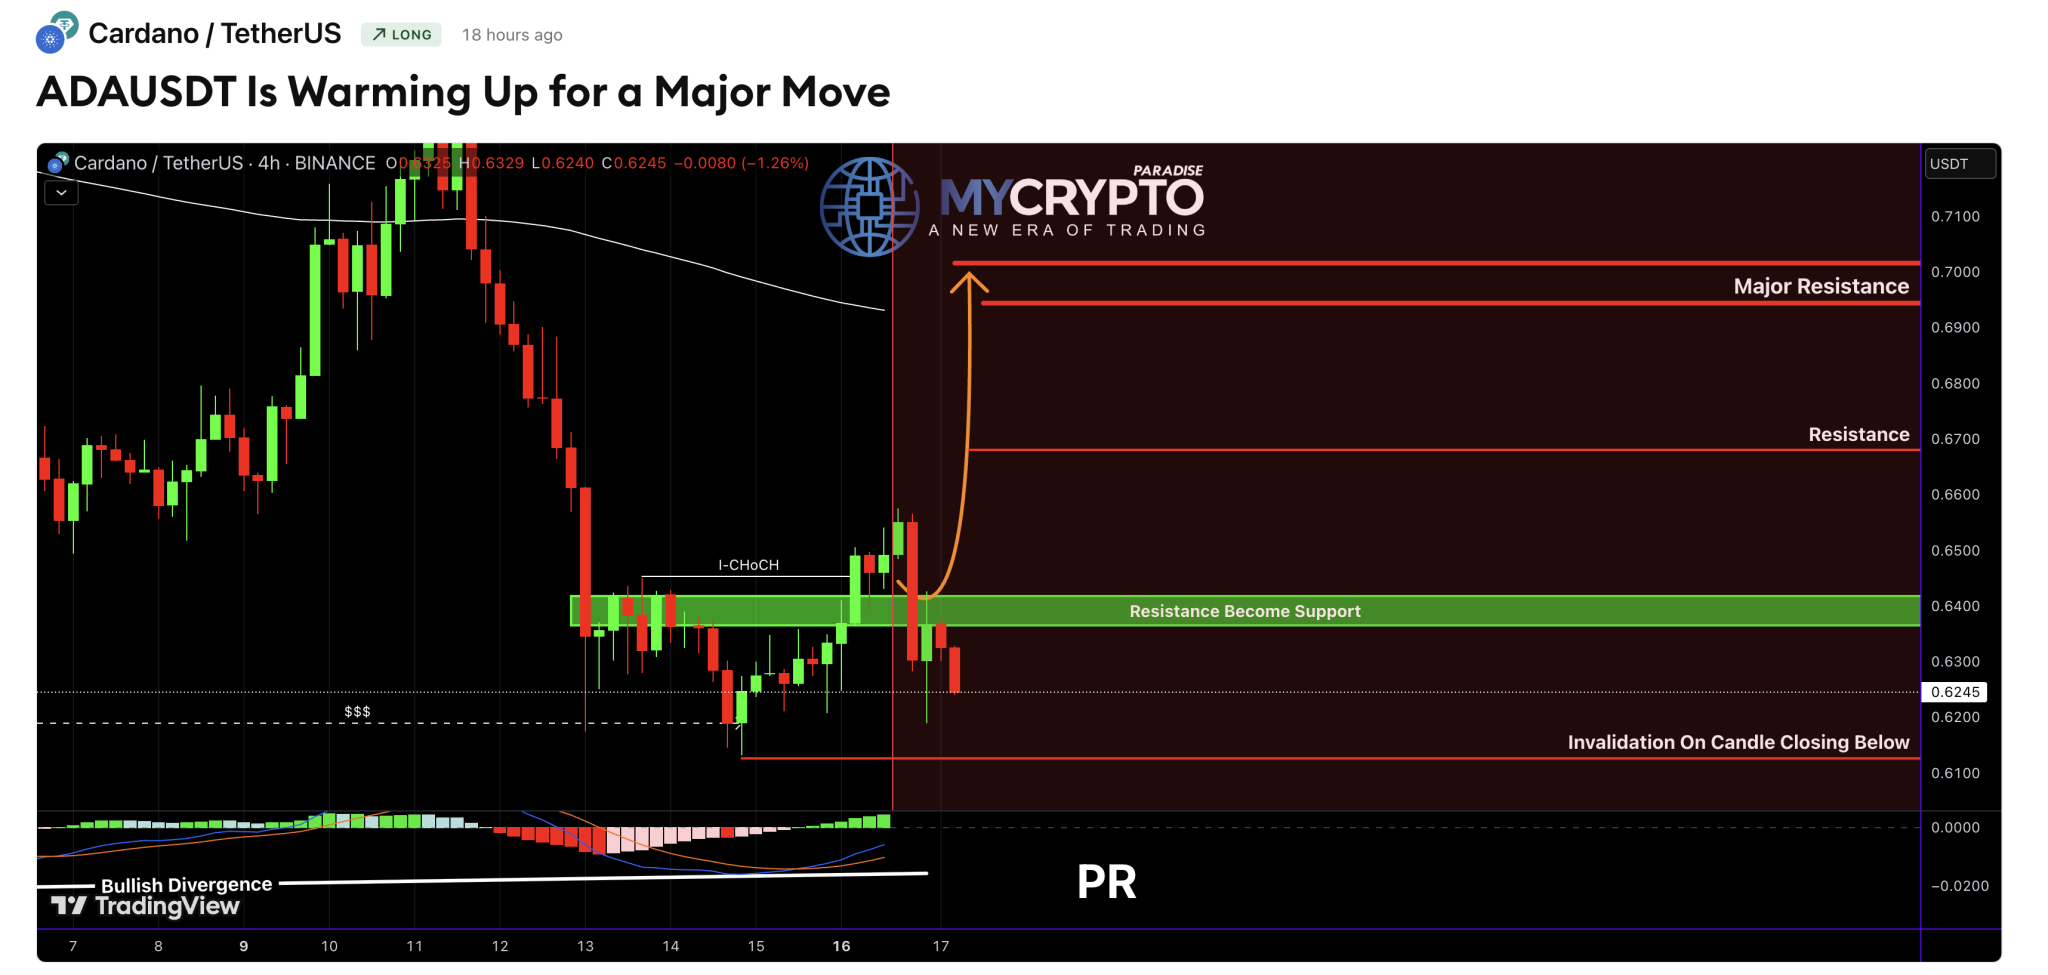
A TradingView analyst suggests that Cardano (ADA) is gearing up for a significant price move, supported by bullish technical indicators.

Over the past week, Cardano has undergone a notable correction, shedding approximately 9.6%. Between June 10 and June 17, ADA dropped from $0.73 to a weekly low near $0.60. As of the latest trading data, ADA is hovering around $0.6328.

Despite the broader market pullback, analyst MyCryptoParadise’s recent update on TradingView indicates that ADA may be forming a short-term bullish reversal.

Internal Shift and Key Technical Signals

A key technical development was observed on the ADA/USDT 4-hour chart: the appearance of an internal change of character (I-CHoCH). This structural shift signals a potential transition from bearish to bullish momentum. It followed a sell-side liquidity sweep (SSS) near the $0.6200 level, an event often preceding reversals as weaker positions are cleared from the market.

Further reinforcing the bullish case, the MACD indicator shows a bullish divergence. While ADA’s price formed a lower low, the MACD histogram and signal lines printed higher lows. This is a classic signal of weakening bearish pressure and a possible upside shift.

Additionally, a support zone has developed between $0.63 and $0.64. This level had previously acted as resistance, particularly at $0.6421 in mid-June.

Following a dip to $0.61 on June 14, ADA rebounded to $0.65, flipping that resistance into a potential support. According to the analysis, holding this zone is critical for any continued bullish momentum.

Cardano chart by MyCryptoParadise

ADA Entry Strategy and Upside Targets

The TradingView analyst recommends a cautious but strategic approach. Aggressive traders might consider entering around current price levels, though risk management is essential due to a limited risk-reward profile.

More conservative traders are advised to wait for a potential retracement into the $0.63–$0.64 support zone. A confirmed bounce from this region would provide a clearer entry with more favorable risk parameters.

On the upside, ADA faces initial resistance just below $0.67. A breakout from that level could pave the way for a move toward $0.70, representing a potential 10.62% increase from current prices.

However, the analyst cautions that a close below the $0.6200 invalidation level would negate the bullish setup. In that case, traders should wait for a new market structure before re-entering.

Cardano Derivatives Data Suggests Cautious Optimism

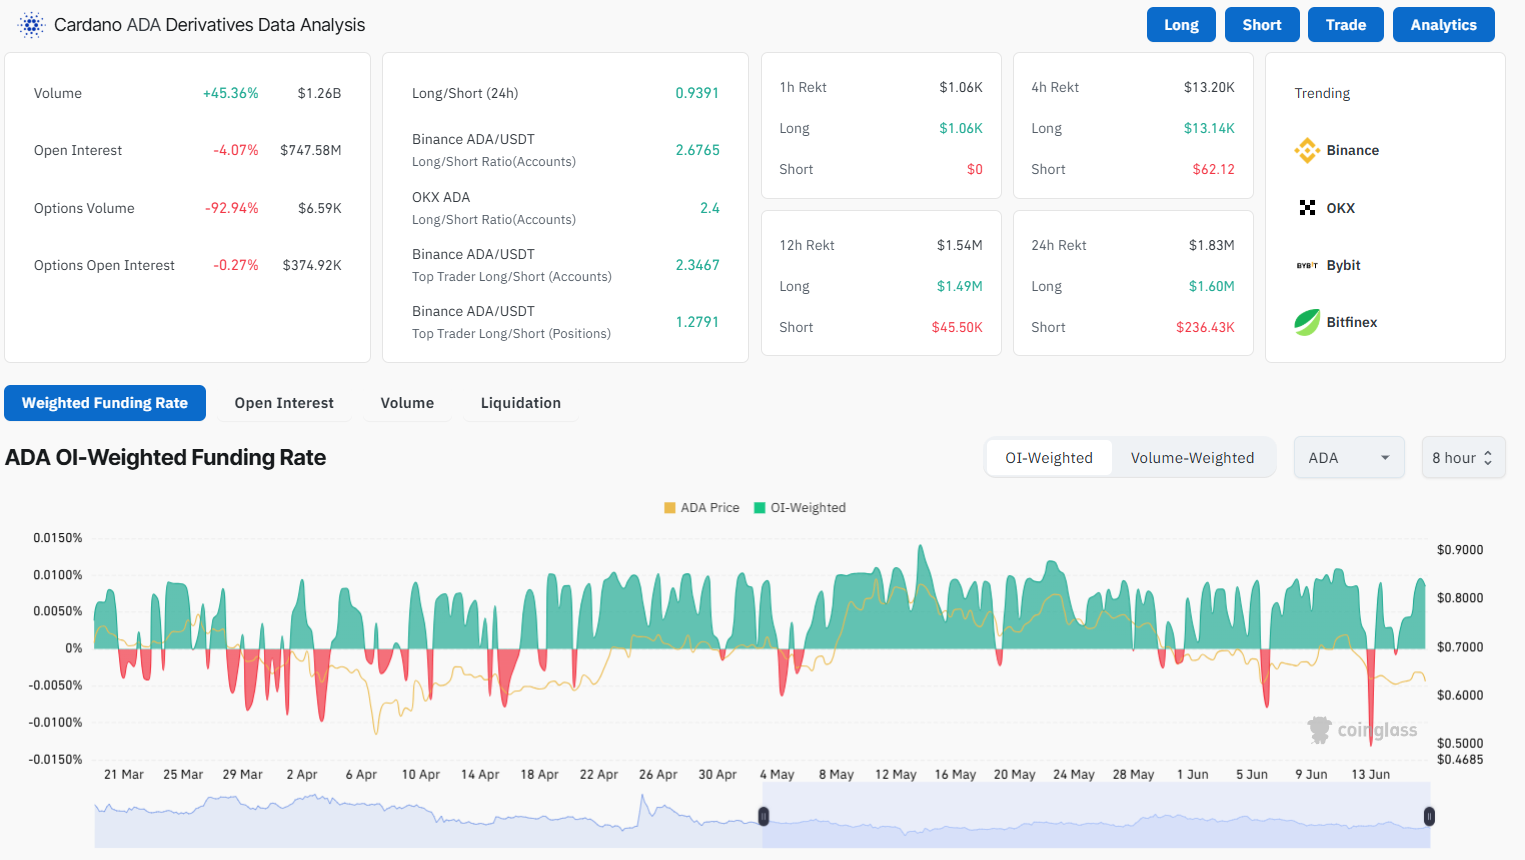
Derivatives and on-chain metrics show a cautiously bullish outlook for ADA. Trading volume surged 45.36% to $1.26 billion, typically a sign of increasing price action. While the overall long/short ratio stood at 0.9391, major platforms like Binance (2.6765) and OKX (2.4) showed a strong long bias.

Screenshot 2025 06 17T103911564
Cardano Derivatives Data | Coinglass

Funding rates remain positive, signaling confidence from leveraged long traders. Despite a 4.07% drop in open interest to $747.58 million, sentiment held steady. Long liquidations totaled $1.6 million compared to just $236,000 in shorts, highlighting ongoing bullish pressure.

However, options volume plunged 92.94%, suggesting reduced institutional activity and lower short-term volatility expectations. Still, with no major signs of bearish reversal, the broader setup favors a potential recovery.

Analyst Predicts How Much XRP Could Surge This Year

A widely followed market watcher known as “Crypto Beast” has shared his bullish outlook for various crypto assets, including XRP and Solana.

Bullish momentum is gradually building in the crypto market as Bitcoin continues to hold near the $110K level. The leading cryptocurrency is trading at $107K at press time, with a 0.25% gain over the past day, showing minimal volatility. This passive movement is gradually giving altcoins room to grow.

In a Monday tweet, Crypto Beast shared his perspective on how 14 altcoins could perform. His outlook suggests gains ranging from at least 100% to as high as 4,000% for these altcoins.

Ethereum Set for 2X Surge

Topping the list is Ethereum, which the prominent trader projects to surge by 200%. At press time, Ethereum is trading at $2,582, down 1% on the day. A 2x gain from the current price would place Ethereum at approximately $5,164.

This would mark a new all-time high for ETH, significantly surpassing its previous peak of $4,891 and rewarding long-term holders for their patience, as ETH has failed to retest the 2021 all-time high despite BTC continuously seeing new peaks.

How High Solana and XRP Could Go

As for Solana and XRP, Crypto Beast expects them to perform even better. He projected a 3X gain for Solana and a 4X upside for XRP. Notably, Solana is currently trading at $153, and a 3X increase from here would push the price to around $459.

Meanwhile, XRP changes hands for $2.23, up 2.4% today. A 4X surge from the current level would push XRP near the double-digit range, trading at around $9.

Notably, at that price, XRP’s market cap would rise to $525 billion, exceeding Ethereum’s current valuation of $311 billion. However, this valuation would be less than Ethereum’s market cap of $623 billion at the projected $5,164. Further, at the $9 price, XRP’s fully diluted valuation would close to the lofty $1 trillion mark.

Some market watchers believe that $9 is a conservative estimate for XRP this year, with hopes for even higher targets. For instance, prominent crypto bull Javon Marks maintains a price outlook of $100 and above for XRP this cycle. He bases his projections largely on XRP’s historical patterns, which he believes still havethe  potential to forecast future moves.

Meanwhile, according to Crypto Beast’s list, several other altcoins could outperform XRP, delivering gains beyond 4X.

Altcoins Projected to Gain 5X to 10X

In this category, the analyst highlighted Sui (SUI), a renowned layer-1 network rivaling Solana, as a strong candidate for a 5X surge. Trading at $3, SUI has already delivered a 224% gain. However, Crypto Beast believes it could rise further to as high as $15 this season.

The post also identified Ethena (ENA), Virtual, Near Protocol (NEAR), SPX6900 (SPX), and Kaspa (KAS) as potential candidates for 6X to 10X price surges.

12X to 40X Altcoins to Watch

In the high-performance category, Crypto Beast named just three altcoins: Aerodrome (AERO), Pudgy Penguins (PENGU), and Realio Network (RIO). Specifically, he suggested that AERO could do 12X, PENGU could achieve 17X, and RIO could reach an impressive 40X gain.

A major factor supporting this thesis is their relatively low market caps compared to billion-dollar projects like XRP or Ethereum, making them more responsive to market activity.

Other coins that also featured in the listing include HYPE, projected for a 3X gain, and ONDO, with a projected 4X surge.

Cardano Founder Comes Under Fire Over Plan to Swap ADA for Bitcoin

0

Cardano founder Charles Hoskinson has come under heavy criticism following his recent strategy of converting a portion of the ADA treasury into Bitcoin. 

Initially, Hoskinson proposed a strategy to convert $100 million worth of ADA in treasury into USDM stablecoin and Bitcoin. At the time, he suggested that the fund could generate an annual return of 5-10% and boost Cardano’s DeFi and stablecoin ecosystems.

According to Hoskinson, the annual yield could be used to repurchase ADA and replenish the treasury, which currently holds roughly 1.7 billion ADA.

He suggested that if the initiative proves successful, the ecosystem team could implement the strategy annually, potentially growing the Bitcoin and stablecoin treasuries to $1 billion each, augmenting Cardano’s financial reserves.

“This sets us up for great returns and a pretty stable floor for the ecosystem,” Hoskinson remarked in a viral video.

Crypto Stakeholders Criticize Him 

While several Cardano enthusiasts supported the proposal, others criticized Hoskinson for planning to convert ADA into Bitcoin. Popular crypto investor Anthony Pompliano was among the critics.

According to Pompliano, Hoskinson implicitly admitted that ADA cannot “hold water” or outperform Bitcoin over time. He also suggested that Hoskinson’s strategy implied that the only way to create long-term economic value was to sell ADA from the treasury and buy Bitcoin.

“This indicates that the altcoin founder understands that Bitcoin is never going away,” Pompliano remarked. 

He further emphasized that Hoskinson’s proposal mirrors the “speculative attack” concept popularized by Bitcoin entrepreneur Pierre Rochard in 2014. The concept involves companies selling their assets to acquire Bitcoin, thereby promoting its adoption.

In Hoskinson’s case, Pompliano noted that the Cardano founder intends to sell ADA from the treasury in exchange for Bitcoin. He also emphasized that the substantial gains recorded by Bitcoin-focused treasury companies, such as Metaplanet, have become too significant to ignore. 

Data from Metaplanet’s website shows that the price of the company’s stock has grown 9,610% since it first acquired Bitcoin in April 2024. The share price has spiked from ¥19 ($0.13) to ¥1,845 ($12.74) within this period. 

As a result, Pompliano suggested that Metaplanet’s remarkable growth may have motivated Hoskinson’s proposal to convert a portion of the ADA treasury to Bitcoin. 

Sunny Decree Trolls Hoskinson Over Ethereum and Cardano Ties

Bitcoin investor Sunny Decree also took a jab at Hoskinson. He sarcastically outlined a pattern he claims Hoskinson used to build wealth.

The alleged pattern involves premining Ethereum, pitching its real-world use cases to attract investors, selling the ETH holdings to buy Bitcoin, and then repeating the process with Cardano.

Hoskinson, one of Ethereum’s co-founders, left the project in 2014 and launched Cardano three years later. Following Hoskinson’s Bitcoin investment proposal, Sunny criticized investors still holding ADA, calling them “blind.” 

Crypto Author Criticizes Hoskinson 

Terence Michael, author of “Proof Of Money: The Big Idea Behind Bitcoin,” also slammed the Cardano founder for planning to sell ADA for BTC. 

Michael issued a wake-up call to investors, emphasizing that the primary goal of most crypto projects is to sell their tokens rather than position these assets as stores of value. 

He urged investors to imagine a scenario in which Bitcoin’s pseudonymous founder, Satoshi Nakamoto, sells BTC to buy ADA. The crypto author emphasized that Hoskinson does not just plan to swap ADA for BTC but aims to establish a Bitcoin treasury. 

However, Hoskinson has largely ignored these criticisms, as he remains focused on expanding Cardano’s DeFi and stablecoin ecosystem. Earlier, he dismissed concerns about the potential impact of the sale on ADA’s price. 

He suggested that the ADA sale would be handled through over-the-counter (OTC) and time-weighted average prices (TWAPs), which would shield the token from any potential price impact.

Ripple and SEC Ask Court to Freeze Appeal for Another 60 Days: Here’s Why

0

Following the expiration of the initial 60-day pause on the Ripple appeal, the SEC has requested that the Second Circuit extend the abeyance for an additional 60 days.

The SEC made the request in a status report filed with the U.S. Court of Appeals for the Second Circuit. According to the latest filing, the SEC requests that the court pause the appeals for an additional 60 days. In effect, the next status update is August 15, 2025. 

Recent Developments in SEC v. Ripple Appeal

In April, the SEC and Ripple jointly requested a 60-day pause of the appeal. At the time, they disclosed plans to obtain an indicative ruling from the District Court regarding their in-principle agreement. 

This agreement involves vacating the permanent injunction imposed on Ripple’s institutional sales and reducing the penalty to $50 million from the initial order of $125 million. The Second Circuit froze the parties’ appeals for 60 days and ordered the SEC to file a status report by June 16. 

Parties Refile Motion for Indicative Ruling

As a result, they jointly requested an indicative ruling on their settlement agreement, which was denied mid-last month. U.S. District Judge Analisa Torres emphasized that the motion had a procedural flaw. 

The judge noted that modifying her final judgment, as requested by the parties, is reserved for rare, exceptional circumstances. In parallel, she claimed the parties failed to meet the ‘exceptional circumstances’ criteria.  

Undeterred, the SEC and Ripple refiled their motion for an indicative ruling last week, highlighting exceptional circumstances that warrant modification of the final ruling. 

Current Status 

The motion is still pending in the district court, as Judge Torres has not yet issued a decision. As the parties await the district court’s decision, the SEC has filed a status report to update the Second Circuit on the case’s current status, requesting two months’ grace.

The next step in the Ripple lawsuit hinges on Judge Torres’ decision on the motion for an indicative ruling. If the district judge denies the motion, the parties may refile another request before the August 15 deadline. 

However, should the indicative ruling request be granted, the parties will jointly request a brief remand from the Second Circuit. This would result in the case being sent back to Judge Torres for her to modify the final judgment by vacating the permanent injunction and reducing the penalty fee to $50 million. 

Afterward, the SEC and Ripple will jointly request to withdraw their appeals, potentially bringing the case to a final resolution. However, the potential timeline for a final resolution remains uncertain as crypto enthusiasts, including the parties, await Judge Torres’ indicative ruling. 

Based on her initial decision, which took approximately seven days, it is expected that Judge Torres might issue the ruling later this week.