Home Blog Page 68

Retail Adoption Spikes as XRP Wallets Holding 1,000 to 100,000 Tokens Hit New ATH Above 1.12M

0

The number of XRP wallets with balances ranging from 1,000 to 100,000 tokens has hit a new all-time high above 1.2 million.

This uptick in wallet addresses, which confirms growing adoption, comes despite the ongoing market downtrend that has triggered massive losses for XRP. Specifically, XRP has collapsed nearly 40% this year to a low of $1.10, with a close to 70% decline from the peak of $3.66.

While prices have struggled, on-chain data indicates that the market continues to see an influx of users, as adoption grows. Notably, the number of XRP wallets holding 1,000 to 100,000 tokens has now grown to a new all-time high of exactly 1,120,198.

Retail XRP Wallets Growth

This is according to data sourced by Santiment, a market intelligence platform. Of the 1.12 million figure, wallets holding 1,000 to 10,000 XRP tokens account for the larger share, amounting to 819,690. Meanwhile, there are 305,080 addresses with 10,000 to 100,000 XRP.

Despite holding fewer tokens than whale wallets, these smaller addresses are a more accurate assessment of retail adoption. As a result, their steady increase since the start of the year indicates that the XRP ecosystem has continued to attract new users despite the current price struggles.

For context, after reaching a combined peak of 1,095,830 on Feb. 6, 2026, these XRP wallets saw a drastic decline in their number, reaching 1,088,450 by Feb. 10. This marked a loss of about 7,380 retail wallets within four days.

Retail XRP Wallets Growth
Retail XRP Wallets Growth | Santiment

Notably, the drop occurred on the back of the market-wide crash on Feb. 5, which resulted in a massive 19.7% intraday slump for XRP. The altcoin dropped further to a low of $1.11 the next day before staging an impressive comeback that saw it rise 21.07%. 

With this rebound, retail wallets resumed their growth path, but it took nearly two weeks to recover the lost figure. The growth has since remained consistent amid the prevalent price uncertainty, and the latest figure shows that XRP has added over 36,000 retail wallets since the Feb. 6 drop.

XRP Accumulation Trend

In addition, this cohort of retail XRP wallets has continued to accumulate more tokens, albeit at a slow pace, as the ongoing price downtrend provides an opportunity to procure more for less.

Notably, at the start of the year, wallets with 1,000 to 100,000 XRP held a cumulative balance of 10.48 billion tokens. Today, this figure has increased to 10.73 billion XRP, indicating that they have accumulated 250 million XRP year-to-date.

XRP Accumulation Trend Santiment
XRP Accumulation Trend | Santiment

However, this pales in comparison with the figures recorded by whale accounts. While fewer in number, wallets holding 1 million to 100 million XRP have added 1.38 billion tokens since the start of this year. This has contributed to the resilience displayed by XRP above the $1 price mark despite the persistent downturn.

Hoskinson Confirms Cardano Political Party Is Nearing Launch

0

Cardano founder Charles Hoskinson has confirmed that the ecosystem is close to launching a political party.

He made the announcement during his latest broadcast, where he also dismissed rumors that he plans to retire or leave the Cardano ecosystem. Reaffirming his long-term commitment to the network, Hoskinson revealed that preparations for the political party are already underway. He said the initiative is expected to launch soon, allowing ADA community members to participate.

“We are working on a political party, and we’ll imminently be launching that soon, and give people an opportunity to participate,” Hoskinson remarked.  

His commentary signals that the initiative has progressed from a proposal to an active project, although Hoskinson did not provide a specific launch date.

A New Governance Structure for Cardano

Hoskinson’s latest remarks build on his earlier proposal to establish a political party that would operate as a large, Delegate Representative (DRep) within Cardano’s on-chain governance system.

The idea emerged after months of governance disputes across the ecosystem. Several treasury proposals, including some associated with Hoskinson, failed to secure DRep approval. The resulting governance tensions eventually contributed to the cancellation of Cardano Summit 2026. In response, Hoskinson first suggested becoming a DRep before unveiling plans to create a political party.

In his view, the proposed organization would coordinate decision-making on ecosystem growth, treasury allocations, and long-term strategic priorities. The initiative would also give ADA holders and ecosystem participants a structured way to engage in governance by joining the organization and voting on key initiatives. 

Hoskinson Backs the Cardano PRIME Proposal

Meanwhile, Hoskinson has publicly endorsed the Cardano PRIME proposal. He expressed his support by replying “LFG” after AlphaGrowth announced that on-chain community voting for PRIME had officially begun.

PRIME is a 12-month initiative led by AlphaGrowth to accelerate Cardano’s decentralized finance (DeFi) ecosystem through protocol security audits, responsible liquidity incentive programs, and market expansion. The proposal seeks 120 million ADA in treasury funding, valued at approximately $19.2 million at an assumed ADA price of $0.16. If successful, the initiative aims to increase Cardano’s total value locked (TVL) by more than $200 million.

Such growth would represent a significant expansion from Cardano’s current TVL of roughly $73 million, with stablecoins currently accounting for most of the capital locked on the network.

Hoskinson has repeatedly emphasized that expanding Cardano’s DeFi ecosystem is one of the network’s highest priorities. He has previously described 2026 as a “do-or-die” year for Cardano’s DeFi ambitions, underscoring the need to attract more liquidity, users, and decentralized applications to the blockchain.

Solana Tokenized RWA Market Soars 4x, Hits Record $3.62B in H1 2026

The real-world asset (RWA) ecosystem of Solana has quadrupled in value during the first half of 2026. 

It grew from $873 million in January to a record $3.62 billion in July. The surge was driven by rapid growth in tokenized stocks, rising institutional adoption, and record trading activity.

According to the latest ecosystem data, Solana is now the third-largest blockchain for tokenized RWAs, with a 10.39% market share. The network hosts 2,119 tokenized assets across 295,853 holders. Its RWA ecosystem has also grown 20.91% over the past 30 days.

Meanwhile, Solana’s stablecoin supply has surpassed $16 billion, making it the second-largest among all blockchains. The large stablecoin base has provided deep dollar liquidity for tokenized asset trading.

Solana RWA Data
Solana RWA Data

Tokenized Asset Trading Reaches New Highs

Notably, Solana recorded its strongest quarter for tokenized assets in Q2 2026. Spot trading volume climbed to $5.77 billion, up 7.4 times from the $775 million recorded during the second half of 2025.

June alone generated more than $2 billion in tokenized asset trading. That marked the highest monthly volume ever recorded on any blockchain.

The network also led global tokenized equity trading during the week of June 15–21. It processed $1.298 billion of the $1.324 billion traded worldwide, accounting for roughly 97% of the market.

SpaceX Listing Boosts Tokenized Stock Activity

Solana’s tokenized stock ecosystem received a major boost after SpaceX’s June 12 Nasdaq listing. Tokenized SpaceX shares launched on the blockchain the same day.

SpaceX-related tokens generated $1.19 billion in June trading volume, accounting for 31% of the month’s total. Backpack Securities’ SPCX contributed $1.08 billion, while xStocks’ SPCXx added $852 million.

On June 24, Solana’s tokenized stock market reached a record $644 million in daily trading volume. The milestone highlights the network’s shift from a memecoin-focused blockchain toward a hub for tokenized financial assets.

Institutional Offerings Continue to Expand

The ecosystem has continued to attract institutional issuers and infrastructure providers.

Backed Finance’s xStocks platform now offers 134 tokenized stocks. It has surpassed $3 billion in cumulative on-chain trading volume and attracted more than 57,000 unique holders. 

Solflare, which reports 4 million monthly active users, has integrated all xStocks assets and added a Google Pay on-ramp.

Ondo Global Markets has also launched more than 200 tokenized U.S. stocks and ETFs. At launch, those assets represented roughly 65% of all Solana RWAs.

Meanwhile, Jupiter Lend has added tokenized SPYx, QQQx, NVDAx, and TSLAx as collateral. Users can now borrow against tokenized equities within DeFi.

Institutions Deepen Solana Adoption

Institutional participation has accelerated across the network. BlackRock’s BUIDL fund has deployed $615 million on-chain through Securitize. It is now the largest individual RWA position on Solana.

Citigroup completed a tokenized Bill of Exchange settlement pilot with PwC in February. Institutional market maker B2C2 has also chosen Solana as its primary stablecoin settlement network.

Financial firms, including SoFi and R3, have expanded their enterprise banking and tokenization initiatives on Solana. The moves reinforce the blockchain’s growing role in institutional-grade digital asset infrastructure.

XRP Faces Downward Risk as On-Chain and Technical Analysis Flashes Fresh Warnings

0

XRP is at risk of a downside move, as falling open interest and a possible bear flag pattern point to $1.04 as the next key support level.

XRP continues to show signs of weakening momentum, with both on-chain data and technical indicators pointing to intense selling pressure.

A CryptoQuant analysis reveals declining participation in the derivatives market. At the same time, chart analysis suggests a bearish continuation pattern could send the token toward lower support levels.

XRP Open Interest Drops Lower

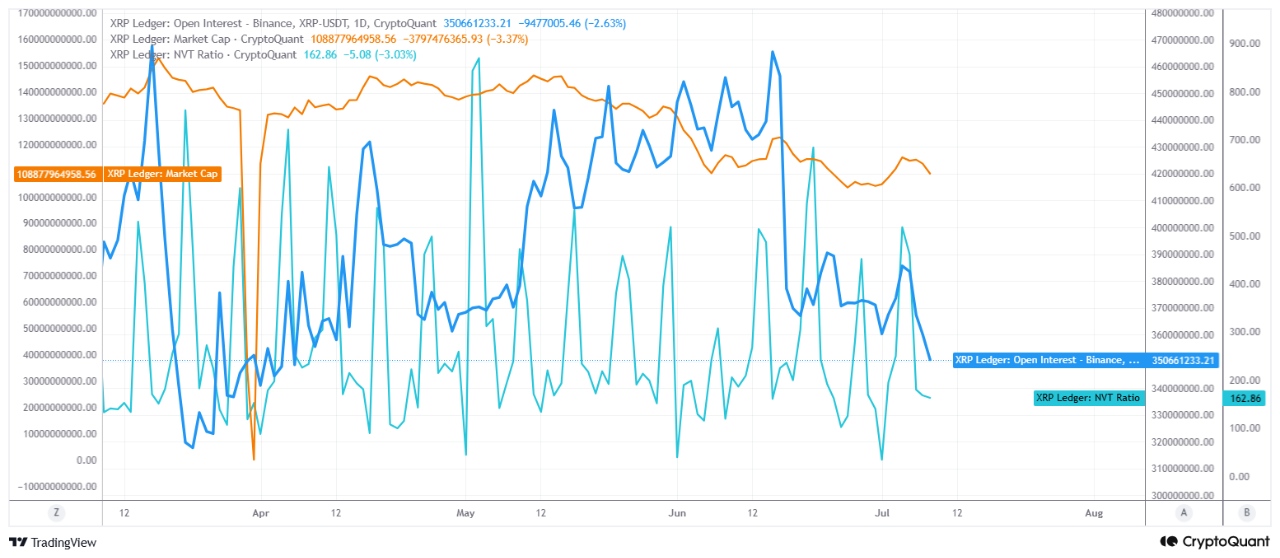
CryptoQuant verified author PelinayPA highlighted that XRP’s open interest on Binance has fallen to $350.6 million, one of its lowest readings in recent months. The decline suggests traders are increasingly closing leveraged positions and preferring to stay on the sidelines as interest in derivative exposure to the asset drops.

The open interest across all exchanges has also followed a similar trajectory. At the time of writing, the metric stood at $776 million, reaching lows last seen in February.

Meanwhile, the Network Value to Transactions (NVT) ratio remains elevated at 162.86. High NVT readings generally indicate that network activity has not recovered enough to impact XRP’s valuation. This suggests that activities on the XRP Ledger remain minimal and continue to affect the asset’s recovery negatively.

XRP OI and NVT/CryptoQuant

Taken together, the analyst noted that these indicators reflect a market where risk appetite has cooled considerably, leaving sellers with the upper hand. Unless the current condition changes, the XRP price remains vulnerable and could drop further.

Bear Flag Pattern Puts $1.04 in Focus

Meanwhile, a 1-hour chart analysis from Ali Martinez adds to the cautious outlook. In a parallel analysis, he identified a bearish formation that could potentially push XRP lower.

An accompanying chart shows that after a sharp decline, XRP has been consolidating inside what appears to be a bear flag. Its price is compressing between the structure’s upper resistance and the ascending support trendline below.

XRP Bear Flag/Ali Martinez

Notably, this type of pattern often represents a pause after an extended downtrend rather than the beginning of a sustained recovery. Prices make higher lows but are unable to break above a horizontal resistance level. Eventually, a breakdown occurs, starting the next leg down.

Martinez suggested that if this is a flag pattern, then XRP is at risk of further downsides. The flag breaking down could start a measured move toward $1.04, a 5% drop from the current market price of $1.10.

Is Bitcoin $57K the New $16K? Signs of Macro Bottom Are Emerging

Bitcoin may be entering the later stages of the ongoing bear market and forming a long-term market bottom.

Specifically, the recent drop to around $57,000 this month could become this cycle’s equivalent of the $16,000–$18,000 low seen in late 2022. While on-chain data suggests the bottoming process is progressing, key confirmation signals have yet to appear.

Why $58K Could Mark This Cycle’s Bottom

Market watcher Seth has said there are growing signs that Bitcoin’s high-timeframe (HTF) macro bottom is already in place. “There are signs that the HTF macro bottom is in. $58K is the new $18K,” he wrote on X.

Seth noted that he correctly identified Bitcoin’s $16,000 bottom during the 2022 bear market. He said he would not be surprised if Bitcoin had once again established its cycle low.

After bottoming in 2022, Bitcoin climbed steadily. It reached about $73,650 in March 2024 before rallying to an all-time high of $126,200 in October 2025.

Glassnode chart
Glassnode chart

Bitcoin Rebounds From July Low

Notably, Bitcoin fell to $57,747 on July 1, its lowest level yet in this cycle. It then rebounded to around $64,600 by July 5.

As of today, Bitcoin trades at $63,872, up about 4% over the past week. However, it remains down 27% year-to-date and is still about 49.4% below its October 2025 record high. That suggests the recovery is still incomplete.

Glassnode: Bottom Is Forming, but Confirmation Is Still Lacking

In a recent study, Glassnode said Bitcoin is still in “deep value” territory after trading below both the True Market Mean and the Short-Term Holder Cost Basis for nearly five months.

The analytics firm said long-term holder (LTH) selling has intensified. Losses now account for 43% of total realized value, with realized losses reaching about $280 million per day, the highest level since December 2022.

Glassnode’s chart also shows that more than 5.5 million BTC held by long-term investors is currently at a loss. Similar levels were seen near major market bottoms in previous bear markets, before Bitcoin started recovering.

However, demand remains weak. Spot Bitcoin ETFs are still seeing net outflows, while daily trading volume of $650 million to $950 million is about 80% below the October 2025 peak.

At the same time, derivatives markets have become slightly more optimistic. The put/call ratio has fallen to its lowest level of 2026, although options traders are still pricing in downside risk.

In sum, Glassnode said Bitcoin may be in the final stages of forming a market bottom. However, it added that long-term holder selling needs to ease before a lasting recovery can be confirmed.

XRP Now at A Decisive Inflection Point: Will Prices Moon or Drop to $0.7?

0

XRP has entered one of the most important stages on its weekly chart, placing it at an inflection point that could determine its next major move. 

XRP is currently trading at around $1.1063 after reaching a weekly high of $1.1638 before pulling back. Currently, the crypto asset is down 4.32% in the week, on track to end the session in negative territory.

Amid the downward price action, several indicators have converged to create a setup that could lead to a major move. As a result, the question is no longer whether XRP will make a major move from here, but whether it will rally higher or fall toward the $0.70 area.

Fibonacci Levels Show Where XRP Could Move Next

Notably, a Fibonacci retracement grid drawn from XRP’s cycle low of $0.3814 to its cycle high of $3.6662 covers the entire rally that took place between late 2024 and early 2025. Since reaching the peak, XRP has moved lower, passing through several key Fibonacci levels.

At the current price of $1.1063, XRP trades just above the 18.75% Fibonacci retracement level at $0.9980. The next major support lies at the 12.50% retracement level of $0.7925, which stands as the final important support before the price could return to the base of the previous bull run.

Several resistance levels also contributed to this decline. Specifically, the 33% Fibonacci level at $1.4626 acted as an important support before XRP lost it. Once the price fell below that level, it never regained it. 

XRP 1W Chart
XRP 1W Chart

Higher up, the 50% retracement level at $2.0256 stopped the recovery attempt in January 2026. The 61.80% golden pocket at $2.4136 and the 66% retracement level at $2.5437 also rejected price during the extended topping phase near the July 2025 highs. 

Symmetrical Triangle Puts XRP at a Decision Point

Meanwhile, data from the weekly chart shows a symmetrical triangle that now defines XRP’s overall structure. 

Notably, XRP currently witnesses a downward-sloping trendline that starts from the $3.6662 peak and connects several lower highs. At the same time, the chart features an upward-sloping trendline that has acted as support. While the upper trendline formed in July 2025, the lower line started forming in 2024.

These two trendlines have squeezed XRP into the triangle’s apex, where price now sits. Since symmetrical triangles do not favor either buyers or sellers, the market now waits for the next breakout to reveal the direction.

A breakout above the upper trendline could push XRP toward $1.4626, followed by $2.0256, and later the $2.40 to $3.00 range. 

However, if the price breaks below the lower trendline, XRP would lose its nearby technical support and could fall toward the $0.7925 Fibonacci level, which aligns with a possible move to around $0.70.

Volume Suggests Selling Pressure Is Fading

Importantly, XRP’s trading volume reveals how market sentiment has changed amid the ongoing price action. When XRP recovered from its early 2025 low, strong buying activity drove a sharp V-shaped rebound, showing that buyers had returned with confidence.

However, after the July 2025 peak, the market moved lower on heavy selling volume. This confirmed that sellers remained firmly in control instead of allowing prices to drift lower on weak trading activity.

As the downtrend continued, trading volume gradually became lighter even though XRP kept falling. This pattern suggests that selling pressure has started to weaken. 

However, weaker selling alone does not confirm a reversal. Buyers still need to return with enough strength to establish a lasting recovery. Current weekly volume now resembles the quiet trading conditions seen in June 2025, a period that came just before a major price move.

Hoskinson Says “I’m Not Leaving Cardano,” Dismisses New Exit Rumors

0

Cardano founder Charles Hoskinson has rejected recent rumors claiming he is stepping away from the Cardano ecosystem.

In a recent video update, Hoskinson revealed that he became aware of how widely false claims about his departure from the Cardano ecosystem had spread. According to him, even industry contacts and members of the public believed he was preparing to leave Cardano.

He explained that the speculation stemmed from out-of-context video clips and reaction content that misrepresented his previous remarks. Hoskinson stressed that he has never said Cardano was failing or that he intended to leave the ecosystem. Instead, he described the claims as fabrications designed to mislead the community. 

“I’m Not Leaving Cardano Ecosystem”: Hoskinson

Furthermore, Hoskinson argued that the rumors form part of a broader campaign to spread fear, uncertainty, and doubt (FUD) about Cardano. He maintained that the ecosystem continues to make steady progress, with additional hard forks, roadmap milestones, and new initiatives still under development.

“I’m not leaving. I am not going anywhere. I’m not retiring,” Hoskinson said, reaffirming his dedication to Cardano’s long-term vision. 

Hoskinson Reaffirms Commitment to Cardano

Hoskinson emphasized that both he and his company, Input Output Global (IOG), remain fully committed to Cardano’s long-term growth and development. 

To support his point, he highlighted several major initiatives currently advancing across the ecosystem. These include the Leios scaling upgrade, the partner chains strategy, as highlighted by Midnight’s progress, and the recently launched RealFi testnet, which is expected to transition to mainnet soon. 

In addition, he pointed to Pogun’s efforts to introduce Bitcoin decentralized finance (DeFi) capabilities to Cardano. According to him, these parallel initiatives demonstrate that Cardano is expanding rather than slowing down.

How the Exit Rumors Started

Speculation about Hoskinson’s potential exit from Cardano gained momentum after analytics platform TapTools announced its shutdown amid escalating governance disputes within the Cardano ecosystem. Around the same time, Hoskinson announced he was taking a break from X, prompting several media outlets and community members to speculate that he was preparing to leave Cardano.

However, Hoskinson has since returned to social media and resumed his regular broadcasts, repeatedly assuring the community that he remains fully committed to the ecosystem.

Since his return, Cardano has continued to advance its roadmap by launching the Leios testnet and introducing the RealFi testnet, an initiative aimed at expanding financial services for underserved populations. Throughout this period, Hoskinson has consistently reiterated his ambition to help position Cardano as the top-ranked cryptocurrency on CoinMarketCap.

However, the token has remained under bearish pressure. Currently ranked as the 14th biggest crypto on CoinMarketCap, Cardano is trading at $0.1662, with a valuation of $6.06 billion. 

Two Early Signs Shiba Inu Could Enter a Bullish Phase

0

Shiba Inu is showing early bullish divergence signals as its price challenges a descending trendline, sparking optimism over a rebound.

Shiba Inu (SHIB) is beginning to attract attention as two early signs show a bullish development could be on the horizon. Chart data shows a bullish divergence on multiple momentum indicators, as SHIB is attempting to break above a descending trendline on the daily timeframe.

SHIB Momentum Indicators Show Improving Strength

Both the Relative Strength Index (RSI) and the Moving Average Convergence Divergence (MACD) are displaying bullish divergence, indicating momentum has improved. Shiba Inu continues to make lower lows, yet these indicators are making higher lows, a conflicting trend that suggests underlying strength.

This divergence became very noticeable last month. After an early dip to $0.00000430 on June 6, the RSI also dropped to 20. After a brief recovery, SHIB formed a low, dropping to $0.00000405 on June 26. However, the RSI didn’t make a new low but hit a higher low of 21.44.

At the same time, the MACD line trended upwards in a higher low pattern, aligning with the RSI. Its trend histogram also moved from red bars to green bars, printing longer bars last seen in March.

Shiba Inu RSI and MACD Bullish Divergence

Notably, analysts often view this divergence as an early sign that selling pressure is fading. It usually precedes a strong market reversal to higher prices.

Shiba Inu Nears Descending Trendline Breakout

Meanwhile, SHIB is also pressing against a descending resistance line, making this a critical area to watch. The token has remained below this trendline since its high of $0.00000670 in May, with subsequent upside attempts capped near the line.

Today’s nearly 2% rise to $0.00000437 places SHIB on the cusp of a breakout. Should the current momentum persist, Shiba Inu could finally break above this multi-month resistance.

Interestingly, a successful breakout, followed by a close above the trendline, would strengthen the bullish case and confirm that buyers are beginning to regain control.

The target for this breakout is a potential 28% rally to the June high of $0.00000558. Further upside could take SHIB to the May high of $0.00000670, a 53% increase from the current market price.

Shiba Inu Accumulation Adds Momentum

Further bolstering the breakout optimism is the ongoing Shiba Inu accumulation trend. The CryptoQuant exchange netflow shows a negative figure of 131.88 billion SHIB in the past 24 hours, suggesting strong buying activity.

Shiba Inu Trending Metrics/CryptoQuant

The total exchange netflows calculate the difference between inflows into and outflows out of exchanges. A negative figure shows more withdrawals than deposits. This means that users shifted Shiba Inu massively out of trading platforms into self-custody wallets, highlighting accumulation.

Midnight Foundation Reopens Glacier Drop Redemption Portal for Cardano Users

0

The Midnight Foundation has reopened the Glacier Drop redemption portal after completing a security review caused by an incident involving a subset of Cardano wallets connected to SecondFi.

In a recent update, the Foundation confirmed that Glacier Drop redemptions resumed on June 9 at 17:00 UTC. This ended a temporary suspension introduced as a precautionary measure last month.

Security Review Confirms Glacier Drop Platform Remains Safe

The Foundation paused NIGHT token redemptions last month after reports emerged that EMURGO’s SecondFi platform had suffered a security breach. During the attack, hackers stole 16 million ADA from 374 wallets, prompting the Foundation to temporarily close the Glacier Drop redemption portal while it investigated whether the incident posed any risk to Glacier Drop participants.

Following its assessment, the Foundation confirmed that the Glacier Drop redemption infrastructure remains secure and unaffected by the SecondFi exploit.

As a result, all NIGHT tokens that completed their thawing process during the suspension are now immediately available for eligible users to redeem. The Foundation also stressed that the precautionary pause did not alter the Glacier Drop distribution schedule. This ensures participants remain on the original redemption timeline.

Glacier Drop Redemption Schedule Remains Unchanged

For context, the Foundation launched the Glacier Drop portal in August 2025 to distribute NIGHT tokens through a phased redemption model. Under this mechanism, allocated NIGHT tokens gradually thaw and become redeemable in four equal quarterly installments, with 25% unlocking during each phase.

The first redemption window ran from December 10, 2025, to March 9, 2026, followed by the second phase between March 10 and June 7, 2026.

The program has now entered its third thaw period, which began on June 8, 2026, and will continue until September 5, 2026. Meanwhile, the fourth and final redemption phase is scheduled to run from September 6 through December 4, 2026.

With the portal back online, eligible participants can once again redeem any NIGHT tokens that have thawed according to the established Glacier Drop schedule.

Midnight Advises SecondFi Users to Follow Recovery Guidance

Although the Midnight Foundation has confirmed that its redemption infrastructure is secure, it advises users who have used a SecondFi wallet to follow the official guidance issued by the SecondFi team.

Meanwhile, SecondFi has unveiled a phased response plan designed to help affected users secure their assets and prepare for potential recovery. The strategy begins with Quarantine Mode, followed by a secure wallet export scheduled for next week. The final stage may include an asset recovery process, depending on the outcome of the ongoing investigation and recovery efforts.

Chainlink Eyes Rebound at This Support Amid Broader Price Weakness

0

As price weakness persists, Chainlink could retest a key support zone that has repeatedly attracted buying pressure in the past.

Chainlink (LINK) is down 4% this week, continuing to mirror the weakness dominant in the broader cryptocurrency market. Meanwhile, its price is approaching a major support zone on the daily chart.

Notably, this support around the $7.05 level is crucial as it has repeatedly cushioned weak price actions. How LINK reacts could prove decisive, as analysts watch whether the area can once again halt the broader downtrend.

Chainlink Targets the $7.05 Support 

The daily chart shows LINK retreating steadily after failing to hold higher price levels. Chainlink rebounded above $8 earlier in the week, reaching an intra-week high of $8.17 on Monday.

Notably, the level aligned closely with the 50-day simple moving average, an indicator that has repeatedly provided resistance in recent weeks. Again, the opposition at the level proved too strong for the upward momentum, with LINK eventually pulling back.

Over the past three days, the asset has dropped nearly 4% before the slight recovery today. Analysts expect deeper corrections, potentially targeting a 9% drop from here to the demand zone around $7.05.

Interestingly, this support has repeatedly acted as a point where previous rebounds start, making it one of the most important technical levels to watch. It was around this area that Chainlink rebounded during the February 6 market crash. The coin also recovered on June 6 and 25 from the same support.

Chainlink Price Analysis

LINK Could Rebound to Nearby Resistance

As such, a successful defense of the $7.05 support could allow buyers to regain control and push LINK higher. This could take the coin toward the nearby resistance at $9.47, a 22% rise from the current price of $7.73 and a 33% increase from the support.

Meanwhile, sustained bullish momentum and an improving broader market condition could push LINK to $10.80, highs last seen in May. This would represent a 53% increase from the support level and a 39% rise from the current price.

However, all these levels depend on Chainlink holding the $7.05 support. Breaking below could see the coin retest the next demand zone below at $6.60.

In the meantime, LINK appears to be rebounding today without a corresponding market participation, which is a concerning trend.

Chainlink Spot and Futures Volume/Coinglass
Chainlink Spot and Futures Volumes/Coinglass

Spot volume has dropped 5% to $5.11 million in the past 4 hours. Futures volume has also declined 14% to $39.35 million in the same timeframe as derivative momentum weakens. A price rise without increased market activity typically ends up being a relief rally before the next leg down.