Home Blog Page 69

Cardano Founding Entity EMURGO Leaves Pentad to Lead SecondFi Recovery Process

0

Cardano’s founding entity and commercial arm, EMURGO, has announced that it is stepping down from its role in the Pentad.

In a statement, EMURGO confirmed that it had formally notified the other Pentad members of its decision. The company also thanked its fellow members for their collaboration and shared commitment to advancing the Cardano ecosystem.

For context, the Cardano Pentad comprises the Input Output Global (IOG), the Cardano Foundation, the Midnight Foundation, Intersect, and EMURGO. These organizations coordinate ecosystem growth, governance initiatives, strategic partnerships, and new integrations.

EMURGO Shifts Focus to SecondFi Recovery

EMURGO explained that it is stepping away from the Pentad to concentrate fully on the recovery effort following the SecondFi security incident, which affected hundreds of Cardano users.

According to the company, dedicating its resources to the recovery process is the most appropriate course of action for both impacted users and the broader Cardano ecosystem.

Furthermore, EMURGO said the decision reflects the level of accountability it expects from itself as one of Cardano’s founding entities. Rather than continuing its leadership responsibilities within the Pentad, the company believes it can better serve the ecosystem by resolving the aftermath of the SecondFi exploit and supporting affected users.

EMURGO’s announcement comes only weeks after the SecondFi application suffered a major security breach. The attack compromised 374 wallets across three separate incidents, resulting in the loss of approximately 16 million ADA. 

Since then, the SecondFi team has focused on developing tools to help users determine whether they were affected, securely migrate their assets, and potentially recover eligible funds.

SecondFi Rolls Out Recovery in Phases

In its latest update, SecondFi confirmed that it will implement its recovery process in multiple stages.

The first phase introduces quarantine mode, allowing users to check whether their wallet addresses appear in the preliminary incident data. Affected users can also submit support tickets to begin the verification process.

Meanwhile, the second phase, expected to launch next week, will introduce a secure wallet export feature. The tool aims to provide a safer and more user-friendly method for transferring assets to newly created wallets, particularly for users with limited technical experience.

Community Awaits Official Response

So far, the remaining Pentad members has not publicly commented on EMURGO’s departure from the leadership group.

However, the announcement has sparked debate within the Cardano community. Some community members have called on EMURGO to relinquish its significant governance voting power and return its genesis ADA allocation.

Critics argue that EMURGO has gained disproportionate influence over Cardano’s governance and ecosystem resources. Popular DRep Chris O has also hinted at potential legal action against EMURGO if the organization refuses to return its genesis ADA holdings. 

Shiba Inu Veteran Warns Community After SHIB: The Metaverse Domain Expires

0

A prominent Shiba Inu community figure has issued an important security warning to SHIB supporters, especially proponents of the ecosystem’s metaverse project.

In a recent update, community veteran Mazrael revealed that the domain previously associated with Shib: The Metaverse (ShibTheMetaverse.io) has expired and is no longer owned or managed by the Shib wizards. 

Since expired domains can be purchased by anyone, Mazrael cautioned that any future website operating under that address should not be regarded as an official Shiba Inu platform. Consequently, he urged community members to remain vigilant and avoid assuming that any content published on the former domain is affiliated with the SHIB ecosystem or its developers. 

Shib.io Remains the Ecosystem’s Central Hub

Meanwhile, Mazrael explained that the Shiba Inu ecosystem is transitioning away from maintaining separate websites for individual projects. Instead, Shib.io will remain the unified gateway for all ecosystem products, including the eventual return of Shib: The Metaverse.

According to him, this consolidation will simplify the user experience by bringing ecosystem services under a single official domain instead of distributing them across multiple websites.

Although the public restructuring is still underway, Mazrael emphasized that the development of the metaverse has not stopped. Mazrael noted that the team is making progress behind the scenes despite the limited number of public announcements. 

As evidence, he highlighted updates made to the project’s Git repository a week ago, suggesting that active development remains ongoing.

Furthermore, Mazrael said Shib.io will receive user interface improvements as the restructuring advances. Once the migration is complete, the website is expected to serve as the primary destination for accessing Shiba Inu ecosystem products, including Shib: The Metaverse.

Community Urged to Stay Alert for Potential Scams

Mazrael’s warning serves as a timely reminder for the Shiba Inu community to avoid interacting with the former metaverse domain, as it could be acquired by a third party and falsely presented as an official SHIB website.

The caution is particularly significant because Shiba Inu community members have frequently been targeted by scammers using a variety of tactics, including impersonating the official development team, launching fake airdrops, and promoting fraudulent websites.

Given that the former metaverse domain is no longer under the team’s control, bad actors could view it as an opportunity to deceive unsuspecting users. 

Solana FUD Hits Highest Level of 2026 as Trading Volume Falls to Yearly Low: Will SOL Hit $100 Soon?

Solana market sentiment has turned sharply bearish amid its ongoing price decline, a new study from on-chain analytics platform Santiment confirms.

In particular, social media negativity has reached its highest level of 2026. Meanwhile, trading volume has fallen to its lowest point of the year.

Despite growing narratives around tokenized stocks and real-world asset (RWA) adoption on Solana, SOL has yet to post meaningful price gains. Santiment said the lack of price momentum has left many traders frustrated.

Meanwhile, the firm also noted that periods of extreme pessimism and weak trading activity have historically preceded unexpected price rebounds.

Solana Volume Slumps, Negative Sentiment Surges

According to Santiment, Solana is seeing a rare combination of falling market participation and rising bearish sentiment. The platform said social media discussions about SOL recorded their most negative day of 2026, while trading volume dropped to its lowest level of the year.

The accompanying chart shows SOL trading around $77.80, with seven-day trading volume at roughly $2.27 billion. Trading volume has been declining since late January. Meanwhile, negative sentiment climbed to its highest level since November 2025, reaching a reading of 14.05.

Santiment said much of the pessimism stems from disappointment that bullish narratives around tokenized equities and RWA adoption have not translated into stronger price performance.

Image

Solan Price

At press time, Solana is trading at $78.18, up a modest 0.72% over the past week and 16% over the past month. However, SOL remains down 37% since the start of the year and 49% over the past 12 months.

As a result, many long-term holders are still sitting on significant losses, further reflected in the extremely bearish market sentiment.

Solana Chart by TheCryptoBasic

Santiment Sees Potential Contrarian Setup

Despite the weak sentiment, Santiment said the current setup could favor a potential recovery. The analytics firm noted that periods of extreme fear and thin trading activity often drive retail investors to the sidelines.

However, if buying pressure returns, larger market participants can move prices more easily under such conditions.

Santiment added that rebounds often occur when traders least expect them. It said Solana may be entering a “low-attention, high-FUD” environment, where prices could rise if sentiment improves.

However, the firm did not predict an imminent rally. Instead, it said the current conditions are historically worth watching for contrarian investors tracking shifts in market psychology.

Can SOL Hit $100 Soon?

In a recent commentary, market watcher Michaël van de Poppe argued that conditions are starting to become interesting for Solana at current price levels.

In his view, holding the $73-$76 price range and moving higher would provide a strong signal that the market is ready for a run toward the psychologically important $100 level.

Chart Data Identifies the Most Reasonable Zone for XRP to Bottom This Cycle

Chart data identifies an area that may represent the most reasonable zone for XRP to find its bottom in the ongoing bear market cycle.

The current downtrend has continued to weaken investor sentiment, as XRP records some of its biggest losses in recent times. Specifically, XRP has fallen more than 70% from its July 2025 all-time high of $3.66, currently changing hands for $1.09.

Last month, XRP crashed to a new yearly low of $1.008 but has since recovered from this floor, with market participants questioning if this marked the downtrend’s lowest price. Amid the uncertainty, the daily chart has now identified where XRP could actually find a reliable bottom.

XRP’s Ascending Support Trendline

Notably, XRP’s daily chart features a persistent ascending support trendline that started forming in early 2020. For context, since the COVID crash in which XRP’s price collapsed to a floor of $0.11 in March 2020, XRP has continued to see higher lows.

This pattern of higher lows played out amid bull market corrections and bear market declines, and led to the formation of an ascending trendline at the lower end, as XRP continued to find support at lows higher than previous ones. 

For instance, after recovering from $0.11 in March 2020 to a high of $0.79 by November 2020, XRP collapsed on the back of the SEC lawsuit against Ripple, which the agency filed in December 2020. 

However, the downturn that ensued found strong support at the ascending trendline around $0.1713 in late December 2020. Following this floor, XRP staged a rebound campaign that eventually culminated in the $1.96 peak by April 2021.

XRP Ascending Support Trendline

XRP Finds Consistent Support at the Ascending Trendline

Despite pulling back from this $1.96 peak, XRP traded well above the ascending trendline for over a year until the 2022 bear market triggered a crash back toward the support area. 

Specifically, after the Terra ecosystem collapse in May 2022, XRP and the rest of the crypto market witnessed steep declines, with XRP’s price crashing to $0.29 in June 2022. However, this low aligned with the support around the ascending trendline, and bulls defended this area.

Importantly, the price failed to drop lower than the $0.29 floor from June 2022. Moreover, during the market uncertainty in 2024, XRP again retested the trendline at a low of $0.3834 in July and found support in this area.

Essentially, the ascending trendline has marked XRP’s bottom over the past six years, at the March 2020 low of $0.11, the December 2020 low at $0.1713, the June 2022 low at $0.29, and the July 2024 low at $0.3834.

Possible Next Bottom for XRP

XRP continued flirting with the ascending trendline throughout 2024 until the November rally on the back of President Donald Trump’s election victory. Despite facing occasional turbulence in 2025, XRP remained well above the trendline.

However, the ongoing downtrend that began in Q4 2025 seems to be dragging the prices back toward this area. Currently, the ascending trendline aligns with the $0.63 to $0.70 price region. As a result, XRP could bottom out around the $0.6 to $0.8 price zone if it loses the $1 support. 

Interestingly, a previous report from The Crypto Basic revealed that this $0.6 to $0.8 area features massive volume support, per the URPD. Specifically, wallets transacted 923 million XRP at $0.80 and 1.16 billion XRP at $0.62, confirming that this remains the most reasonable area for XRP to find its bottom.

Shiba Inu Transaction Activity Plunges 95% After Record Daily Surge

0

Shiba Inu has recorded an unusual on-chain anomaly after its daily transaction count plunged by 95% within 24 hours.

According to data from CryptoQuant, Shiba Inu’s daily transaction count soared to 78,558 on July 6—its highest level since October—before tumbling to 3,922 the following day. At press time, the metric had recovered slightly to 4,184 transactions. Even so, it remains 94.67% below the July 6 peak.

Despite the sharp fluctuation in network activity, SHIB’s price remained relatively stable throughout the period, indicating that the surge had little or no direct impact on the broader market. 

Shiba Inu Transaction Count

Potential Reason Behind Sudden Surge 

Initially, the spike resembled the type of large-scale wallet reorganization that cryptocurrency exchanges occasionally perform when transferring funds to cold storage.

However, data from the blockchain analytics platform Arkham showed no notable exchange inflows or outflows during the period. This effectively ruled out exchange wallet management as the source of the unusual activity.

Since Arkham tracks total transfer volumes, any major exchange movements would have appeared on its liquidity charts. Instead, exchange-related activity remained largely unchanged.

The lack of price volatility, coupled with the abrupt 95% drop in transactions, suggests the spike resulted from automated, non-market activity rather than retail trading.

As a result, analysts believe the anomaly was likely caused by either a large SHIB holder redistributing tokens across private wallets or developers conducting automated tests involving smart contracts or blockchain infrastructure. 

A Similar Trend? 

The unusual transaction activity comes as Shiba Inu’s on-chain address count continues to expand.

Notably, Shiba Inu has added more than 1,700 addresses since the beginning of July, pushing the total above 1.6 million. At press time, SHIB’s address count stood at 1,675,798 (1.67 million).

Recently, WoofSwap, a Shibarium-based decentralized exchange (DEX), disclosed that it was responsible for much of the recent address growth. The DEX used a smart contract to generate multiple wallet addresses and transferred 1 SHIB to each in an effort to increase the number of on-chain holders.

The disclosure quickly sparked controversy within the Shiba Inu community, with some supporters accusing WoofSwap of artificially inflating holder statistics as a marketing strategy for its token.

In response to the criticism, WoofSwap said it would discontinue the practice and explore alternative marketing initiatives that provide greater value to the SHIB ecosystem.

At press time, Shiba Inu traded at $0.00000429, up 1.54% over the past 24 hours. Meanwhile, its daily trading volume declined 8.46% to $67.61 million, reflecting relatively muted trading activity despite the recent on-chain anomaly. 

Bitcoin Demand Rebounds 425,000 BTC in One Week as Futures Turn Positive

Bitcoin demand has staged one of its strongest recoveries of 2026 amid fresh activity in the futures market, according to CryptoQuant author IT Tech.

However, spot demand remains weak, suggesting long-term investors are still cautious despite Bitcoin’s recent rebound.

The recovery comes as Bitcoin climbs from last week’s bear-market low of $57,700 to around $64,000. Historical July seasonality also points to the potential for further gains.

Futures Lead the Recovery

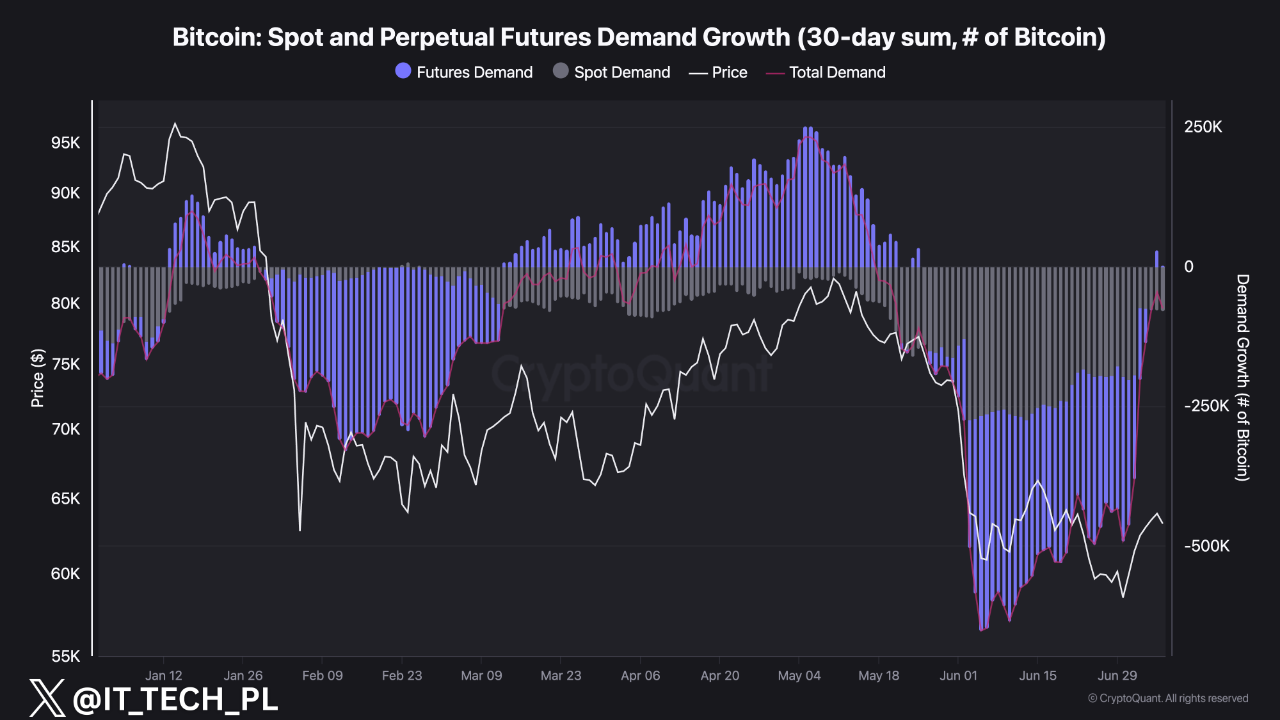
According to IT Tech, Bitcoin’s 30-day cumulative demand has improved by nearly 425,000 BTC over the past week, recovering from nearly -500,000 BTC to around -75,000 BTC.

The rebound has been driven mainly by derivatives markets. Futures demand rose from roughly -295,000 BTC to slightly above zero, signaling new speculative interest among leveraged traders.

Spot demand, however, remains weak at about -78,000 BTC. This suggests long-term buyers have yet to return despite Bitcoin’s price recovery.

While the gap between futures and spot demand shows market conditions are improving, the recovery is still incomplete.

“Historically, the strongest and most sustainable rallies begin when both futures and spot demand move higher together,” IT Tech said, adding that spot demand remains “the missing piece.”

Bitcoin Reclaims $60K as July Outlook Improves

In a July 8 report, CryptoQuant said Bitcoin has climbed about 11% from last week’s low of $57,700 to trade near $64,000. The move allowed the cryptocurrency to reclaim $60,000 as a key support level.

The report also highlighted Bitcoin’s strong historical performance in July. Over the past decade, Bitcoin has ended the month higher in most years, including during bear markets.

For example, Bitcoin gained about 20% in July 2018 and 17% in July 2022 despite broader market weakness.

With Bitcoin entering July after setting a fresh cycle low, CryptoQuant said historical seasonality favors additional near-term upside.

Demand and U.S. Buying Sentiment Improve

CryptoQuant said total Bitcoin demand has recovered significantly after shrinking by nearly 650,000 BTC in early June, the steepest contraction since 2022.

At the same time, spot market selling pressure has eased to its lowest level since mid-May.

The report also showed improving sentiment among U.S. investors. The Coinbase Premium Index recovered from deeply negative levels to -0.062 as Bitcoin rebounded from $57,000, pointing to stronger buying interest from U.S.-based investors.

Bull Market Signal Still Missing

Despite the improving data, CryptoQuant said broader market conditions remain bearish. Traders’ unrealized profit-and-loss margin briefly fell below -20%, a level that typically signals short-term undervaluation. However, the firm’s Bull Score Index remains at 20.

According to CryptoQuant, the index usually needs to rise above 60 to confirm the start of a sustainable bull market.

The firm concluded that demand, price action, and seasonal trends are becoming more supportive. However, stronger spot buying will likely be needed before Bitcoin can establish a lasting bullish trend.

XRP Volume Z-Score Slumps as Open Interest Drops to 3-Month Low

0

XRP has recorded a slump in its Volume Z-Score on Binance as Open Interest declines to a 3-month low amid the ongoing downtrend.

XRP remains under pressure as the broader crypto market continues to trend lower. The ongoing decline has pushed prices down by more than 40% this year, putting the altcoin on track for its biggest yearly loss since the 2022 bear market. 

Meanwhile, market data reveals a slowdown in trading activity on Binance. Recent figures show that both XRP’s Binance Volume Z-Score and Binance Open Interest have dropped significantly. 

Binance XRP Volume Z-Score Shows Lower Trading Activity

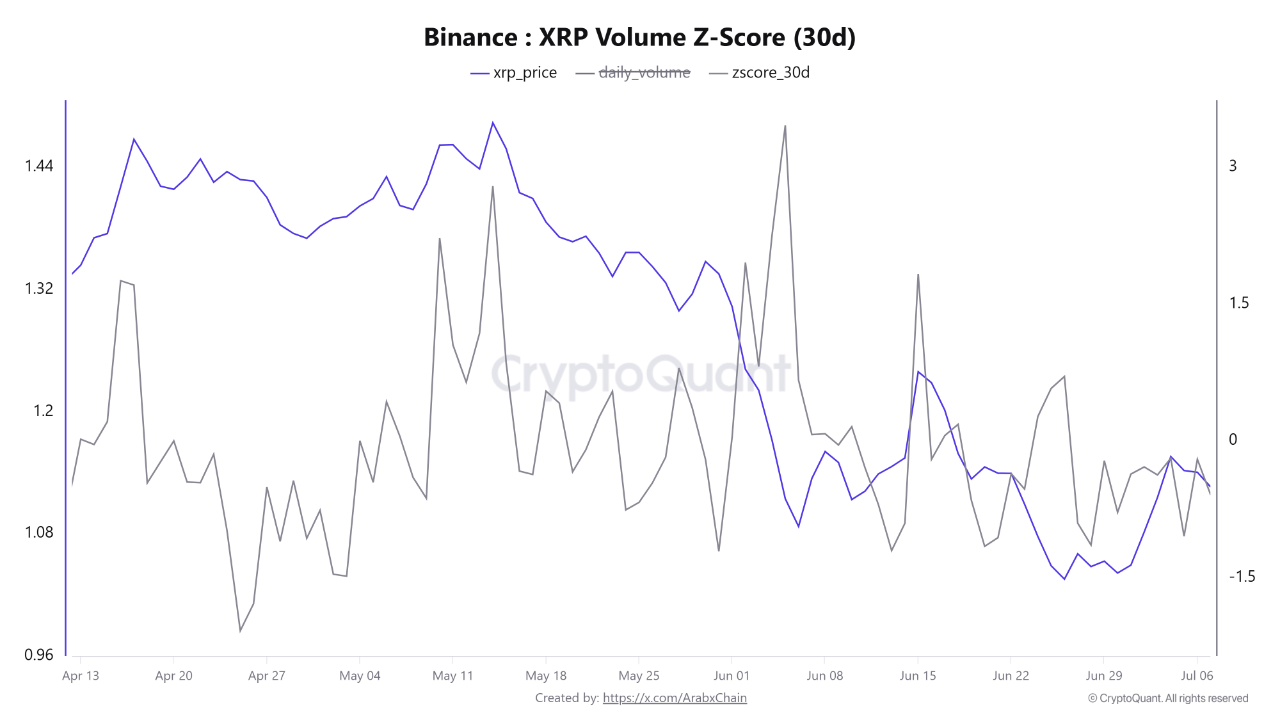
The Binance XRP Volume Z-Score (30D) shows that XRP trading activity on Binance has fallen below the exchange’s average trading volume over the past 30 days.

The latest reading puts the Volume Z-Score at about -0.59, while XRP trades near $1.13. This negative reading means that current trading volume sits below the monthly average. In simple terms, fewer traders are actively participating in the market.

The data also shows that the indicator climbed above 3 several times in recent months. Those spikes matched periods of heavy trading volume and sharp price swings. 

XRP Volume Z-Score CryptoQuant
XRP Volume Z-Score | CryptoQuant

Since then, however, the Volume Z-Score has gradually returned to negative territory. This change confirms that XRP is seeing weaker momentum and lower market participation.

Investors Wait for Fresh Market Catalysts

Lower trading volume does not automatically mean the market has turned bearish. Notably, it often shows that investors are taking a wait-and-see approach as they look for new developments that could bring fresh liquidity into the market.

If the Volume Z-Score stays below its average for a long period, the lower level of participation could weaken the strength of the current price trend, whether the market moves up or down. With fewer traders entering the market, price moves often lose some of their momentum.

Binance Open Interest Falls to a Three-Month Low

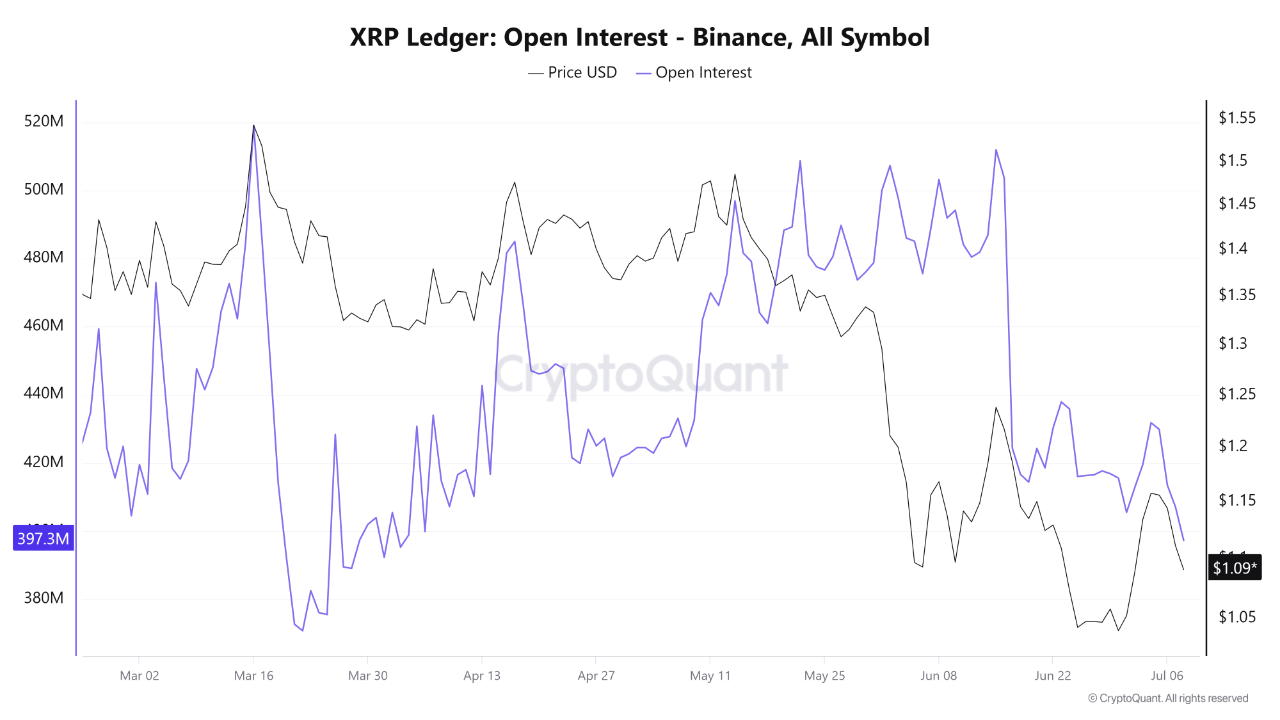
XRP is also witnessing similar trends in the futures market. Specifically, data from Binance shows that open interest in XRP futures contracts has dropped in recent days to about 397 million XRP, its lowest level in more than three months.

This decline comes as XRP trades around $1.09, down 5.4% this week, and shows that futures market activity has slowed as the price continues to fall. The trend suggests that fewer traders are taking leveraged positions than they were earlier this year.

XRP Open Interest on Binance CryptoQuant
XRP Open Interest on Binance | CryptoQuant

A drop in open interest means the total number of outstanding futures contracts has fallen. This usually happens because traders close existing positions or because fewer new positions enter the market. 

Although lower open interest does not automatically indicate more downside, it does show that fewer traders are participating in XRP’s futures market. This environment develops when investors reposition themselves while waiting for a clearer market direction.

If open interest starts rising again alongside a recovery in XRP’s price, it could indicate that liquidity is returning and that trading activity is picking up again. On the other hand, if open interest continues to fall, it may show that traders remain cautious and prefer to wait for stronger signals before opening new positions.

XRP Must Hold This Level to Have a Chance at Recovering Above $1.29

0

XRP must hold above a critical support level to keep its short-term uptrend alive and have a chance at recovering above $1.29.

XRP continues to hold up well on the 4-hour chart, even after giving back a small part of its recent gains. The asset is trading around $1.13 after a modest 1.7% decline. The latest dip looks more like a pause after a strong rally than the start of another downward move.

Several indicators support this theory. Specifically, XRP remains in the upper half of its volatility band, and the Schaff Trend Cycle (STC) continues to show a bullish signal. These readings suggest that momentum has cooled slightly but has not turned negative. 

However, the next stage of recovery depends heavily on a single key support area. If XRP falls below the region around $1.07, its chances of climbing back above $1.29 could weaken considerably.

XRP Breakout Above $1.0753 Improved Technical Outlook

The market outlook became more favorable after XRP confirmed a bullish break of structure during the rally earlier on. The price closed above $1.0753 while maintaining the required volatility buffer, showing that buyers had regained control.

This move also turned a previous swing high into a support level and established a higher-high pattern that now forms the foundation of the current uptrend. Since then, the trend indicator has continued to signal an uptrend, confirming that further gains may play out.

The chart also shows several bullish structure breaks during the recent recovery. These signals indicate that XRP has been forming higher highs and higher lows after a prolonged period of selling pressure. As long as this pattern continues, the broader upward trend remains intact.

XRP Moving Averages Continue to Support the Trend

The moving averages also support the positive outlook. The 21-period exponential moving average sits near $1.1218 and continues to provide short-term support during pullbacks. The 55-period exponential moving average stands around $1.0989 and serves as the market’s main trend support.

XRP remains above both moving averages despite the recent decline. This suggests that buyers still control the medium-term trend and have not lost any major support levels. The pullback has simply brought the price closer to support instead of pushing it below it.

XRP 4h Chart
XRP 4h Chart

The volatility band says something similar. Notably, XRP continues to trade near the upper part of the range, with the upper boundary around $1.1503. Assets that stay near the upper end of their volatility range often retain underlying buying strength even during short periods of consolidation.

Why the $1.07 Area Matters Most

Among all the support levels on the chart, the area around $1.07 remains the most important. This is because it matches the recent break of structure (BoS) at $1.0753, making it the point where former resistance became support.

Notably, such converted support zones are critical because successful retests can strengthen an existing trend. If buyers continue defending this area, they will show that demand remains strong enough to support the broader recovery.

Currently, XRP has entered a controlled pullback while staying above its key moving averages instead of seeing a sharp drop. In addition, the previous swing low near $1.0225 has remained untouched for about 27 four-hour candles, suggesting that sellers have not regained meaningful control.

A Move Above $1.29 Still Depends on Holding Support

The current structure suggests that XRP could continue moving higher if buyers keep control above its key support levels. A successful retest of the 21 EMA near $1.1218 or a renewed advance that keeps four-hour closes above the 55 EMA at $1.0989 would provide additional confirmation.

The bullish outlook would weaken if XRP records a decisive four-hour close below the 55 EMA. Such a move would break the main trend support behind the current recovery and invalidate the setup.

If buyers remain in control, the first resistance level appears near $1.1503 at the upper volatility band. A move above that area could open the way toward the next major resistance around $1.20. Clearing both levels would improve the chances of a rally toward $1.292, where sellers previously stopped the advance.

Glassnode Data Shows Bitcoin Is in Late-Stage Bear Market

Bitcoin has remained in what Glassnode calls “deep value” territory for about five months, with no clear sign that the market has reached a bottom.

According to the on-chain analytics firm, Bitcoin has traded below the True Market Mean of $76,600 and the Short-Term Holder Cost Basis of $72,200 since early February 2026. Although BTC rebounded from about $58,300 to $64,400 over the past week, it is still below both levels, suggesting the market remains weak.

Glassnode said long periods below these cost-basis levels have historically marked the early stages of market bottoms. However, it warned that Bitcoin could still fall toward its Realized Price of around $53,000 before a bottom is confirmed.

Bitcoin Long-Term Holders Drive Selling Pressure

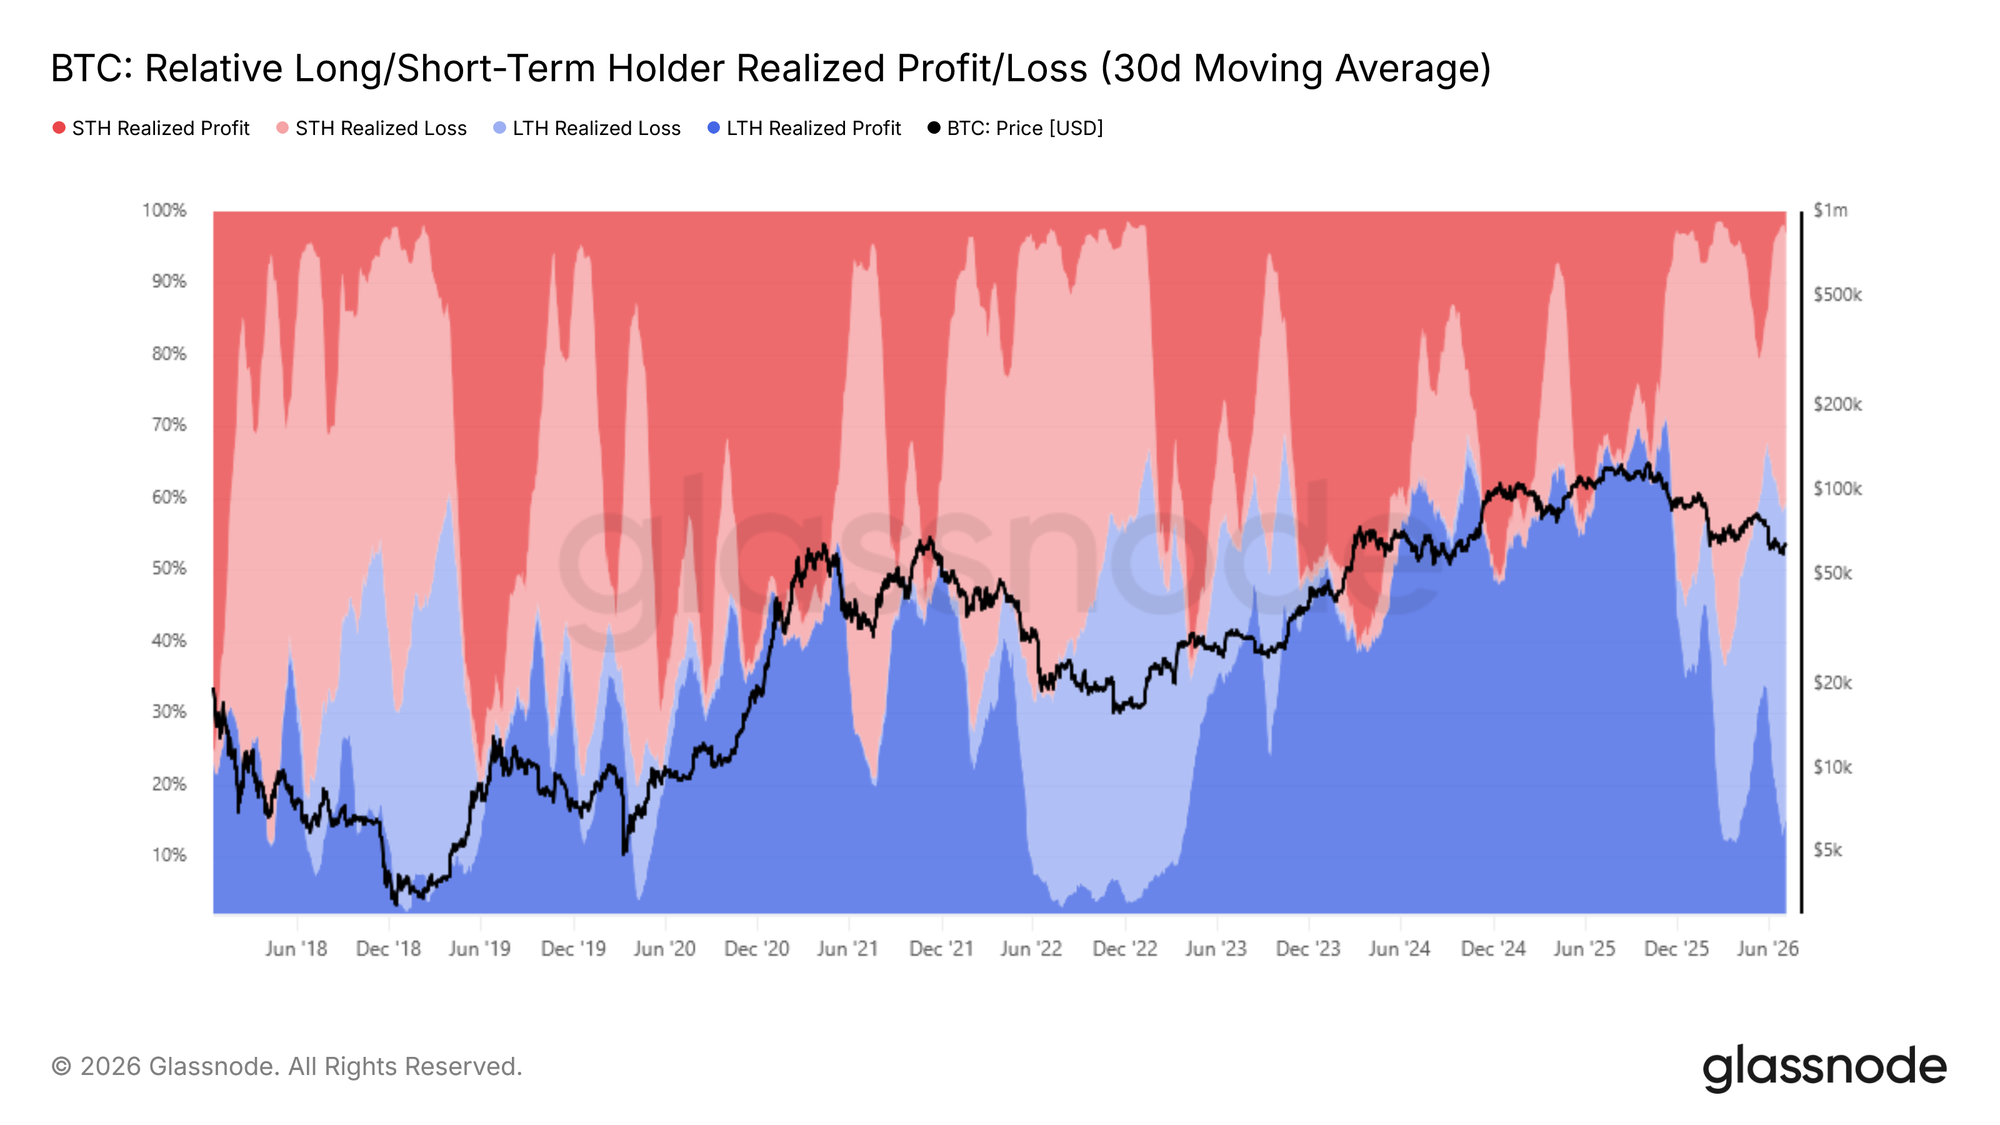
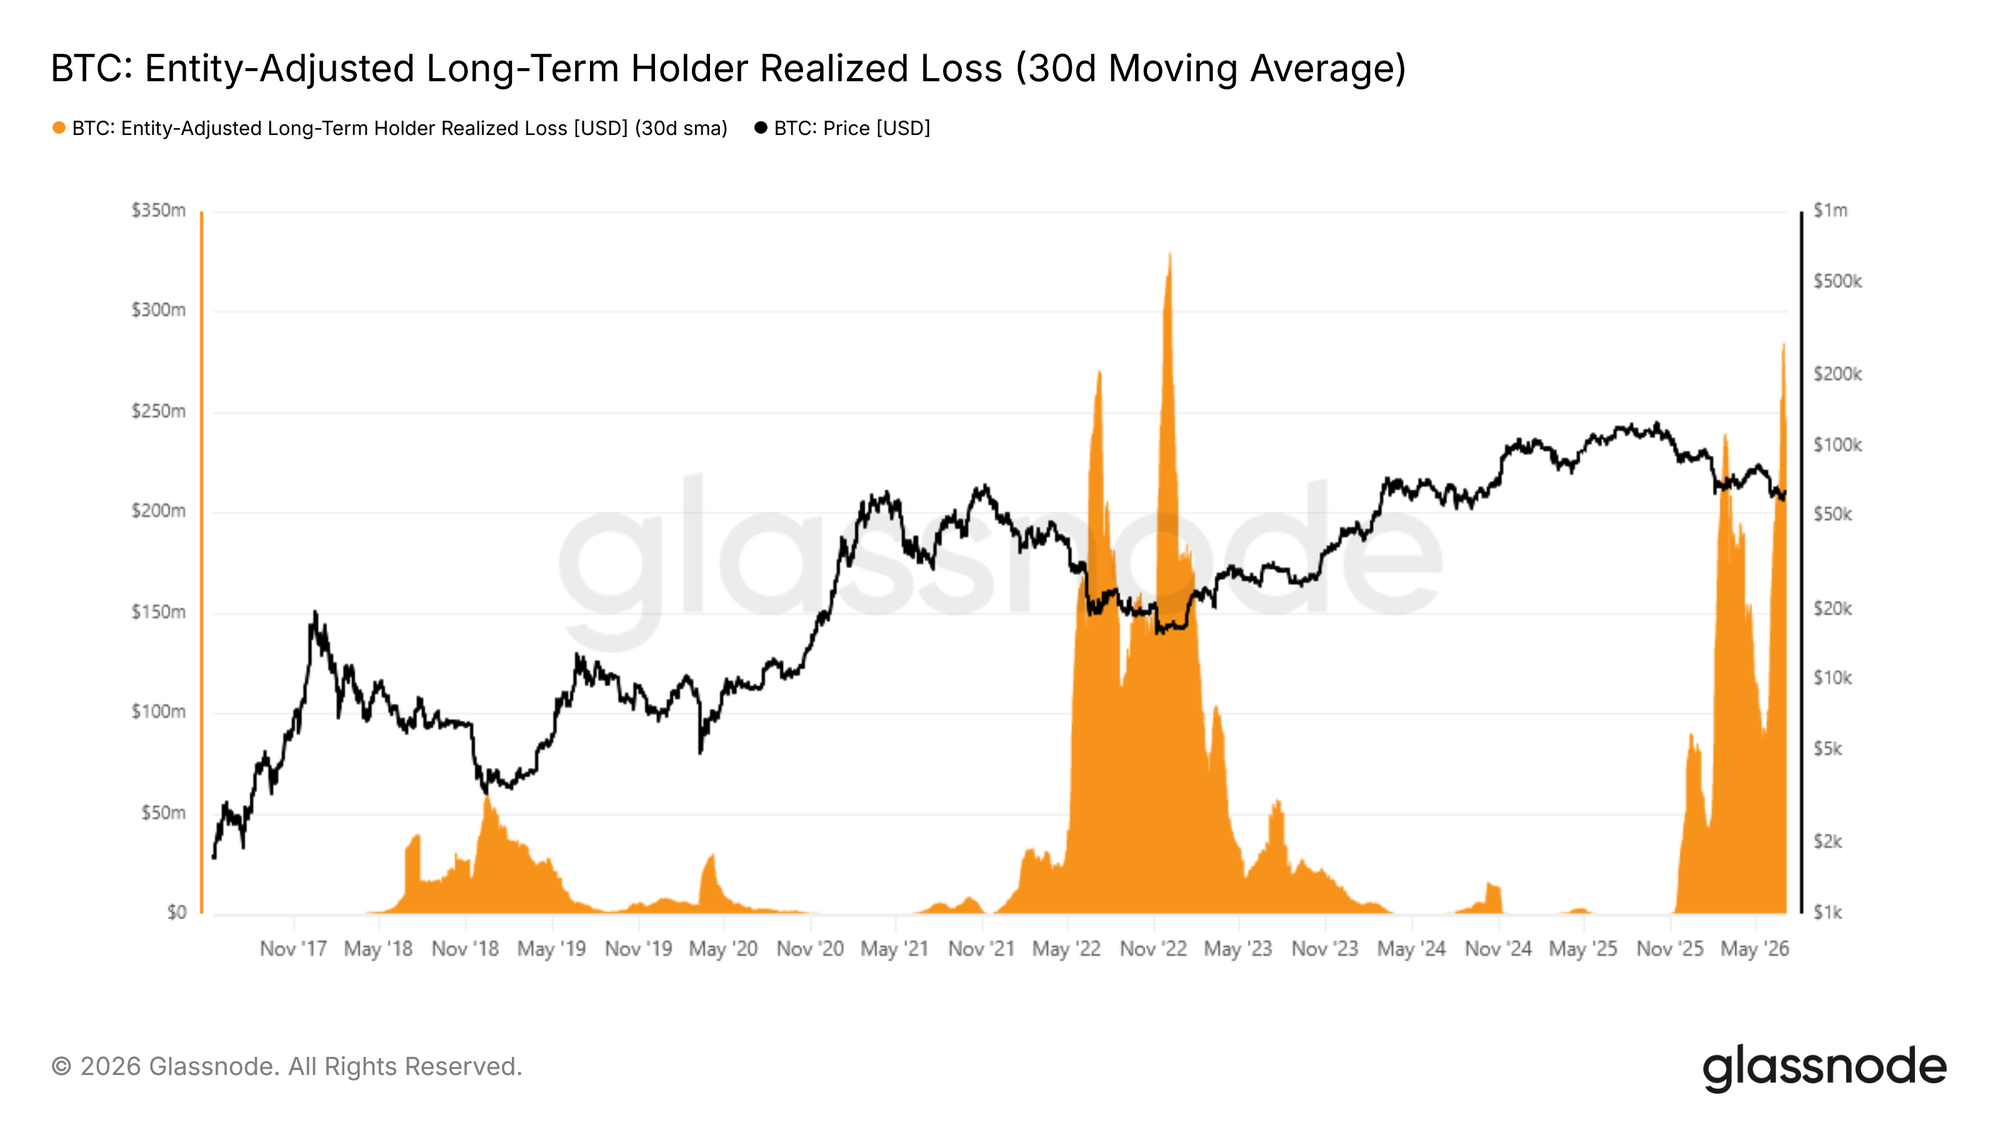
Glassnode identified long-term holders as the main source of selling pressure during the current downturn. Specifically, long-term holders accounted for 43% of all realized losses, up from 15% in early February. 

Many investors who bought near the market peak held through months of losses but are now selling as the prolonged bear market weakens confidence.

Glassnode’s Entity-Adjusted Long-Term Holder Realized Loss metric also climbed to about $280 million per day, the highest level since December 2022. The firm said this marks the second major wave of capitulation in the current bear market.

Unlike the previous wave, however, selling pressure has not eased yet. Glassnode said this suggests the market has not reached full sell-side exhaustion.

ETF Demand Improves, but Institutions Stay Cautious

Institutional demand has improved slightly but remains subdued. Glassnode said average daily Bitcoin ETF outflows narrowed from $193 million to $88.9 million. This suggests capital withdrawals have slowed, although net flows remain negative.

Meanwhile, daily ETF trading volumes have ranged between $650 million and $950 million. That is about 80% below the October 2025 peak, indicating institutional participation has yet to recover meaningfully.

Derivatives Show Mixed Sentiment as Bottom Confirmation Awaits

In derivatives markets, sentiment has become less aggressively bearish but remains cautious. The options put/call ratio has fallen to 0.56, its lowest level of 2026. This suggests demand for bearish bets has eased. However, options data still shows investors are buying protection against further price declines.

Glassnode said Bitcoin may be in the final stages of forming a bear-market bottom. However, a stronger recovery will likely require long-term holder selling to slow, ETF flows to stabilize, and Bitcoin to reclaim key price levels, including the True Market Mean and the short-term holder cost basis.

What’s Next as GRAM Finds Support at the 200-Day MA

0

GRAM is finding support at a key moving average after a strong rejection at a familiar trendline, with analysis highlighting the next possible scenarios.

After the rally that came from its rebrand from TON, GRAM has started trending lower again. For context, the coin jumped 22% between July 1 and 4, spurred by momentum from the rebrand and a broader market rebound.

Now, with momentum fading, the 200-day simple moving average is preventing GRAM from seeing lower prices. The major question here remains if this support will hold and what would happen next in any scenario.

200-Day MA Provides Short-Term Support

Yesterday, GRAM dipped to a low of $1.55, briefly dropping below the 200-day MA at $1.56. However, buying pressure emerged from this dynamic support, ensuring that the coin closed at $1.58, above the moving average.

Notably, the 200 MA has continued to support prices since it broke above in early May. Wednesday’s repeat reinforces the indicator’s importance to bulls. While this is positive for GRAM, momentum remains weak.

Prices continue to retest this support, suggesting that GRAM does not have sustained upward momentum. Additionally, repeated drops to the 200 MA put the support at risk of collapsing, particularly if bears continue to dominate the broader crypto market proceedings.

GRAM Trapped Below Descending Trendline

Moreover, GRAM continues to trade beneath a downward resistance trendline that has suppressed prices for weeks now. After the notable 118% rally in the first seven days of May, the asset peaked at $2.91.

GRAM Below Descending Trendline

Since then, the altcoin has been trending within a descending trendline, with repeated upside attempts capped near this resistance. For context, the June 1 rebound to $2.28 ended near the downward-sloping resistance. The recent rejection at $1.84 on July 4 also aligned with this dynamic supply zone.

As long as GRAM continues to trend below this trendline, it cannot sustainably target higher prices. Interestingly, this resistance is beginning to compress prices around the support below, suggesting a decisive move is on the horizon.

If the 200-day MA continues to hold, GRAM could rebound to the descending trendline, currently around $1.70, representing a 7.5% increase from the current market price of $1.58. Breaking above with strong volume sets GRAM up for a stronger upsurge. The May high of $2.91, where the trendline started, is a probable target, an 84% increase from here.

Support Level to Watch

However, in the case where the 200-day MA fails to continue holding, GRAM could drop lower. The closest support is the key area between $1.52 and $1.43, a 4% to 9% decline from here.

Notably, this was a former resistance area, with GRAM peaking at this level on April 11. However, it broke above it in May and has continued to hold this support since then, despite repeated tests. This would be the most likely target if GRAM loses the 200 MA. Breaching this support puts the coin at risk of a much larger downtrend.