Home Blog Page 686

Bitcoin Network Activity Hits 18-Month Low, but This Points to Looming Explosion: CryptoQuant

0

The Bitcoin network has recently experienced a slowdown in activity, but CryptoQuant believes this could precede a massive upsurge.

The analytical platform revealed today that its proprietary Network Activity Index has dropped sharply to 3,470, marking one of the lowest levels recorded in the last 18 months. 
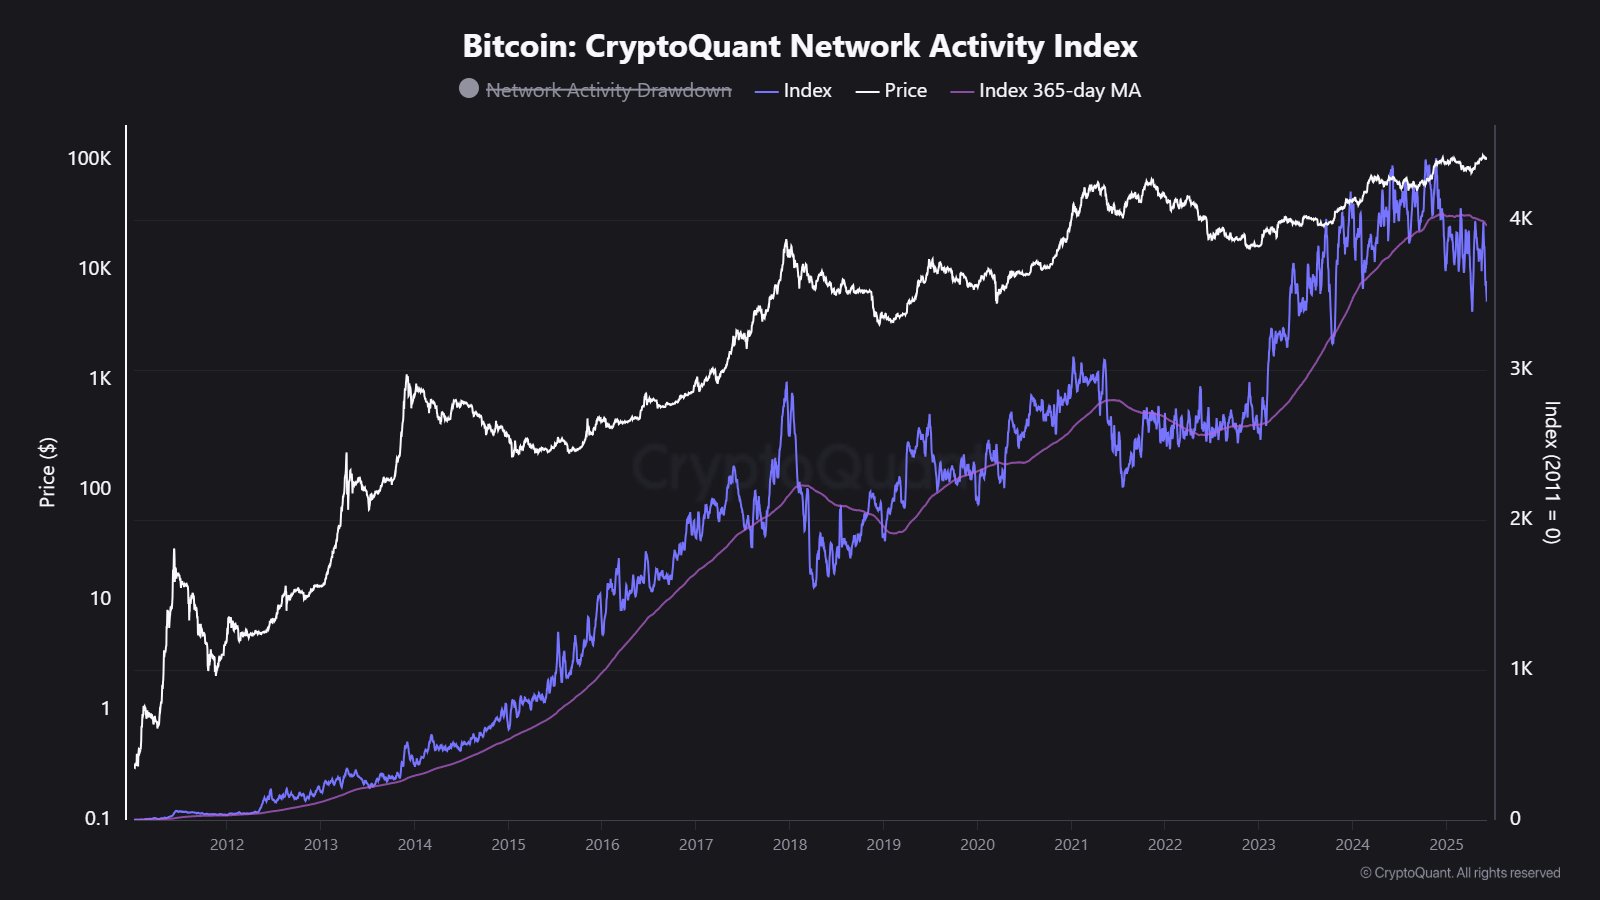
Bitcoin CryptoQuant Network Activity Index

However, CryptoQuant emphasized that such periods of low network engagement have historically preceded major explosions. As a result, the platform suggested that this quiet phase might be the calm before a potential surge.

Data Shows Bitcoin Network Activity is Down

One of the major findings from the report was the notable decline in retail investor interest. Specifically, on-chain transaction volumes between $0 and $10,000 have fallen by over 5%. This decline shows a drop in participation from small investors.
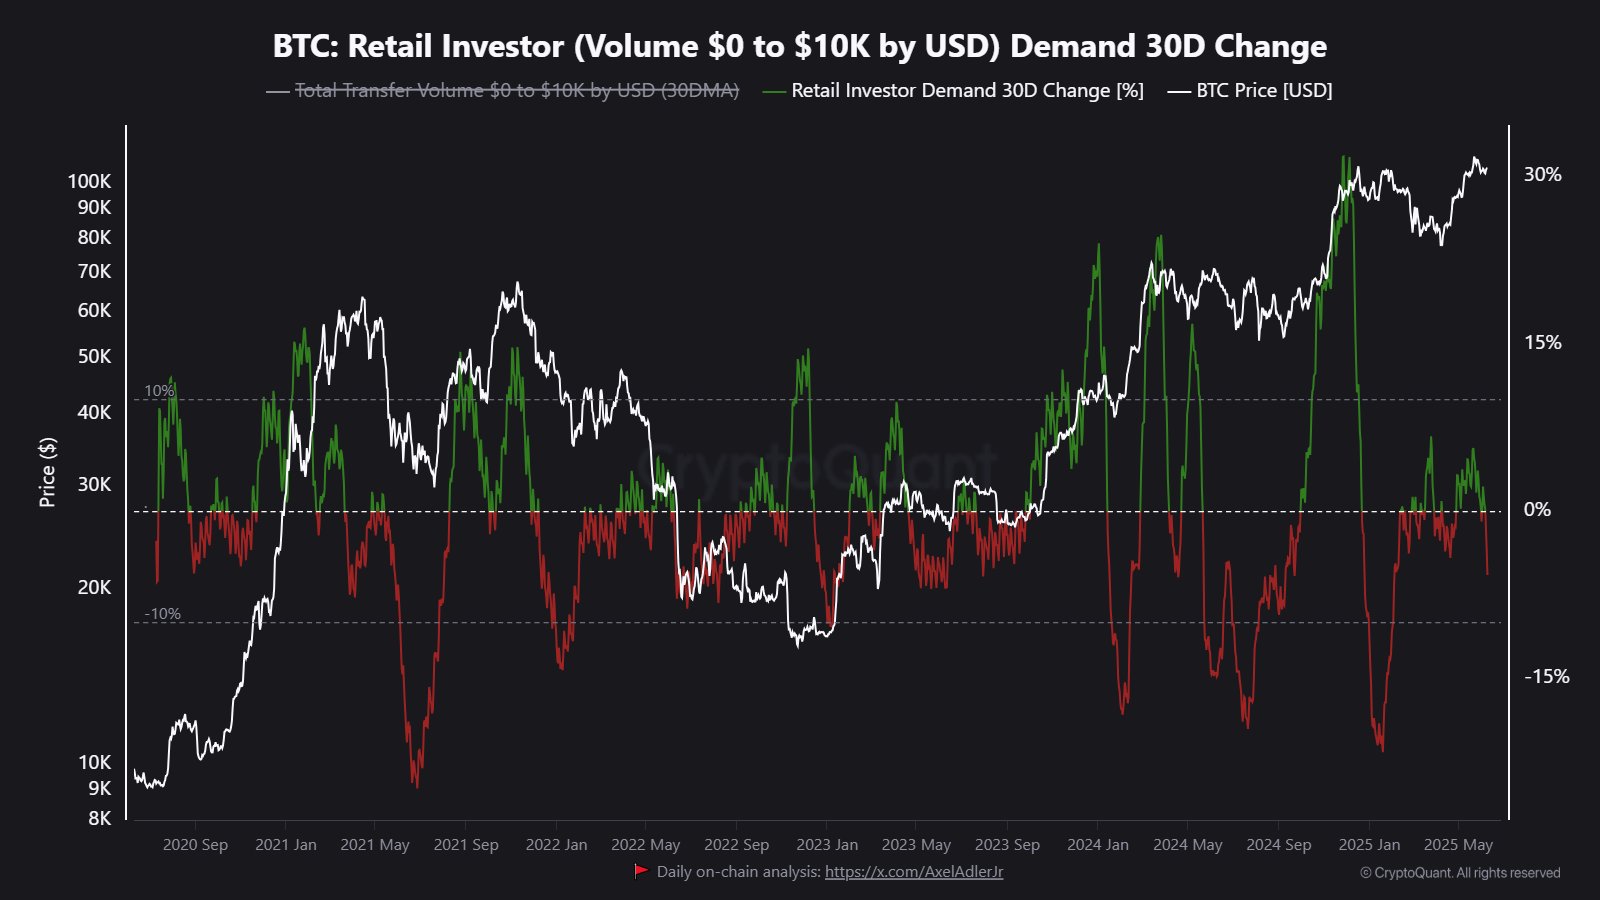
Retail Investor Demand CryptoQuant
Retail Investor Demand | CryptoQuant

Adding to this subdued outlook, spot trading volumes on centralized exchanges have receded to levels last seen in October 2020. Notably, this represents a 4.5-year low and shows there is minimal movement of Bitcoin across both exchanges and on-chain channels. 
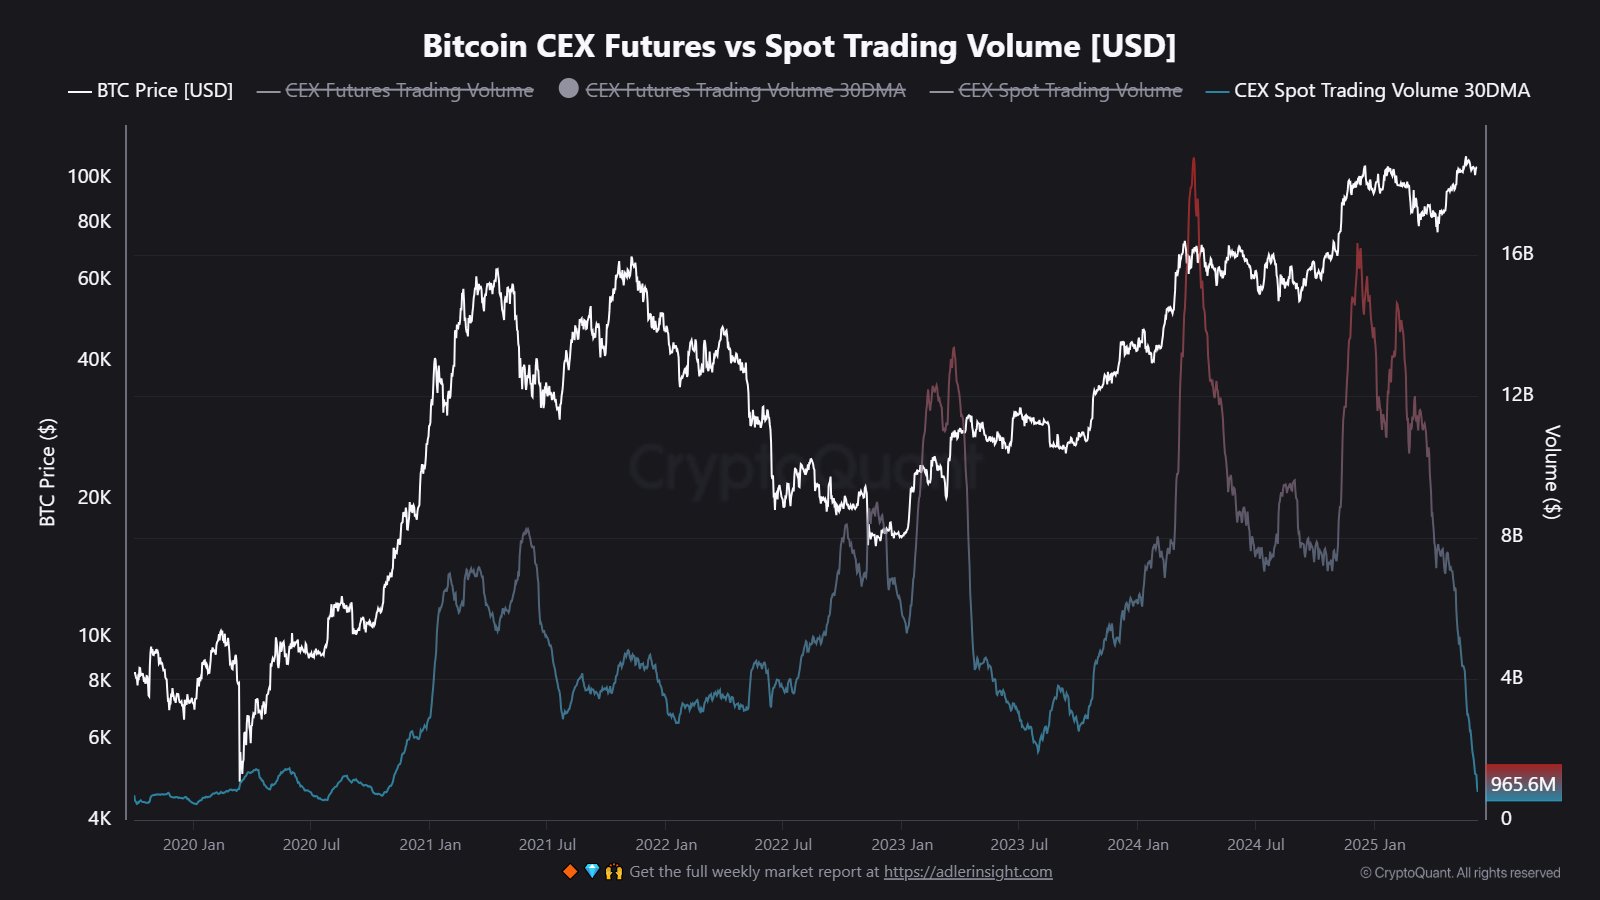
Bitcoin CEX Spot Trading Volume CryptoQuant
Bitcoin CEX Spot Trading Volume | CryptoQuant

Interestingly, despite the ongoing demand from Bitcoin ETFs, which saw $386 million in net inflows yesterday, the CryptoQuant data indicates that there is a lack of organic interest in direct Bitcoin transactions.

LTHs Remain Unfazed While Interest in Futures Trading Grows 

However, while short-term interest seems to be declining, long-term investor confidence remains strong. For one, CryptoQuant highlighted that about 847,200 BTC have recently transitioned into long-term holder supply. 
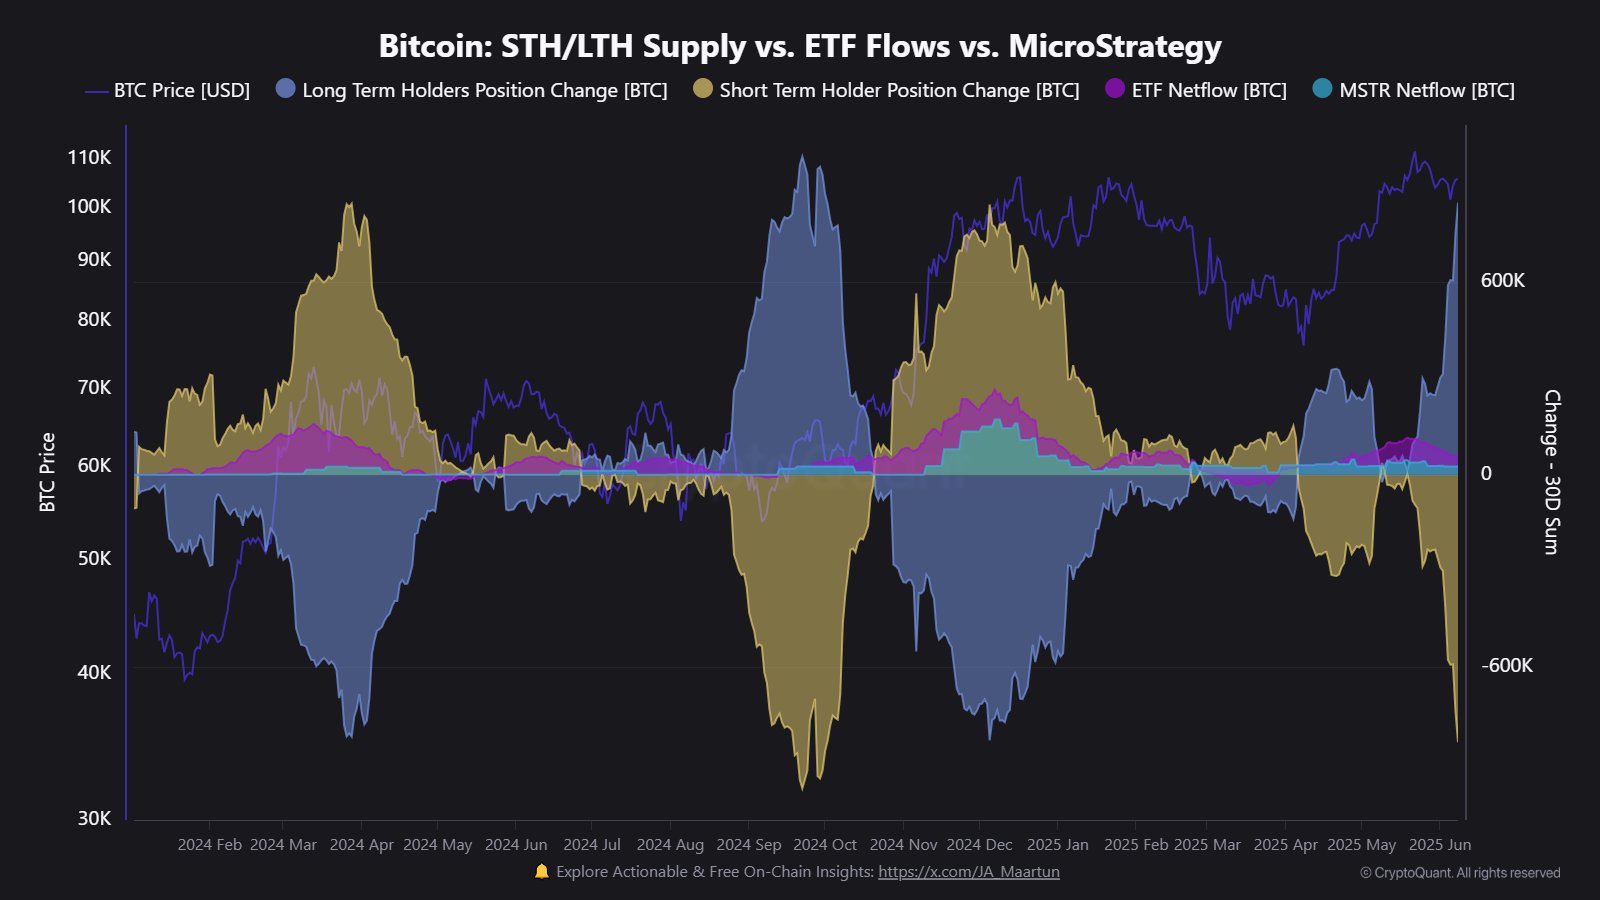
Bitcoin LTH Supply CryptoQuant
Bitcoin LTH Supply | CryptoQuant

What this means is that these coins have remained dormant for over 155 days, suggesting that a large portion of investors are opting to hold their assets rather than engage in frequent trading. 

For perspective, the market witnessed behaviors like this during the accumulation phases observed in September and October 2024. Such a trend indicates strong conviction in future price growth among market participants.

Now, while Bitcoin network activity is down, Ethereum’s futures market is showing a different trend. According to CryptoQuant, Open Interest has climbed to an all-time high of 7.17 million ETH. This spike suggests that while the spot market remains dormant, speculative interest, particularly in Ethereum, is growing. 
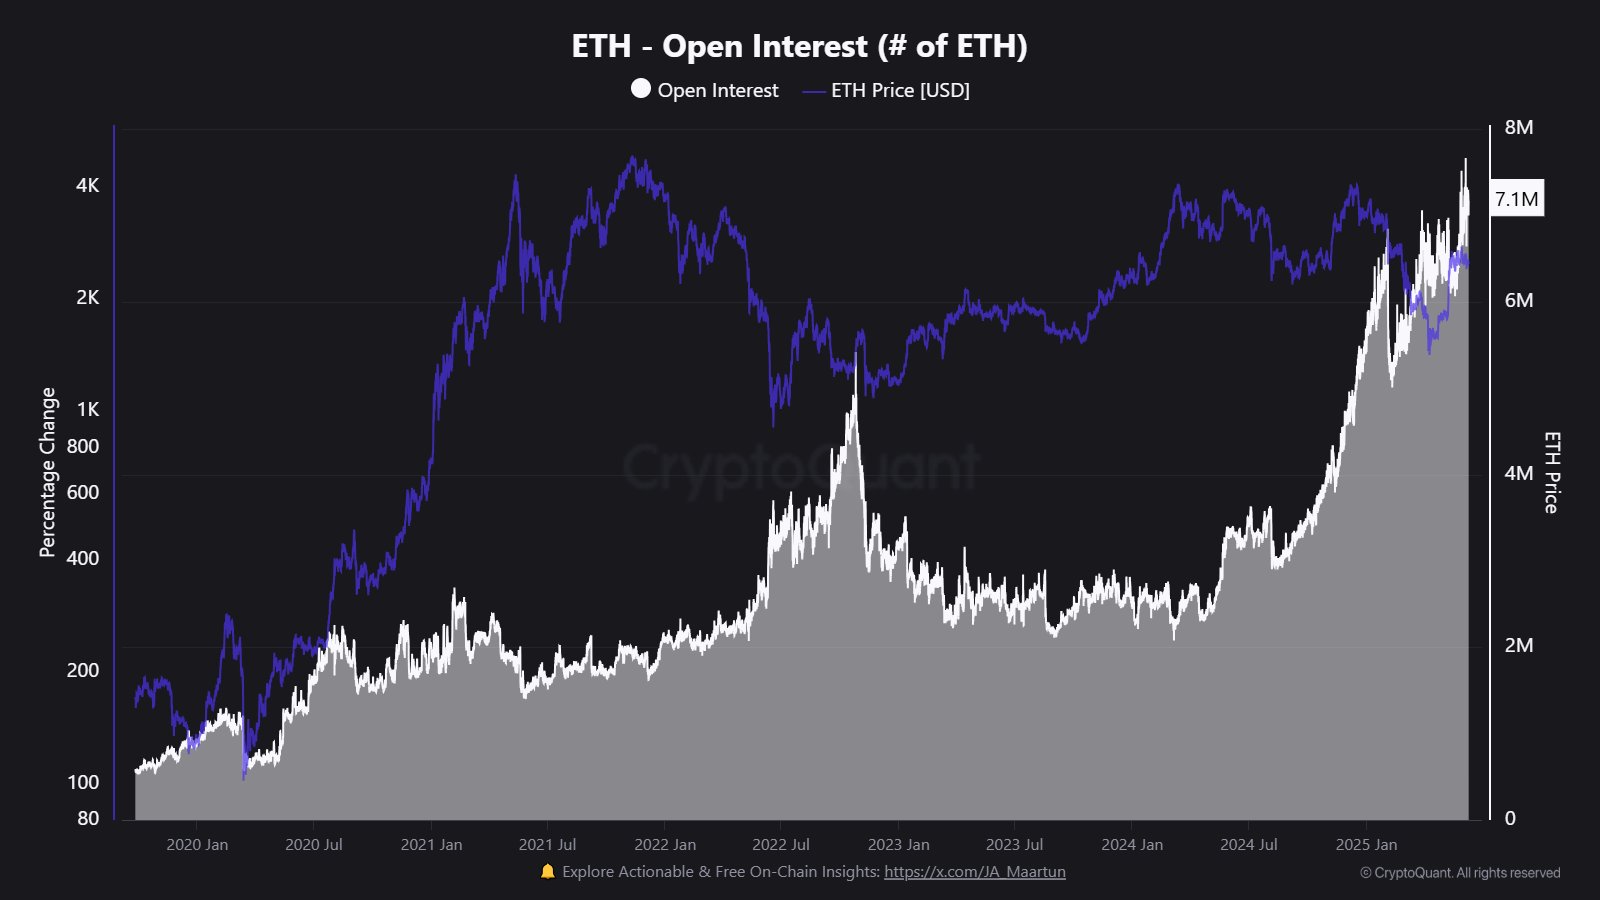
Ethereum Open Interest CryptoQuant
Ethereum Open Interest | CryptoQuant

CryptoQuant also noted a surge in futures trading frequency among retail investors, with the frequency surpassing its one-year average. This could be signaling overcrowding in derivatives markets, as retail speculation in the futures market grows.

Analysts Confident in Bitcoin Upside Potential

Amid these developments, Bitcoin continues its volatile movements. The asset recently peaked at $110,617 before facing a 1.19% drop, settling at $108,911. Despite this dip, Bitcoin remains 8.44% higher than its June 5 low of $100,430. 

Notably, analyst Henry recently confirmed that BTC is currently holding steady above $105,400. He pointed to a bullish flag pattern on the daily chart, suggesting that it is close to completion. According to him, a breakout above the upper trendline could send Bitcoin soaring to the $120,000 mark. 

In a separate analysis, Michael XBT, who previously predicted XRP’s seven-year symmetrical triangle breakout, identified a long-standing resistance on Bitcoin’s one-week chart. 

He pointed out that Bitcoin is approaching the breakout point of an eight-year resistance line. Michael believes this breakout will be unlike any other, predicting it will trigger a FOMO-driven rally of unprecedented scale, likening the potential move to a digital gold rush.

The Crypto Basic also discussed a recent analysis from Benjamin Cowen, founder of Into The Cryptoverse. Specifically, he highlighted that the 200-week Simple Moving Average (SMA) has historically served as a reliable indicator for market cycle tops. 

Cowen noted that when the 200W SMA reaches the previous cycle’s top, it often marks the current cycle’s peak. At present, Bitcoin trades at $108,911, while the 200W SMA is at $48,711. This considerable gap from the previous cycle’s high of $69,000 suggests Bitcoin still has much upside potential in this ongoing cycle.

Trump’s CFT Chair Nominee Asks Congress to Allocate Crypto Spot Market Regulation to the CFTC

0

Brian Quintenz, the head of policy at crypto firm a16z, has endorsed a shift in regulatory jurisdiction for crypto spot markets to the US CFTC.

Quintenz, who is Donald Trump’s nominee for the new Commodities Futures Trading Commission (CFTC) chair, made the comments in a prepared remark on Tuesday, prior to his confirmation meeting.

He asked Congress to expand the US CFTC’s purview beyond the futures market to include the spot crypto commodity market. Among others, he also pledged a clear regulatory framework for digital assets, calling the innovation transformative.

Quintenz Pledges Clear Digital Assets Classification

Notably, Trump endorsed the Andreessen Horowitz’s a16z executive as the new CFTC chair under his administration in February. As part of the confirmation process, Quintenz would meet with the US Senate Agriculture Committee today for his hearing.

Ahead of this hearing FOX journalist Eleanor Terret reported that the former CFTC commissioner is already making demands from Congress. One of which is to give the futures market regulator control of the crypto spot commodity market.

Quintenz stated in his prepared remarks that this might turn out to be the most significant and thrilling period in the agency’s history, as Congress evaluates the possibility of granting the agency new authority over the spot crypto commodity markets.

He emphasized the need for regulatory clarity, particularly regarding the classification of crypto tokens. Remarkably, the boiling issue was part of the stumbling block in the crypto industry’s fallout with the Gary Gensler-led US Securities and Exchange Commission (SEC).

While the current administration has made significant progress, Quintenz insinuates that the CFTC would better regulate the spot commodity market. He further pledged a clear framework, classification, and jurisdiction for overseeing the trading market.

Meanwhile, the former CFTC commissioner is not the first to suggest the move; Coinbase made a similar proposition to Congress in February. If this pulls through, it will diminish the US SEC’s regulatory role in the digital asset sector.

Quintenz’s View of Blockchain Technology

Furthermore, he shared that blockchain technology and cryptocurrencies are not going away. As a result, there is a need for proper regulation. His remarks also noted that blockchain extends beyond the financial market, affecting various aspects of society.

Quintenz highlighted that he would leverage his experience in the crypto sector with a16z to right the wrongs previously done by regulators. He also emphasized his intolerance for bad actors and aims to maintain the CFTC’s focus on striking a balance between risk and innovation.

Interestingly, Quintenz holds crypto assets worth $3.4 million, a testament to his strong belief in the innovation. However, he stated earlier that he would liquidate any that pose a conflict of interest upon confirmation as CFTC chair.

Fixed income Asset Fully Backed by U.S. Treasuries Now Live On XRP ledger

0

Digital Commercial Paper (DCP), a tokenized fixed-income asset backed by U.S. Treasuries, is now operational on the XRP Ledger. 

According to Ripple’s press release, the asset, rated Prime-1 by Moody’s, offers a modern approach to commercial paper issuance, transaction, and integration. 

DCP aims to improve treasury management efficiency while leveraging XRPL’s capabilities to facilitate faster settlements, reduce transaction costs, and increase round-the-clock availability. Guggenheim Treasury Services operates the asset.

Efficient Issuance and Management 

DCP is issued, tokenized, and managed through the Zeconomy platform. This robust system facilitates the asset’s issuance via Great Bridge Capital Company, a bankruptcy-remote Special Purpose Vehicle (SPV) established by Guggenheim Treasury Services.

Notably, Zeconomy’s platform offers institutional-grade services, providing digital asset governance, integration, and a powerful toolkit for corporations and traditional finance participants. This setup ensures secure management while enhancing DCP’s accessibility for Qualified Institutional Buyers and Qualified Purchasers.

As of its launch in September 2024, DCP has already processed over $280 million in issuance. The tokenized asset is backed by U.S. Treasury securities, with maturities available up to 397 days, providing investors with a stable and flexible short-term debt instrument. Its Prime-1 rating from Moody’s further bolsters its credibility and attractiveness to institutional investors.

The Role of XRP Ledger in Tokenized Finance

XRP Ledger offers several advantages that make it an ideal platform for DCP. The network’s efficient, low-cost settlement system ensures swift transactions, which are critical in the fast-paced world of commercial paper. Furthermore, the blockchain’s capacity for 24/7 operation helps address the delays and operational costs inherent in traditional settlement processes.

Moreover, XRPL’s scalability and security are key factors in supporting DCP’s high-volume issuance and transactions. The platform has already processed over 3.3 billion transactions since its inception in 2012 without any security breaches. 

As Markus Infanger, Senior Vice President of RippleX, stated:

“The inception of DCP is an example of this shift, and it expands the offering of institutional financial assets coming to XRP Ledger. The XRP Ledger is the backbone, established to support regulated financial assets that need efficiency, scalability, and compliance features that meet the demands of global markets.”

Pundit Says XRP Is the Coin That Comes Closest to Satoshi Nakamoto’s Main Idea

A media figure recently made a bold claim linking XRP to the core vision of Bitcoin’s anonymous creator, Satoshi Nakamoto.

The statement sparked speculation and admiration among XRP proponents, who believe XRP is “the real” Bitcoin.

XRP as Satoshi Nakamoto’s Main Idea

In a post on X, media personality John Squire claimed that XRP comes closest to embodying Satoshi Nakamoto’s original vision.

The statement suggests that the XRP token possesses the scalability, decentralization, and use-case orientation that may reflect what Satoshi intended.

Notably, Bitcoin emerged as a peer-to-peer electronic cash system. However, some XRP supporters argue that high fees, slow transaction speeds, and mining centralization have diluted Bitcoin’s original goals. 

They believe XRP came to address these issues. Proponents often bolster this argument by pointing out that some of XRP’s original architects were also involved in Bitcoin’s early development.

Further Theory Linking XRP to Satoshi

Joining the conversation, XRP community commentator Alex Cobb theorized that Satoshi may have played a role in XRP’s early creation. He referenced a famous quote attributed to Nakamoto from April 2011, which stated that Satoshi had “moved on” to other things.

Interestingly, just over a year later, XRP launched in June 2012, and some believe this hints at a potential connection. Though speculative, this theory isn’t new within the XRP community. 

Many argue that XRP’s design improvements better reflect the practical implementation of decentralized finance than Bitcoin currently does.

In a previous commentary, Squire extended this narrative by comparing XRP to Starlink, emphasizing its speed and utility. In his analogy, Bitcoin is like a landline—reliable but slow—while Ethereum is a cell phone—more capable but still limited. Meanwhile, Squire claims XRP is the Starlink of crypto: fast, modern, and with minimal lag.

This metaphor highlights XRP’s ability to process transactions in 3–5 seconds with fees under $0.01, outperforming Bitcoin’s 10-minute blocks and Ethereum’s often congested network.

XRP’s Thin Connection to Bitcoin

Interestingly, speculation has run wild in the XRP community about the project’s potential link to Satoshi Nakamoto. A commentary from Ripple CEO Brad Garlinghouse added fuel to the fire.

During a podcast, Garlinghouse noted that some XRP Ledger developers, including Ripple’s CTO David Schwartz, were also early Bitcoin engineers who aimed to improve scalability and reduce energy consumption.

This statement led to theories highlighting Schwartz’s involvement in XRP’s development that began shortly after Nakamoto’s last known activity. Additionally, Schwartz once shared a pre-released version of Bitcoin’s code around his birthday, which coincides with Satoshi’s.

Schwartz himself has joked that he is more likely to be Nakamoto than Craig Wright, who previously claimed the identity but was dismissed by a court. However, the Ripple CTO was only presenting an analogy. While no confirmed identity exists, the XRP community continues to speculate.

Meanwhile, the broader crypto community remains skeptical of any direct connection between Satoshi and XRP. Yet for XRP supporters, it’s another reason to believe they hold an asset that builds upon Satoshi’s vision.

Angel Investor Says 10,000 XRP Portfolio Today Can Turn Into $2.5 Million

Angel investor Armando Pantoja has boldly asserted that a portfolio holding just a few thousand XRP tokens could grow to $2.5 million.

Pantoja shared this perspective in a recent tweet, emphasizing the significance of holding 10,000 XRP tokens. He compared its potential to owning one whole Bitcoin or acquiring 50 Ethereum tokens.

According to him, every financially savvy individual knows the value of holding 10,000 XRP, 1 Bitcoin, or 50 ETH — and simply waiting for the portfolio to grow, potentially reaching as high as $2.5 million. At that point, he recommends diversifying into even more secure investments, such as real estate.

Buying 10,000 XRP and Turning It Into $2.5 Million

Notably, acquiring 10,000 XRP today would require an investment of $22,300, based on the current token price of $2.23. As of now, data from the XRP Rich List shows that only 166,170 wallets hold between 10,000 and 25,000 XRP, while 159,509 wallets hold between 5,000 and 10,000 tokens.

For context, XRP has over 6.5 million wallet addresses. Less than 4% of these addresses hold at least 10,000 XRP. This highlights a significant disparity and how few investors meet this threshold. Conversely, over 5 million addresses hold 500 XRP or fewer, indicating that the majority of XRP holders are retail investors, while whales possess most of the supply.

Meanwhile, analysts like Pantoja and Edoardo Farina of Alpha Lions Academy continue to stress the significance of holding 10,000 XRP tokens. According to them, this level of accumulation could lead to unprecedented financial freedom. Pantoja’s latest projection that 10,000 XRP could one day be worth $2.5 million reinforces this vision.

With fewer than 4% of XRP wallets at this level, the analysts urge investors to consolidate and build their holdings to reach this threshold and join the top tier of XRP holders.

Meanwhile, Pantoja’s proposition implies that XRP would need to rise to $250 per token for 10,000 XRP to be worth $2.5 million. This is a staggering increase of 11,111% from the current price of $2.23.

Several analysts have echoed this bullish outlook, with some, like Javon Marks, suggesting a $250 price target could be achieved in this cycle. At that price, XRP’s market cap would reach approximately $15 trillion, up from about $131 billion today.

Turning Bitcoin and Ethereum Portfolios Into $2.5 Million

Pantoja also proposed that a portfolio containing 1 Bitcoin could be worth $2.5 million in the future. Currently, 1 BTC is at around $105,500. His prediction aligns with that of ARK Invest, which projects a potential price of $2.4 million per Bitcoin by 2030 in an extremely bullish scenario.

As for Ethereum, holding 50 ETH today is worth about $125,000. For this portfolio to reach $2.5 million, Ethereum would need to rise to $50,000 per coin. According to prediction outlet Telegaon, ETH could reach that level between 2040 and 2050.

Still, these projections, while promising, remain highly speculative.

What to Do After Reaching $2.5 Million

Pantoja suggests that once investors hit the $2.5 million mark, whether through XRP, Bitcoin, or Ethereum, the next step should be to purchase a home and invest in assets yielding 3% to 5% annually. This strategy, he says, would help cover taxes and allow one to live a life of financial freedom.

Owning More Than 10,000 XRP Today Is already a Luxury Few Can Afford: Pundit

Crypto founder Edoardo Farina is reiterating his long-held view that 99% of XRP holders risk being priced out as inflation and economic pressures rise.

In a recent disclosure, he claimed that owning more than 10,000 XRP is quickly becoming a luxury out of reach for the average person. He argued that XRP holders are increasingly forced to sell off their assets to cover basic living expenses as inflation rises and fiat currencies weaken.

For context, with XRP worth $2.30 per coin today, acquiring 10,000 XRP requires a significant financial commitment of $23,000. This is a major hurdle in a global landscape where many people are in debt or living paycheck to paycheck.

Moreover, data from XRP’s rich list further emphasizes this point. Out of more than 6.55 million XRP wallet addresses, fewer than 4% hold at least 10,000 XRP. In contrast, over 5 million wallets contain 500 XRP or fewer.

Specifically, only 166,258 wallets hold between 10,000 and 25,000 XRP, while 159,566 hold between 5,000 and 10,000 XRP.

As a result, market commentators like Farina from Alpha Lions Academy stress the strategic importance of holding 10,000 XRP. They argue that reaching this threshold could pave the way for significant financial gains.

99% of XRP Holders May Be Left Behind

Farina initially estimated that 95% of XRP holders would eventually be priced out. However, his latest video warned that this figure could rise to 99%.

He cites rising inflation, the declining purchasing power of fiat currencies, and global economic instability as key factors driving this shift.

“We’re already seeing people around the world selling their XRP just to buy groceries,” he said, adding, “It’s not about luxury anymore; it’s about survival.”

According to Farina, the apparent surge in asset prices may not entirely reflect growth in crypto value, but rather a collapse in the purchasing power of traditional fiat currencies. He notes that it now takes over $20,000 to acquire what used to be a $5,000 XRP stack.

“Is Bitcoin really going to $112,000, or is the U.S. dollar just becoming worthless?” he asked. Farina often criticizes Bitcoin’s price surge as artificial and misleading, claiming it’s designed to trap retail investors and use them as exit liquidity.

Don’t Sell, Adapt Instead

Meanwhile, Farina strongly urges XRP holders to seek alternative sources of income rather than selling their crypto holdings. He recommends side hustles, digital work, or even relocating to more affordable countries, something he did by moving to Greece.

“If you truly believe XRP has long-term value, selling it now for groceries is exactly what they want you to do,” Farina said. “Think differently. Protect your assets.”

His message is that the value of XRP could rise much higher in the future, rewarding today’s steadfast holders. He discourages premature selling, warning that the window for affordable accumulation is closing fast, and many risk missing what he believes is a once-in-a-lifetime opportunity with XRP.

SUI Eyes $4 Breakout as Network Recovers From Cetus Attack

The price of SUI has rebounded from lows triggered by the Cetus exploit with a bullish wedge breakout. Can rising TVL help it reclaim $4?

Following the recent Cetus attack, SUI is showing gradual recovery in network growth and market prices.

With a falling wedge breakout rally, SUI aims to surpass the critical $3.45 resistance to reclaim the $4 mark. Will the broader network recovery drive increased demand for the altcoin?

SUI Price Analysis

In the 4-hour price chart, SUI displays a falling wedge pattern formed during the pullback caused by the Cetus attack. However, a V-shaped recovery has reclaimed the $3 mark and surpassed the short-term resistance trendline. 

SUI Price Chart
SUI Price Chart

Currently, SUI is challenging the 23.6% Fibonacci resistance level at $3.45. Struggling to break through this resistance ceiling, SUI has experienced an intraday pullback of less than 2%.

Nevertheless, the broader bullish trend has regained momentum, as indicated by the supertrend indicator. The ADX line, at 25 points, reflects increased trend momentum. Thus, technical indicators maintain a bullish outlook for SUI, anticipating a potential breakout above the $3.45 resistance level.

Based on Fibonacci levels, a bullish close above $3.45 could propel SUI toward the $4 psychological level. Additionally, the $4.29 level represents a key resistance target.

Conversely, the weekly low near $3.22 serves as a critical support level, followed by the $3 psychological mark. The 50% Fibonacci level at $2.71 acts as the final line of defense before a potential pullback to $2.

Analysts Show Strong Confidence in SUI

Supporting SUI’s bullish prospects, multiple crypto analysts have expressed confidence. Michael van de Poppe recently tweeted that SUI is a core pillar in the upcoming bull cycle.

The analyst highlighted key metrics: SUI ranks as the eighth-highest total value locked (TVL) protocol across chains, and SUI LEND has become one of the largest lending protocols, surging 90% over the past month.

SUI LEND’s TVL has surpassed $700 million. Notably, 10% of SUI’s total TVL comes from Bitcoin-related assets, and multiple institutions, including Grayscale, have filed for SUI ETFs. These factors signal strong confidence from institutions and large investors.

Additionally, CryptoKaleo compares SUI to Solana, noting that many investors declared Solana “dead” during the previous bearish cycle. The analyst views every FUD event as a buying opportunity, as these altcoins often rebound strongly.

Despite the recent Cetus attack, the protocol is officially operational again, and there is a robust recovery plan following recent voting. A compensation plan is in place for affected users.

CryptoKaleo also highlights a triangle pattern in the SUI price chart, signaling the potential for an upside breakout. 

PEPE Rally Gains Steam as Whales Accumulate and Derivatives Surge

Whales are accumulating PEPE as technical indicators suggest a potential trend reversal. Will the meme coin reach $0.000015?

The frog-themed meme coin, Pepe, has recorded its fifth consecutive positive day, with an intraday recovery of over 7%. Could this short-term reversal in Pepe result in a price surge back to $0.000015?

PEPE Price Analysis

Pepe is showing a bullish turnaround from the 23.6% Fibonacci retracement level at the psychological support of $0.000010. With five consecutive bullish candles, the meme coin has recovered from last week’s two-day crash, which saw a 16% drop. The ongoing recovery rally now aims to challenge the 38.2% Fibonacci level at $0.00001352.

PEPE Price Chart
PEPE Price Chart

With an intraday gain of more than 7%, the growing bullish momentum hints at a potential crossover between the 100-day and 200-day EMAs, an indicator that could signal a buying opportunity for price action traders.

Additionally, the MACD and Signal lines are nearing a bullish crossover as the bearish histograms decline, suggesting a possible trend reversal with renewed bullish momentum.

Overall, the technical indicators maintain a positive outlook for the frog-themed meme coin.

A potential breakout above the 38.2% Fibonacci level would increase the likelihood of Pepe retesting the 50% level at $0.00001592. On the downside, the key support remains the 50-day EMA at $0.00001147.

Large Investors Bullish on PEPE

Despite heightened volatility over the past month, crypto whales remain optimistic about the PEPE meme coin.

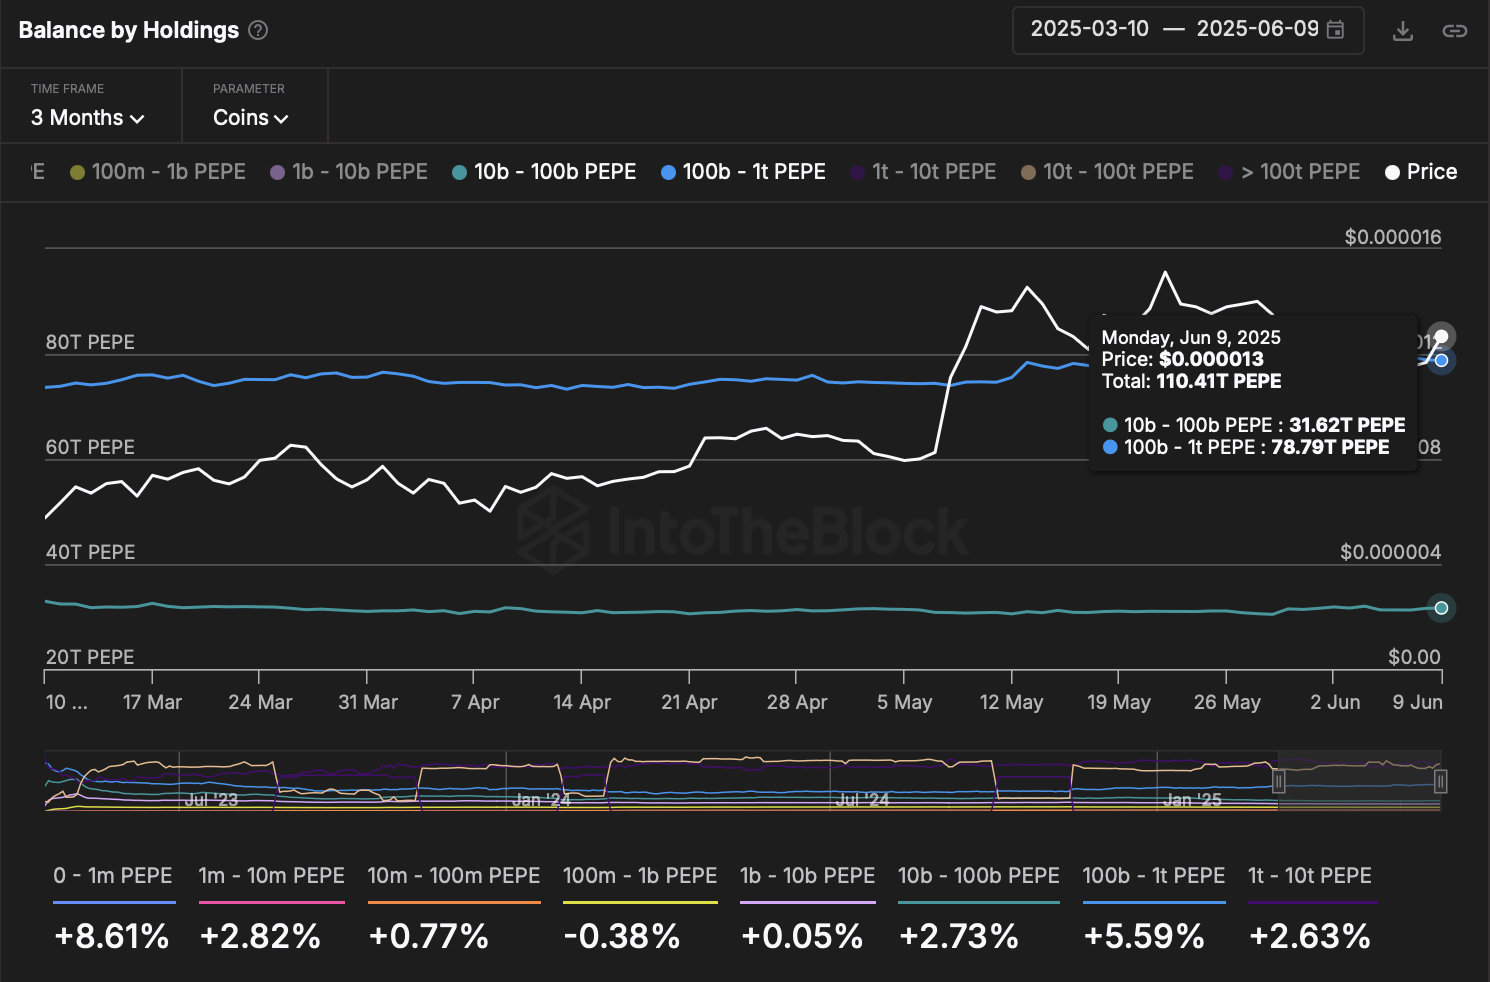
According to IntoTheBlock’s Balanced Buy Holding Indicator, holdings by large investors with portfolios of 10 billion to 1 trillion PEPE have increased from 106.54 trillion tokens to 110.41 trillion tokens.

PEPE Balance by Holdings

Notably, holdings by investors with 100 billion to 1 trillion PEPE have grown from 73.64 trillion to 78.79 trillion tokens.

Over the past 30 days, portfolios holding 10 billion to 100 billion PEPE have increased by 2.73%, while those with 100 billion to 1 trillion have expanded by 5.59%.

Interestingly, massive whales holding between 1 trillion and 10 trillion PEPE have also increased their holdings by 2.63% over the same period, reflecting growing confidence in the Ethereum-based meme coin among large investors.

Derivative Traders See Upside 

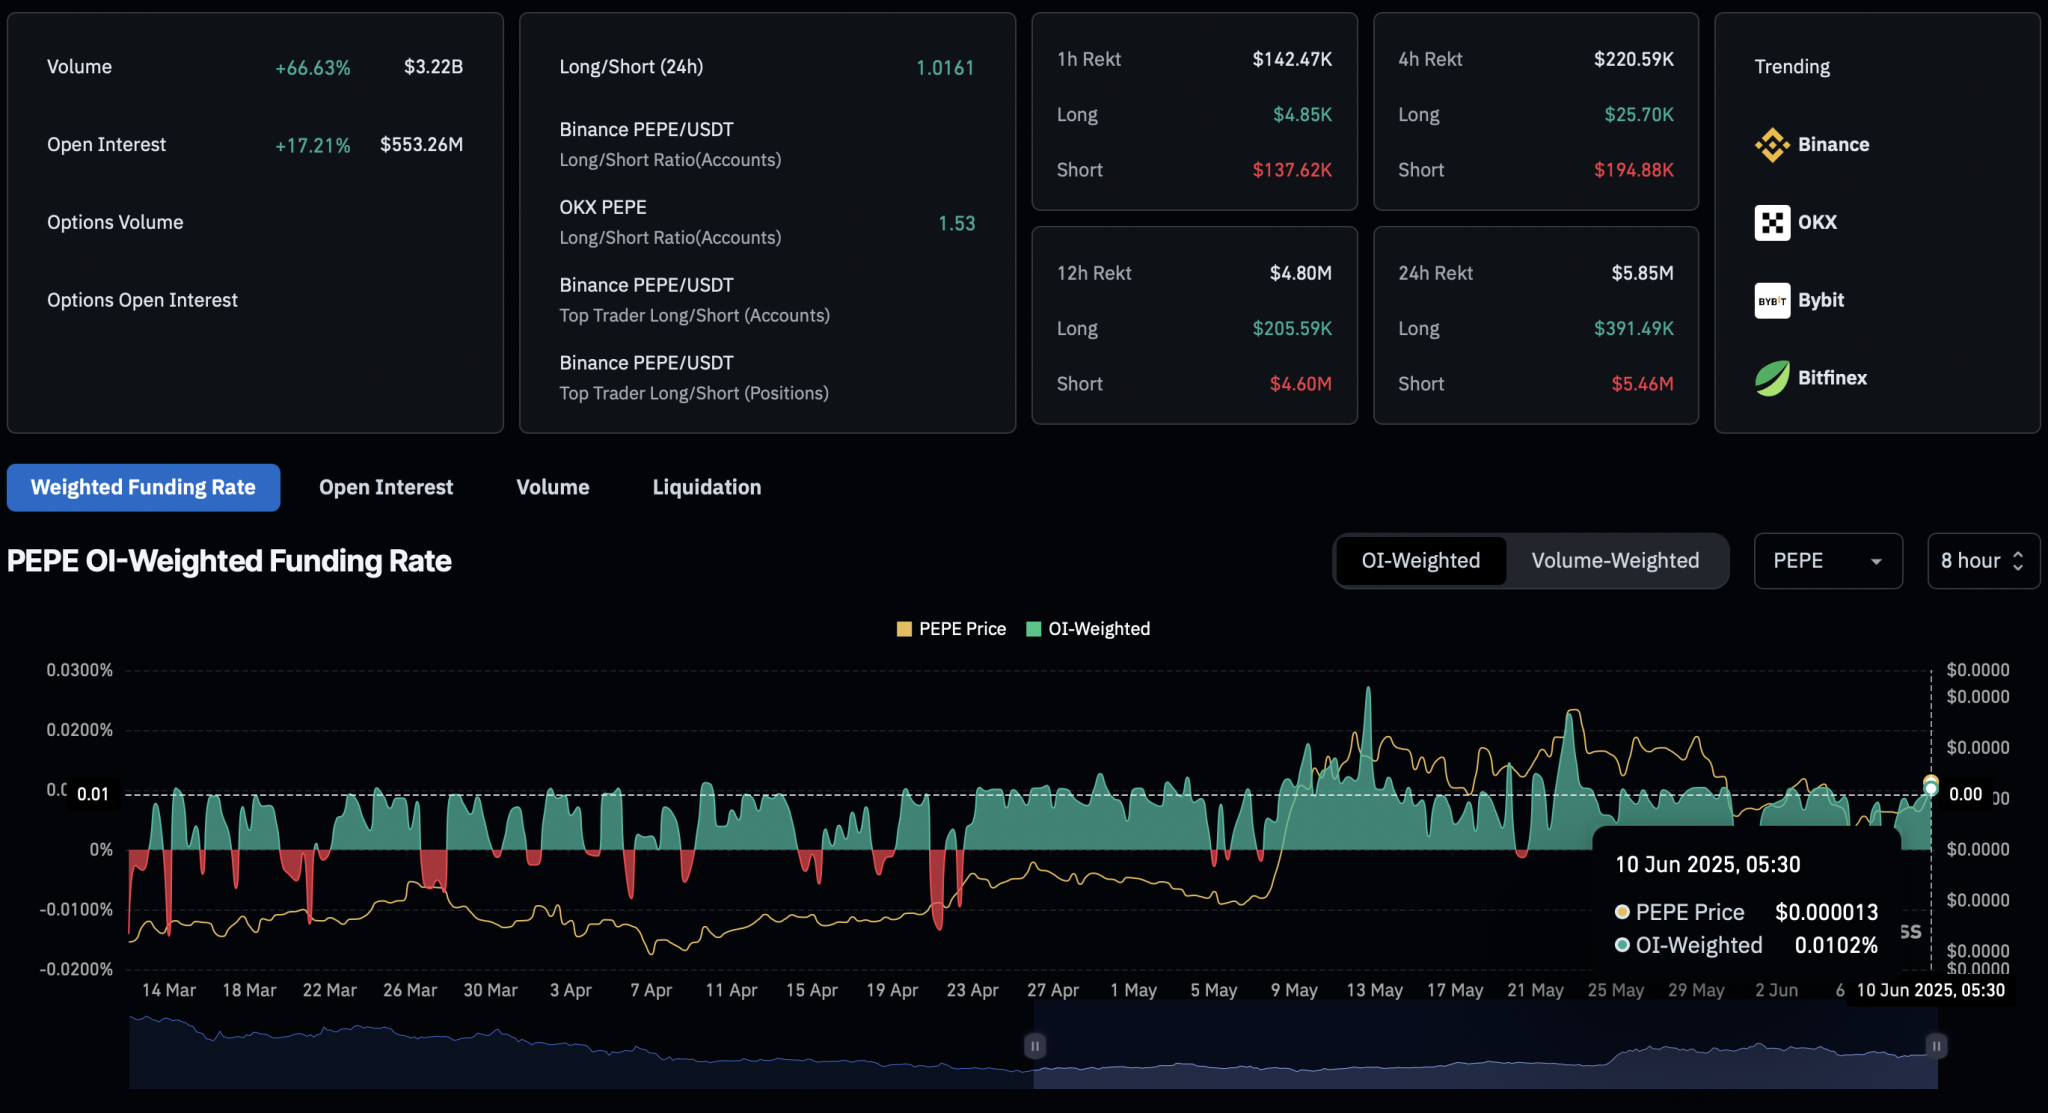
Further confirming the rising confidence in Pepe, Coinglass derivatives data shows an 18% increase in open interest, which has climbed to $556.49 million. This surge indicates heightened trading activity in Pepe derivatives.

PEPE derivatives
PEPE derivatives

The rising funding rate, which has increased to 0.0104%, reinforces the bullish sentiment. This indicates that bulls are willing to pay a premium to bears to maintain price alignment between spot and swap markets.

In the past 24 hours, the long-to-short ratio has risen above 1, suggesting a greater number of long positions compared to shorts.

During the same period, $5.54 million in short liquidations were recorded, signaling a significant wipeout of bearish traders and reinforcing bullish dominance in Pepe derivatives.

Shiba Inu Trapped in Falling Channel Risks Extended Correction

Shiba Inu (SHIB) is struggling to break out of a falling channel pattern after a short-lived rally. Amid bearish pressure from derivatives and profit-taking by long-term holders, will SHIB drop to the key support level at $0.000010?

With a pullback among top meme coins, Shiba Inu continues to face challenges escaping the falling channel pattern. Will SHIB surpass the overhead trendline or fall to the critical $0.000010 support level?

Shiba Inu Price Analysis

Shiba Inu has been exhibiting a falling channel pattern since early May, when it failed to break above $0.000017. After dropping below the 50-day EMA, the meme coin reached a monthly low near $0.000012.

Shiba Inu price chart

Currently, SHIB is trading at $0.00001288, experiencing an intraday pullback of nearly 2%. Despite a 5% price surge on Monday, which hinted at a potential breakout from the falling channel, the intraday pullback signals a possible bearish reversal.

However, the MACD and signal lines are approaching a bullish crossover, indicating potential momentum.

In the event of a breakout rally, the 23.6% Fibonacci level at $0.00001590 is a key price target. Short-term resistance lies at the 100-day EMA at $0.00001418.

Conversely, critical support remains at the lower boundary of the falling channel and the psychological $0.000010 level.

Long-term Investors Book Profits

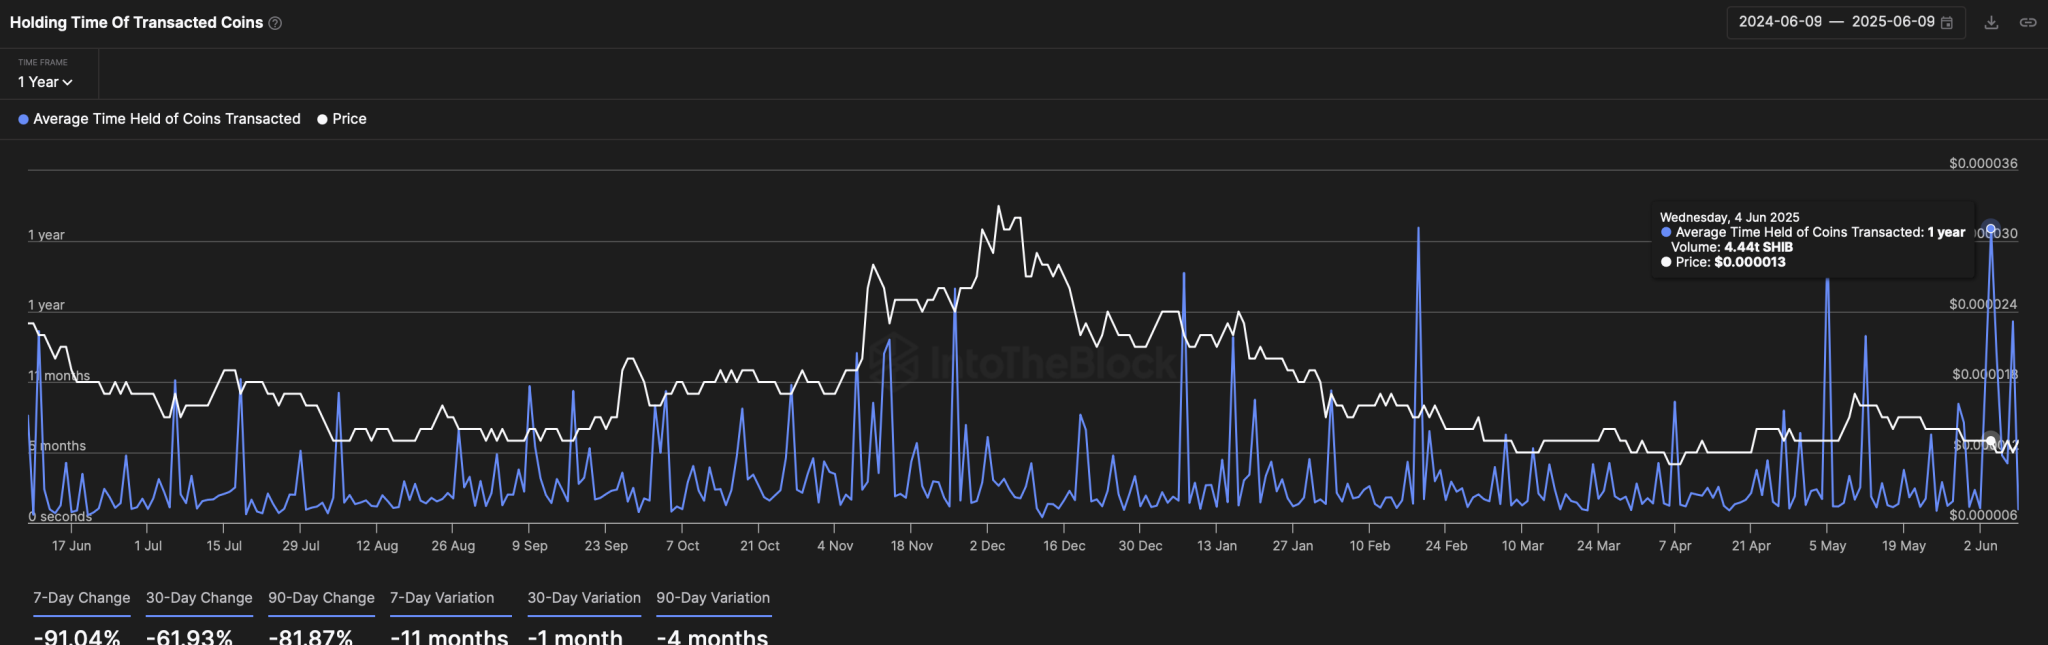
Amid the 6.3% price crash on June 5, Shiba Inu on-chain data reveals significant profit-taking by long-term investors on June 4. According to IntoTheBlock’s Holding Time of Transacted Coins indicator, 4.44 trillion SHIB tokens, with an average holding period of one year, were sold, reflecting sales likely at a profit given the price levels before the crash.

This reflects substantial profit-taking by investors who held Shiba Inu tokens for nearly a year, signaling declining confidence.

Holding Time Of Transacted SHIB Tokens

Derivatives Traders Anticipate Pullback in SHIB

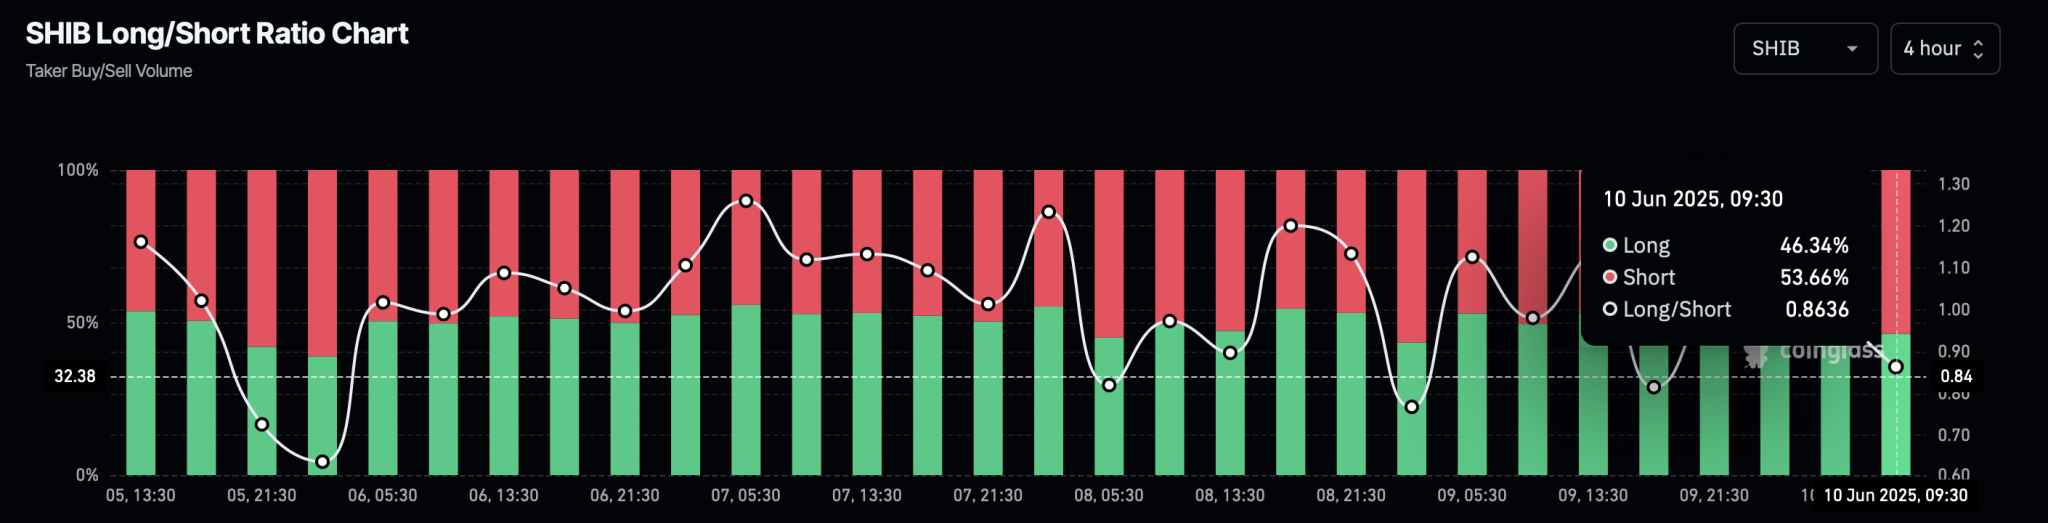
With the intraday pullback, the Coinglass data showcases a surge in bearish pressure in Shiba Inu derivatives. The long-to-short ratio chart indicates that short positions have increased to 53.66% over the past four hours, reducing the long-to-short ratio to 0.8636. 

SHIB Long/Short Ratio Chart

This suggests a greater bearish influence, anticipating a steeper correction in Shiba Inu. 

Dogecoin Outlook for the Upcoming Altcoin Season: Minimum and Ambitious Price Targets Revealed

0

A new Dogecoin forecast leverages Fibonacci extensions to outline potential bullish price targets ahead of the anticipated altcoin season.

As of now, DOGE has recorded a modest 4.88% gain in the past 24 hours, bringing its price to $0.1911. However, the cryptocurrency continues to nurse a weekly loss of 1.58%.

Despite short-term volatility, analysts continue to present long-term projections using technical analysis tools. Notably, a market commentator named “Matters” on X recently shared a chart outlining potential future price movements for Dogecoin.

Minimum and Ambitious Price Targets for DOGE

The analyst utilizes the Fibonacci extension tool to forecast potential price movements for Dogecoin. This weekly chart projects price targets based on past price data from its peak of $0.73. It shows that Dogecoin may follow a bullish trend, as indicated by a green trend line suggesting an upward trajectory.

The chart includes key Fibonacci extension levels that the analyst believes could be potential price targets for DOGE in the upcoming altcoin season. The first is the 1.618 level, representing a price of $1.2750. According to the analyst, this level is the minimum upward target for DOGE.

A more aggressive bull run could push the price to $1.5643, corresponding to the 2 Fibonacci level. The 2.618 Fibonacci extension level further suggests that Dogecoin could reach $2.0324, reflecting a more optimistic scenario for the cryptocurrency’s future.

Image

Potential Short-term Support Zones 

Earlier, on June 8, Matters also utilized Fibonacci retracement levels on a shorter-term chart to pinpoint possible support zones for Dogecoin. These levels are essential for identifying where the price might experience a reversal or find support after a significant movement.

The key retracement levels show potential support areas at various price points. A correction might bring the price down to the 0.786 retracement level of $0.1711. The 0.886 level at $0.1351 indicates a deeper correction, possibly marking a support zone.

Additionally, a yellow line at $0.0899 indicates a more severe price drop, representing a potential bottom for Dogecoin in the case of a prolonged correction. This could be a crucial support level if the market faces a downturn.

Meanwhile, the chart highlights that the $0.4390 level could be a significant resistance level.

Image

Dogecoin Golden Cross

In a separate analysis, trader Tardigrade noted that Dogecoin’s 4-hour chart shows a golden cross, where the 20-period simple moving average (SMA) crosses above the 50-period SMA.

This pattern preceded notable price increases between May 6 and 9. According to Tardigrade, a similar bullish candle formation has appeared, potentially signaling another significant upward movement for DOGE.