Home Blog Page 693

Here Are Shiba Inu Price Predictions for 2026, 2035, and 2050

Multiple sources have presented bullish Shiba Inu price predictions for 2026, 2035, and 2050, with some more ambitious than others.

Notably, Shiba Inu (SHIB) currently trades at around $0.000012, with a market cap of about $7.2 billion. Despite showing strong momentum at the beginning of 2025, the token has struggled to hold its ground. 

So far this year, SHIB has dropped by 42%, weighed down by broader market corrections. Still, many investors and analysts haven’t lost confidence. They believe Shiba Inu can bounce back, especially if its ecosystem keeps growing and demand expands.

However, the extent of this growth remains uncertain. So, to get a clearer view of where SHIB could go in the future, we looked at Shiba Inu price predictions from several sources. These include AI platforms ChatGPT by OpenAI and Google Gemini, as well as crypto forecast sites Changelly and Telegaon. 

ChatGPT and Gemini Predict SHIB Price for 2026, 2035, and 2040

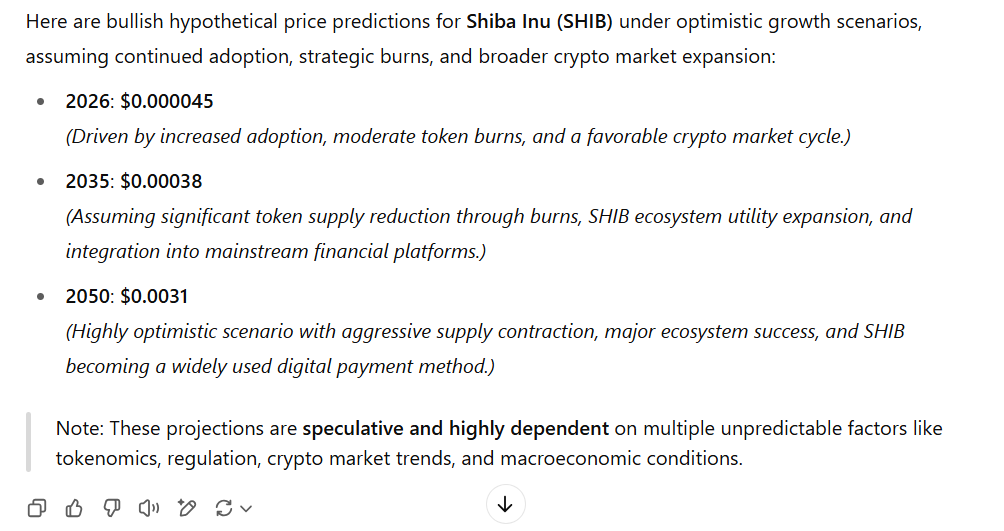
Notably, ChatGPT presented a steady growth path from increasing adoption, regular token burns, and stronger demand in the crypto space. It predicted SHIB could reach $0.000045 by 2026. To hit this target, the token would need to rise 275% from its current price. 
Shiba Inu Price Predictions ChatGPT
Shiba Inu Price Predictions | ChatGPT

By 2035, ChatGPT expects Shiba Inu to climb to $0.00038, which would mark a 3,066% increase. However, looking far ahead to 2050, ChatGPT sees the potential for SHIB to hit $0.0031, a massive 25,733% gain, if the project becomes a widely accepted digital payment option and cuts its supply significantly.

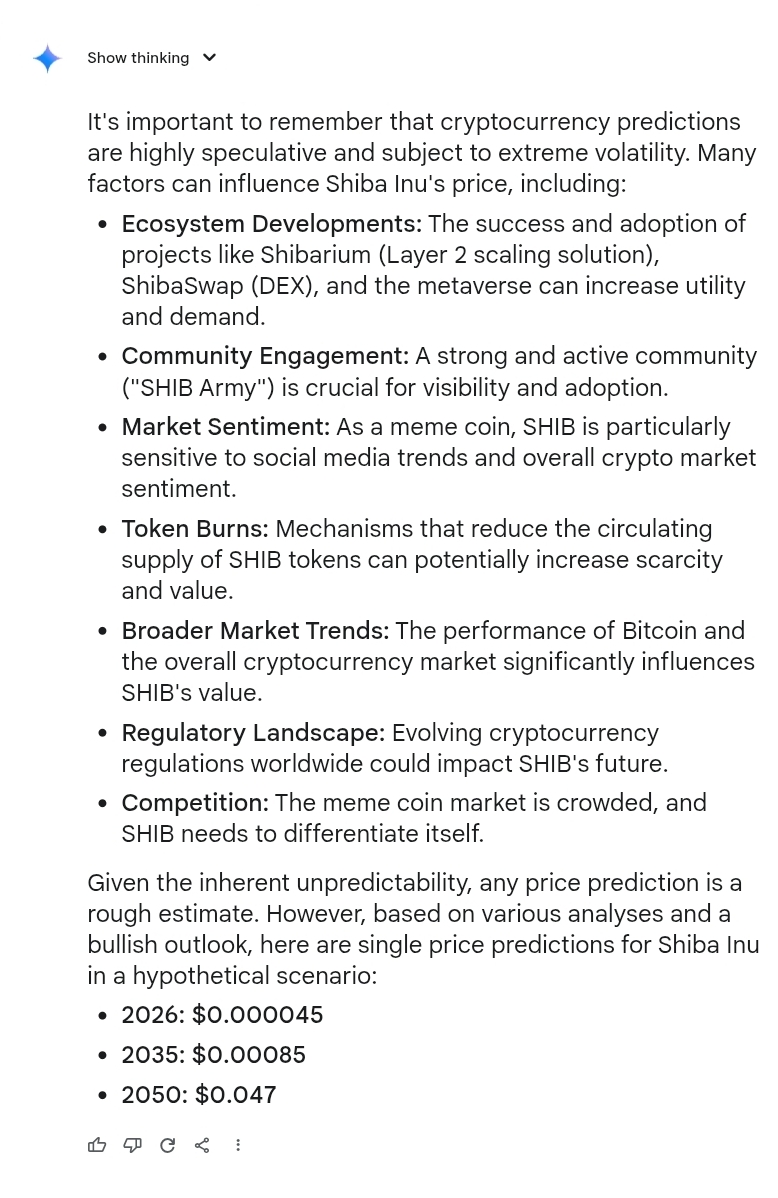
Meanwhile, Google Gemini presented a similar short-term forecast, also predicting SHIB will reach $0.000045 by 2026, matching ChatGPT’s 275% gain estimate. 

However, Gemini takes a more aggressive stance for the longer timeframe. It sees SHIB hitting $0.00085 by 2035, which would require a jump of over 6,983% from where the token stands now. Its most ambitious projection came for 2050, where it sees the price reaching $0.047. To reach that level, SHIB would need to surge by an astonishing 391,566%.
Shiba Inu Price Predictions Google Gemini
Shiba Inu Price Predictions | Google Gemini

Gemini’s Shiba Inu price predictions depend on many moving parts. The success of the SHIB ecosystem, including tools like Shibarium and ShibaSwap, strong community support, smart token-burning strategies, and positive changes in market sentiment and regulation will all determine whether the predictions come true.

Shiba Inu Price Predictions from Changelly and Telegaon 

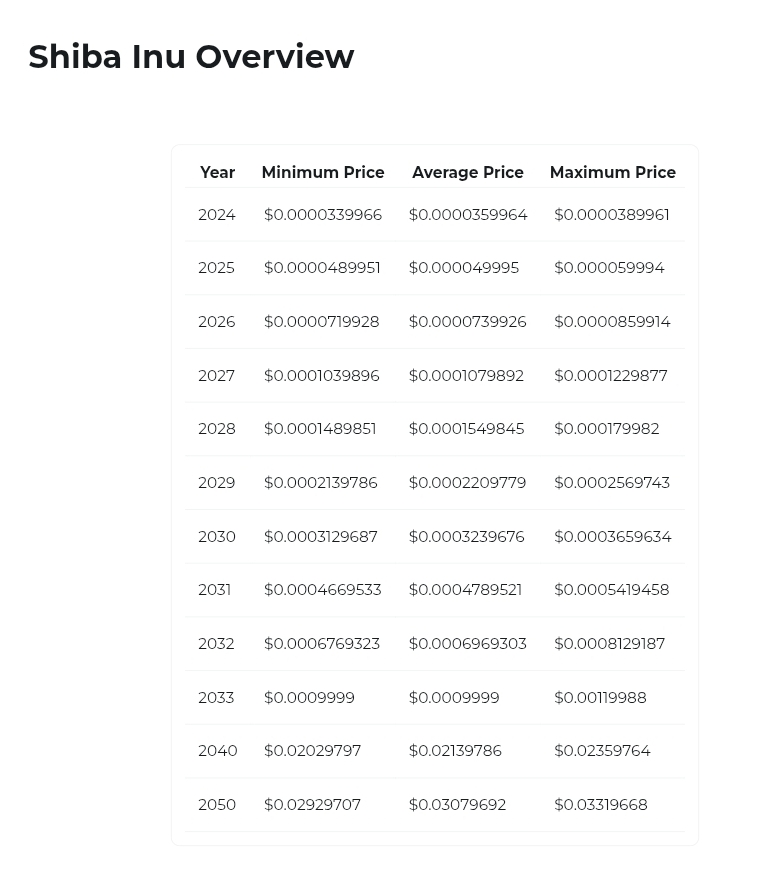
Meanwhile, we also reviewed Shiba Inu price predictions from analysts at Changelly. For 2026, they expect Shiba Inu to rise to a maximum price of $0.00008599. That would be a 616% increase from today’s level. 
Shiba Inu Price Predictions Changelly
Shiba Inu Price Predictions | Changelly

By 2033, they project the price to reach $0.001199, which implies a 9,891% jump. Further, their 2050 estimate sits at $0.0331, which would mean a rise of about 276,483% from SHIB’s current price.

Interestingly, Telegaon gave the most bullish Shiba Inu price predictions. Its analysts believe SHIB could hit $0.0000943 in 2026, a 685% increase. This is already greater than the 2021 all-time high.
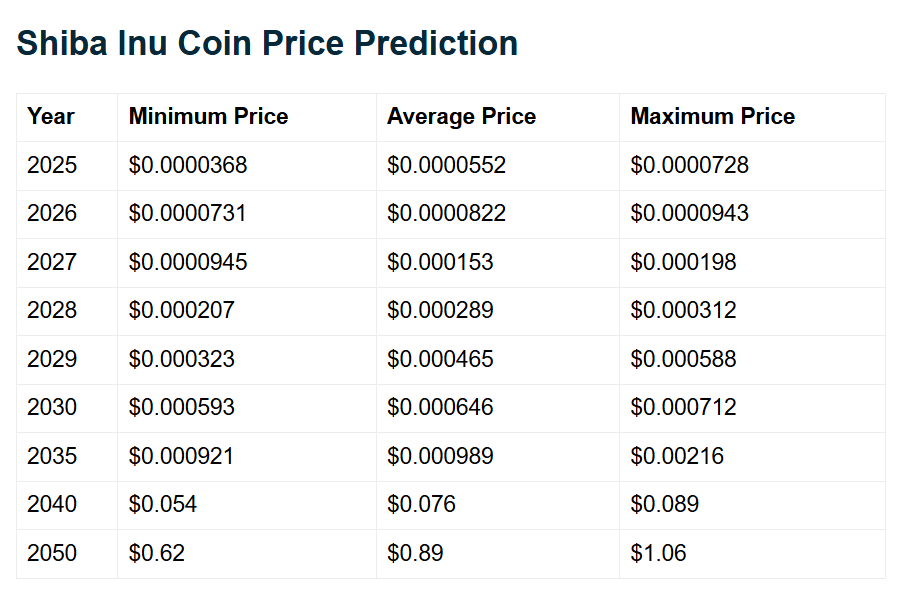
Shiba Inu Price Predictions Telegaon
Shiba Inu Price Predictions | Telegaon

Further, by 2035, they think the token might soar to $0.00216, which would be a gain of more than 17,900%. For 2050, their Shiba Inu price predictions reach an eye-popping $1.06, marking a push to the $1 level. To get there, SHIB would need to rise by over 8,833,233%.

Nonetheless, it is important to note that these Shiba Inu price predictions are mostly speculative. Notably, while the memecoin could witness massive growth, there is no guarantee it would reach these levels by these periods.

Here’s Why Bitcoin Faced a Massive Pullback After Attempting to Break $107K

0

The recent Bitcoin price rejection may have been brought about by massive transactions that happened around June 1. 

For context, Bitcoin has fallen sharply after an attempt to touch the $107,000 mark, facing rejection at $106,700 on June 3.

Interestingly, a recent chart from Santiment reveals a sharp rise in Bitcoin’s transaction volume between May 6 and June 5, 2025, coinciding with this price drop. On June 2, transaction volume spiked to $44.03 billion, marking the highest level since December 2024. 

Image

This surge coincided with Bitcoin’s attempt to break above the $107K threshold. Despite the volume surge, the price quickly retraced, suggesting that the increase in activity did not result in sustained upward movement.

The largest Bitcoin transactions during this period occurred on June 1 and June 2. On June 1, a massive 130,010 BTC transaction worth $14.11 billion was recorded. Following that, two large transactions of 78,647 BTC ($9.41 billion) and 22,531 BTC ($2.36 billion) emerged on June 2. These transactions suggest the involvement of large institutional players.

Large-Scale Transactions Throughout May and June

Beyond the June 1 and June 2 peaks, the data highlights several other notable Bitcoin transactions. On May 29, a transaction of 18,921 BTC was recorded, though its value was smaller compared to the June transfers. 

Additionally, two significant transactions of 16,525 BTC and 16,500 BTC took place on May 13. Another noteworthy transaction occurred on June 2, with 14,000 BTC moved. These large transfers contribute to the overall surge in Bitcoin’s transaction volume during this period.

This trend of significant transactions shows the growing involvement of institutional players or whales in the Bitcoin market, which often signals important price movements. Santiment notes that such large-scale transfers often precede significant changes in market trends.

Increase in Address Activity Amid Price Decline

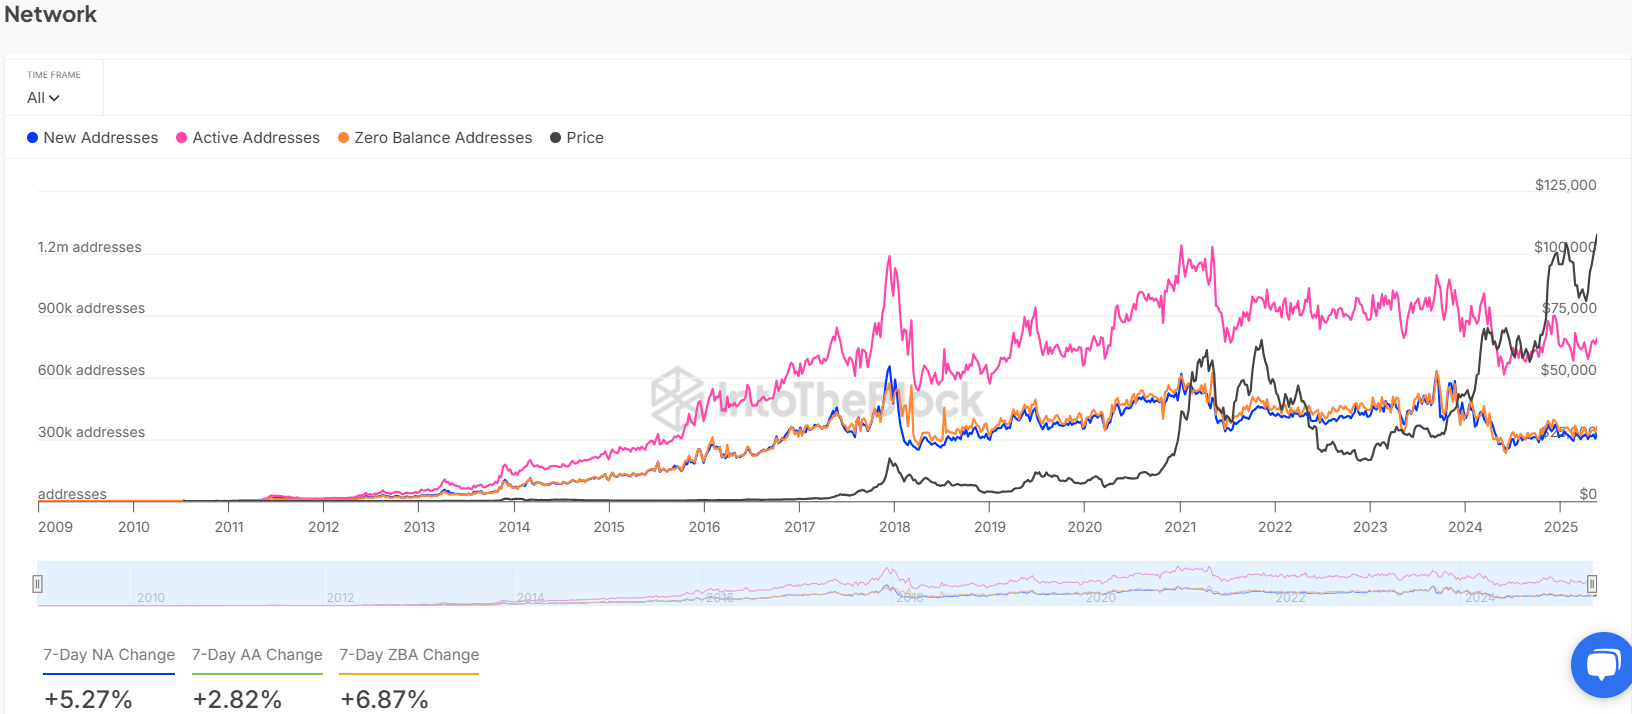
Data also shows there was a surge in address activity in the week when Bitcoin started to fall. IntoTheBlock data reveals that new addresses rose by 5.27%, active addresses grew by 2.82%, and zero-balance addresses surged by 6.87%. 

Screenshot 2025 06 06T112551038
Bitcoin Daily Active Addresses

These figures point to heightened interest in Bitcoin, even as the price began to decline. 

What’s Next for Bitcoin Price?

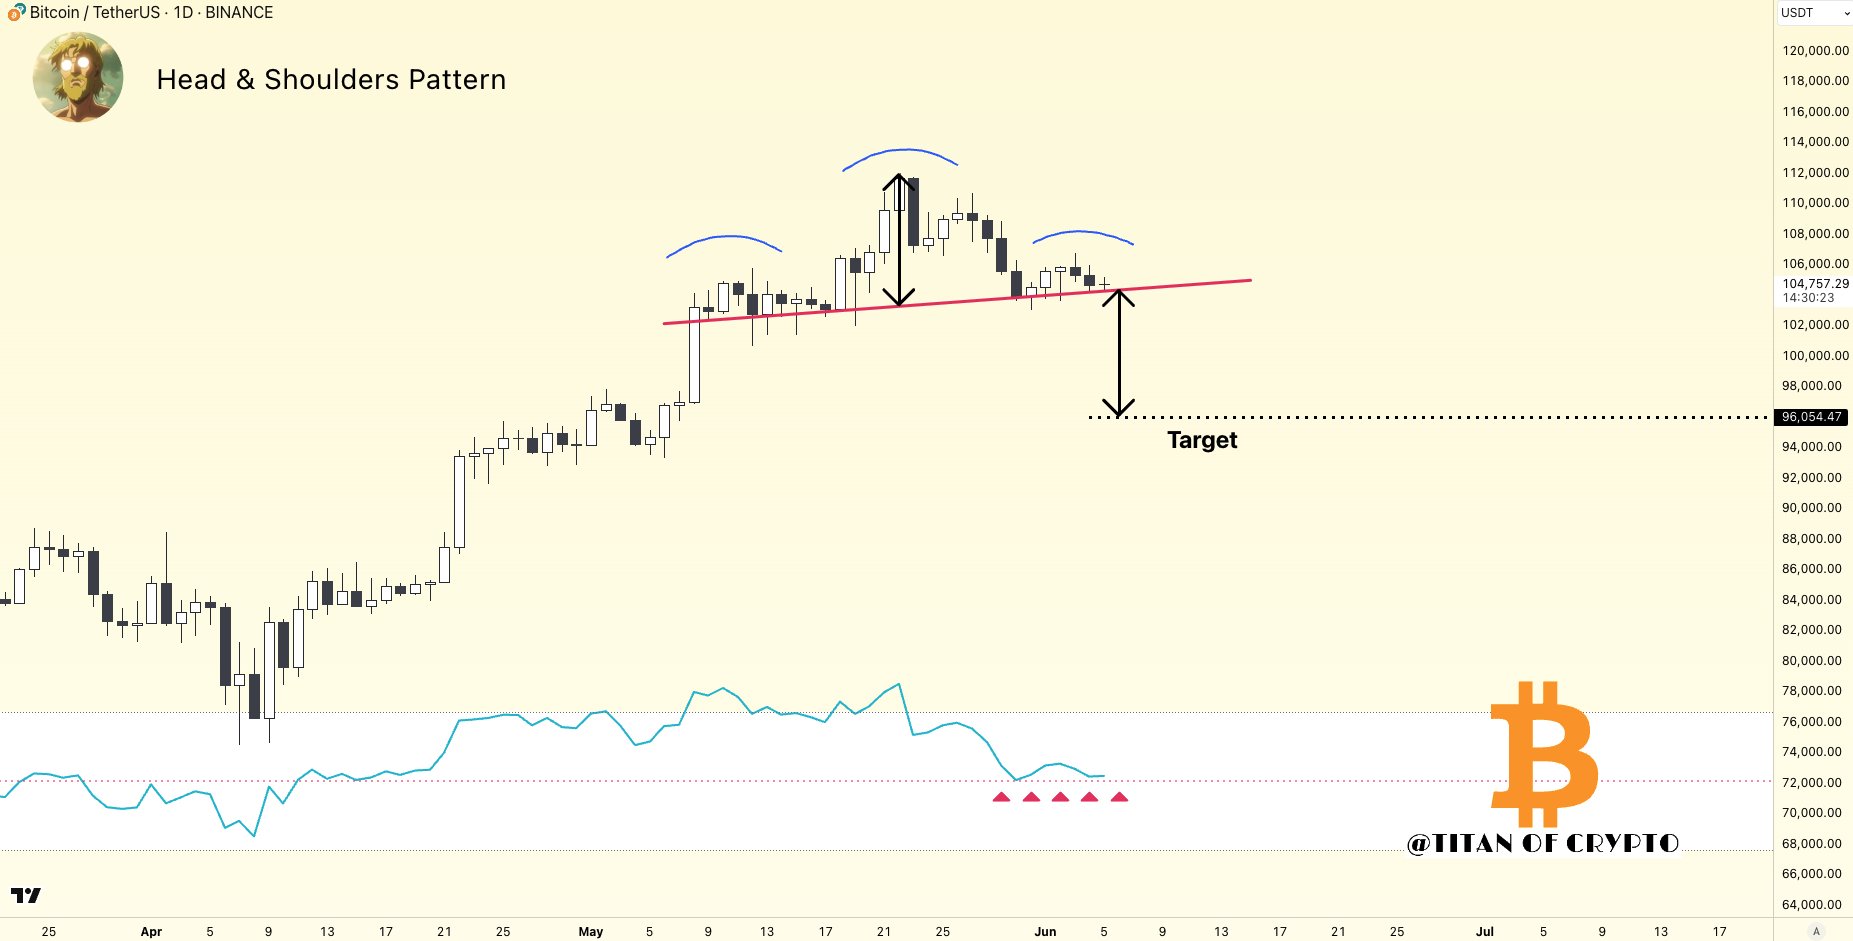
Meanwhile, analysts are also keeping an eye on Bitcoin’s chart patterns. Titan of Crypto, a well-known analyst, pointed out the potential formation of a Head & Shoulders pattern, a classic signal of a reversal in price trends. 

The left shoulder formed in early May, the head appeared when Bitcoin reached its all-time high in late May, and the right shoulder is currently forming in June. If the price falls below the neckline of the pattern, it could indicate a shift from an uptrend to a downtrend, with a potential target price as low as $96,000. 

Bitcoin’s price is currently $103,425, reflecting a 1.21% decline in the last 24 hours and a 1.81% decrease over the past seven days.

XRP Community Members Deem $10 Price Target Unrealistic: Details

0

Most XRP community members do not believe the coin is capable of rising to a realistic target price of $10 in its lifetime. 

The community members expressed this view in a recent X poll conducted by seasoned crypto investor Dennis of Virtual Bacon. 

Final Results 

The poll, which was created recently, asked XRP community members whether $10 is a realistic long-term target for XRP. Respondents were asked to indicate whether they believed XRP could clinch the target by selecting the ‘Yes’ or ‘No’ option. 

The final result showed that about 7,114 XRP community members participated in the poll. Notably, 53% of the total respondents, or 3,770 users, do not think $10 is a realistic long-term target for XRP. 

In contrast, the remaining respondents, representing 3,344 users, believe the $10 price is a realistic target. Nonetheless, the poll result signals skepticism in the XRP community regarding the coin’s potential to soar to a double-digit price, like $10. 

Factors Fueling Doubt 

One user expressed doubt about XRP reaching the target, noting that 100% of its supply was pre-mined, with the coins consistently ‘dumped’ into the market. This commentary refers to Ripple’s continuous release of XRP into the market every month. 

Recall that Ripple locked 55% of XRP’s supply in escrow back in 2017. Since then, the company has been releasing 1 billion XRP from escrow and locking back up to 800 million of the released tokens. This practice adds approximately 200-300 million tokens to the supply each month. 

While XRP’s price usually remains stable during each escrow release, some community members claim the practice has severely battered the coin’s performance over the years. As a result, most users do not see $10 as a realistic target for XRP. 

Analysts Envision XRP Hitting $10 This Year 

For context, hitting the $10 target demands a surge of 371.69% from the current price of $2.12. At this target, XRP’s market cap would skyrocket to around $588 billion, assuming no significant changes occur to the coin’s 58.82 billion circulating supply. 

Although most X users do not consider the $10 target realistic, as reflected in the recent poll, several analysts are still optimistic about the prediction. 

Earlier, popular market commentator “DK64Trades” suggested that XRP would easily surpass the $10 target this year. The expert backed his argument by comparing XRP’s dominance in the current cycle with that of January 2018, when the coin registered an all-time high of $3.84. 

According to the expert, despite XRP soaring to around $3.30 in January 2025, its market dominance remained at 5%. However, in January 2018, when XRP reached an all-time high of $3.84, the coin’s dominance rose to 31.33%. 

Last month, popular Bitcoin enthusiast George Tung predicted that XRP’s price would rally to the $10 mark this year.  

Although the recent poll suggests otherwise, it is worth noting that the poll was created by a Bitcoin proponent who has been a longstanding XRP skeptic. Hence, there is a possibility that some Bitcoin proponents also participated in the poll, which may have impacted the final result.  

“Fire Your Financial Advisor and Buy Bitcoin” Prominent Author Charges Investors, Citing 33,000% Return Since 2015

0

Prominent author Adam Livingston has urged investors to fire their “stupid financial advisor” and buy Bitcoin, citing its exceptional ROI since 2015.

This comes at a time when Bitcoin’s price saw a decline, dropping below $101,000 from last week’s range of $103,000 to $106,000. Despite this short-term decrease, Bitcoin’s long-term growth potential continues to attract the attention of analysts. 

A market watcher is now comparing Bitcoin’s future prospects with traditional assets, offering a broader view on where investors should have directed their capital.

Bitcoin vs. Traditional Assets

Adam Livingston, author of The Bitcoin Age and The Great Harvest, shared an illustrative comparison. He pointed out that a $10,000 investment in the S&P 500 in 2015 would have grown to $31,694 today, yielding a 216% return. In 2015, the S&P 500 traded at an average of $2,000 and has since risen to around $5,900.

In contrast, the same amount invested in Bitcoin at a price of $300–$400 in 2015 would have surged to a staggering $3,326,125 today. Livingston suggests that investors focused on “diversification” have missed out on the true asymmetric gains Bitcoin has offered.

Livingston emphasizes that instead of relying on traditional financial advice, investors should focus on the long-term potential of Bitcoin, urging them to fire their “stupid financial advisor” and buy Bitcoin.

Shifting Views on Bitcoin’s Potential

Other market voices, such as Bitcoin Purple, have echoed Livingston’s sentiments. They contend that “diversification” is a concept used to keep investors from realizing the full wealth-building potential. 

According to Purple, building wealth isn’t about balancing risks in multiple assets but focusing on the high-reward potential that Bitcoin offers. 

A separate individual pointed out that Bitcoin in 2015 was not what it is today, sharing their own journey of discovering Bitcoin in 2016 and initially trading it before realizing its true potential in 2020. 

They speculated that many early holders from 2015 might have forgotten about their investments. In response, Adam Livingston acknowledged that while the circumstances surrounding Bitcoin have evolved, the core value proposition has remained the same. 

Another user asked Livingston for advice on how to steer his brother away from altcoins, to which Livingston sharply advised him to encourage his brother to invest in Bitcoin, which is increasingly attracting institutional wealth. He emphasized that the time for speculative altcoin trading ended in 2017, urging a shift toward Bitcoin for long-term success.

Bitcoin’s Outlook vs. Traditional Investments

Further supporting Bitcoin’s appeal, André Dragosch, the European Head of Research at Bitwise, recently presented a new forecast on the future of various investment assets. Dragosch predicts that Bitcoin will see an annual return of 53.1% over the next decade, far outpacing traditional investments. 

In comparison, gold is projected to yield -3.6% annually, while residential real estate in the U.S. is expected to offer -1.9% returns. The S&P 500, which tracks the broader U.S. stock market, has a more optimistic outlook, with a 3.3% annual return. 

U.S. Treasury bonds, on the other hand, are expected to provide 4.5% annual returns.

Robert Kiyosaki Says It’s Better to Own Bitcoin Than to Save Fake Money

0

Top financial advisor and author Robert Kiyosaki has issued free advice to those who don’t own Bitcoin but prefer saving in fiat currency.

Specifically, the author of the popular investment guide “Rich Dad Poor Dad” did not mince words in a June 6 tweet, calling those yet to buy Bitcoin “losers.” He noted that only losers continue to save in fiat money, which he calls fake, instead of taking the orange pill or investing in gold or silver.

Meanwhile, his comment came as Bitcoin took a dive yesterday. The crypto leader had a long bearish candle wick touch $100,430 on Thursday but has rebounded 2.74% from the low to its current market price.

Don’t Be a Loser: Kiyosaki

Kiyosaki highlighted a common feature among those who stay poor: hesitance in taking an opportunity. The financial guru stressed that those with little financial results usually don’t act when required and later regret it.

He identified phrases like “I would have,” “I could have,” and “I should have” as their mantra and advised against being part of that category of investors. To escape the rat race, Kiyosaki recommended buying Bitcoin, the largest cryptocurrency by market cap.

Remarkably, the author has been vocal about his belief that Bitcoin is the key to financial freedom. Earlier, he had described the premier asset as “the biggest opportunity in history,” disclosing that it was crucial to his wealth amassment.

Today, Kiyosaki took it out on investors who have continually heard his Bitcoin evangelism and remain keen on keeping fiat currencies. The expert reiterated that inflation, among other economic factors, would erode the purchasing power of those “saving fake money” and recommended switching to Bitcoin, an asset widely seen as a store of value and hedge against financial decay.

Notably, Kiyosaki is not alone in this financial sentiment. Venture capitalist Tim Draper asserted that Bitcoin would appreciate infinitely against the US dollar, citing the asset’s admirable qualities and a growing disbelief in fiat currency.

Author Identifies Other Assets to Buy

Meanwhile, Kiyosaki did not recommend just Bitcoin; he also suggested diversifying into gold and silver, the two most valuable precious metals in existence. He stated that he has been recommending these three prominent assets for years, and each has performed exceptionally.

Specifically, he emphasized silver’s room for a twofold rally before the end of the year. The author claimed that silver is a bargain at the current price and predicted a rally to possibly $70 before the year’s end. Remarkably, silver is up 9.65% since Monday, surpassing $36 at the time of writing.

Recall that Kiyosaki also predicted a similar bullish trajectory for Bitcoin, asserting a rally to $200,000 before the end of 2025.

“You are a winner. Please act like one,” Kiyosaki concluded, urging buyers to go buy Bitcoin, gold, or silver now.

At press time, Bitcoin trades for $103,383, up 1.75% since the start of the day.

XRP Price Falls as Elon Musk and Trump Enter Bitter Feud

The public fallout between President Donald Trump and Elon Musk had a negative impact on the broader crypto market, with XRP price crashing 7%. 

The rift revolves around President Trump’s massive tax-cut bill, dubbed the ‘One Big Beautiful Bill Act (OBBBA).’ Despite Trump’s push to rally Congress behind it, Musk has been criticizing the bill and advocating against it. 

However, Musk urged Americans to call their Senators and Congressmen to “KILL THE BILL.” He opined that the bill could plunge the United States into ‘debt slavery.’ During a press conference with German Chancellor Friedrich Merz, Trump expressed disappointment in Musk’s continuous criticism of OBBBA. 

The President revealed that Musk was aware of the bill and initially seemed pleased with it, but changed his stance after he withdrew the EV mandate. In response, Musk denied Trump’s claim, asserting that the bill was quickly passed without him or most members of Congress reading it. 

Furthermore, Musk emphasized that Trump would have lost the election without his support and that the Democratic Party would have held a majority in Congress.

Also, Musk claimed that documents relating to investigations into child sex offender and American financier Jeffrey Epstein have remained sealed to date because Trump’s name appears in them.

Trump threatened to revoke the federal government contracts and subsidies for Musk’s companies. Consequently, the Tesla founder suggested that Trump should be impeached as he touted JD Vance as a potential replacement. 

Why Did Trump and Musk’s Feud Impact the Crypto Market? 

As expected, the epic fallout had a devastating impact on the crypto market, given the duo’s ties to the industry. 

For context, Musk is well-known in the crypto industry for his support of Dogecoin. Besides DOGE, his company, Tesla, also owns 11,509 Bitcoins in the hours leading up to press time. 

Trump, on the other hand, has rolled out several favorable crypto initiatives, including ordering the creation of a crypto reserve. Therefore, a fallout between the pro-crypto advocates impacted the crypto market. 

XRP Price Plunges Amid Trump-Musk Clash

In particular, XRP, which traded at a daily high of $2.23 yesterday, crashed to $2.06, representing an intraday dip of 7.62%. Interestingly, the dip was short-lived, as XRP price experienced an incredible rebound, pushing its price to $2.14, where it currently trades. 

Despite the rebound, XRP remains down 3.24% in the past 24 hours, 3.84% in the seven-day timeframe, and 0.37% over the past month. 

Bitcoin and Ethereum Suffer Dips 

In addition to XRP, other major cryptocurrency assets, like Bitcoin and Ethereum, also experienced price drops. Bitcoin crashed from the $105,900 region to $100,000, marking a decline of 5.57%.  Similarly, Ethereum’s price plummeted to $2,387 from a daily high of $2,640, representing a 9.58% drop. 

Like XRP, both Bitcoin and Ethereum have rebounded from their daily lows, climbing to $102,885 and $2,452, respectively. 

Meanwhile, the broader crypto market also felt the heat of Musk and Trump’s feud, with bulls and bears sustaining losses. 

According to Coinglass data, the total liquidations reached $982.13 million in the past day. Long liquidations—bets on rising Bitcoin and altcoin prices—totaled $881.23 million within this timeframe—similarly, short liquidations—bets on falling crypto prices—incurred $100.9 million in losses. 

Notably, the total liquidations for XRP, Bitcoin, and Ethereum over the past day stood at $23.4 million, $341.68 million, and $286.02 million, respectively. 

Analyst Says Bitcoin Could Drop to $96,000 But RSI Could Save the Day

0

A prominent market analyst suggests Bitcoin could drop further, but RSI’s position may trigger significant price reactions.

Bitcoin’s recent price decline follows a period of strong gains, with its current price sitting at $103,019 amid a 1.42% drop in the past 24 hours. Notably, the intensifying feud between U.S. President Donald Trump and billionaire Elon Musk has contributed to the already existing downtrend.

As Bitcoin cools down, technical analysts and market trends suggest that further downward movement could be ahead. 

Head & Shoulders Pattern Raises Concerns

Notably, Bitcoin’s price action has formed a potential Head & Shoulders pattern, a reversal signal. Analyst Titan of Crypto highlights that Bitcoin is sitting at a critical point on the neckline of the pattern. 

Image

The left shoulder, formed in early May at $104,063, and the head, which reached an all-time high of $111,800 later that month, are already in place. The right shoulder then formed in June, following a local top at $106,700.

This pattern suggests that if Bitcoin breaks below the neckline, it could signal a shift from an uptrend to a downtrend. Titan of Crypto points out that the potential target for this breakdown could be as low as $96,000, representing a further 6.92% drop from the current price of $103,140. 

The analyst also remarks that the RSI is currently holding around 50, a level that often triggers significant reactions. In response to a comment about the rapid shift in market sentiment, Titan of Crypto clarified that his analysis focuses strictly on short-term price action as indicated by the chart, rather than on fluctuating sentiment. 

He emphasized that despite the short-term movements, the overall trend for Bitcoin remains bullish.

Decreased Inflows Signal Short-Term Bearish Pressure

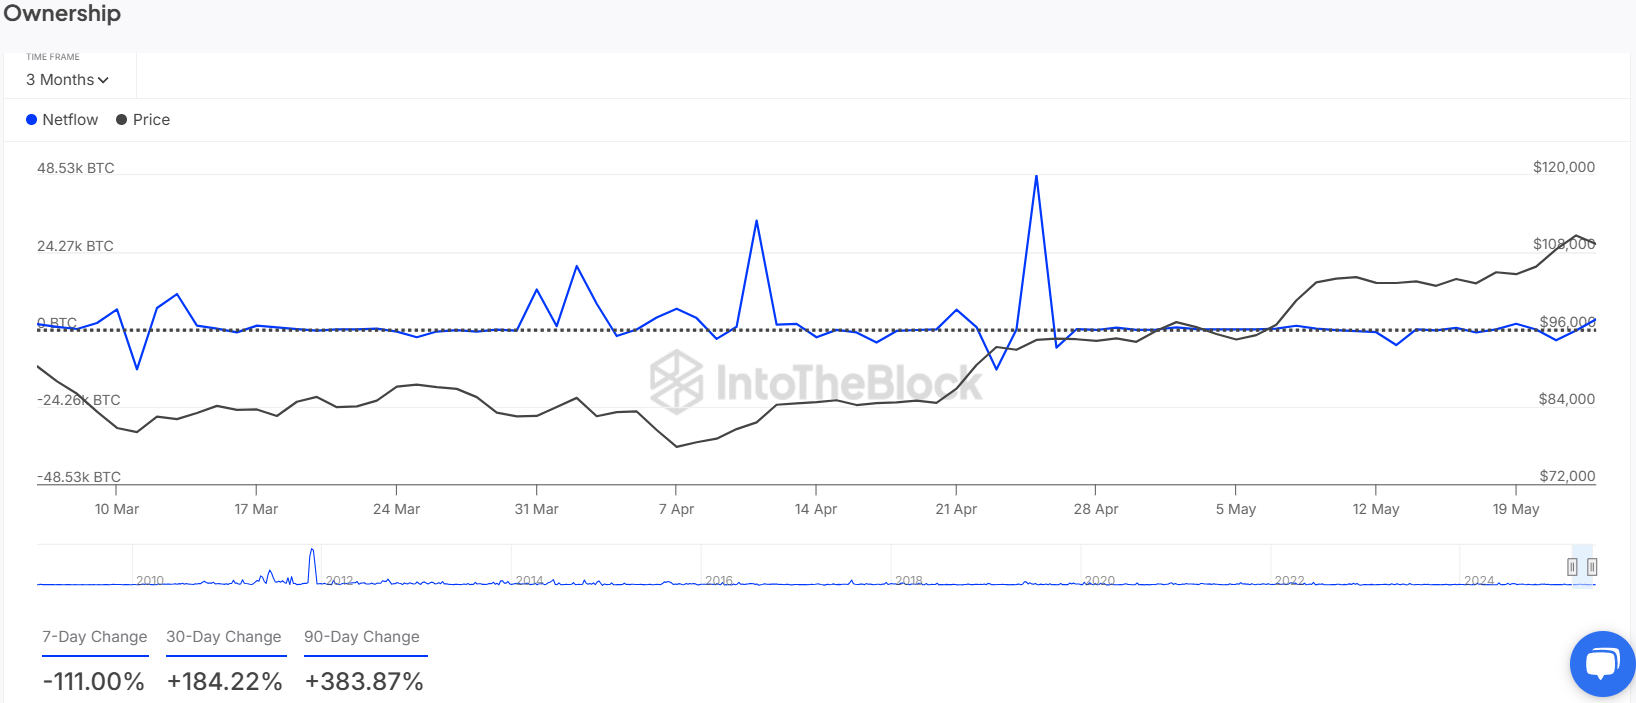
In addition to the Head & Shoulders pattern, large holders netflow shows troubling signs. The 7-day change is a drastic -111%, indicating a significant decrease in inflows. 

Screenshot 2025 06 06T095031058
Bitcoin Large Holders Netflow

This reduction in buying pressure suggests that sellers may be outpacing buyers, contributing to the recent price decline. While Bitcoin’s price has surged over the past month, with 30-day and 90-day changes of +184.22% and +383.87%, the lack of support from large holders raises concerns over the sustainability of the rally.

Rising Volatility and Diminishing Momentum

Meanwhile, heightened volatility and diminishing momentum further suggest that Bitcoin’s rally could be losing steam. 

John Bollinger, the creator of the Bollinger Bands, points out that Bitcoin has frequently touched or surpassed the Upper Bollinger Band, signaling potential exhaustion. 

The “Three Pushes to a High” pattern, characterized by progressively smaller price increases, strengthens the view that Bitcoin’s bullish momentum may be waning.

Within 24 Hours 6,599,476,243,733 Shiba Inu Moved to Coinbase Custody and Binance

0

An influx of trillions of Shiba Inu to the prominent crypto exchanges Coinbase and Binance in the past 24 hours has left tongues wagging among the community.

The much-talked-about transactions have seen unknown wallets shift a total of 6.5 trillion SHIB for two consecutive days. Could they be selling? Here’s what we know.

Whale Wallet Moves Fresh 3.2 Trillion SHIB to Coinbase Prime

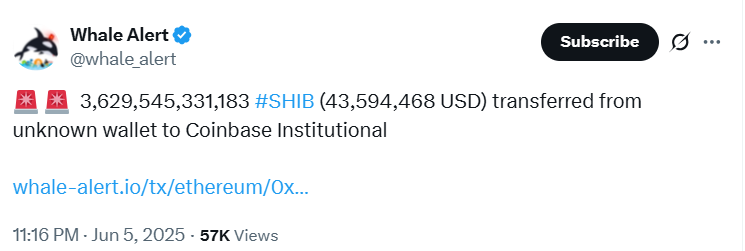
Again, Whale Alert drew the crypto community’s attention to this attention-grabbing transaction. In a tweet on June 5, it identified a 3,629,545,331 SHIB relocation worth a massive $43.6 million to a Coinbase Institutional wallet.

Large Shiba Inu Transaction Whale Alert
Large Shiba Inu Transaction | Whale Alert

Data from Etherscan further detailed the transaction. The massive shift occurred between the sending address “0x2E2A” and the receiving address “0x46E5,” identified as a Coinbase-affiliated wallet, at 22:14 (UTC) on Thursday.

Meanwhile, the two wallets have been in contact with each other recently. Specifically, the exact addresses moved funds among each other in the same direction in the past 24 hours, further drawing attention.

Sell-Off or Just Another Shift? Here’s What We Discovered

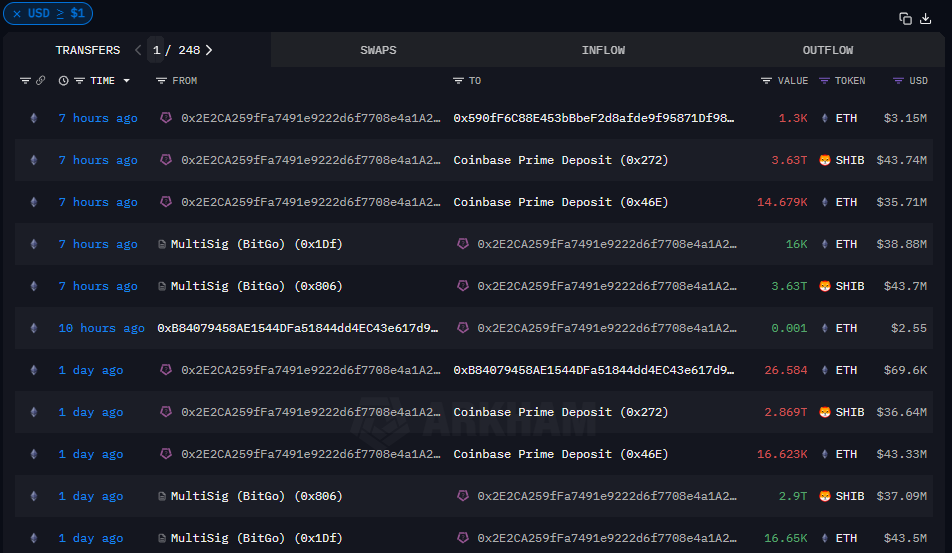
The Crypto Basic reported a 2.8 trillion SHIB ($36 million) shift from “0x2E2A” to Coinbase yesterday. According to the piece, the sending address was not an unknown wallet, as Whale Alert identified, but a wallet tied to a prominent market maker, Wintermute.

Furthermore, as seen in Wednesday’s transaction, a similar situation occurred yesterday. Wintermute received the 3.2 trillion SHIB it shifted to Coinbase from BitGo, a top digital asset custody provider. The platform’s multisignature addresses transferred $43.6 million worth of Shiba Inu, along with 16,000 ETH ($38.8 million).

The Thursday transaction brings the total amount of Shiba Inu and Ethereum sent from Wintermute to Coinbase Prime in the past 24 hours to a staggering 6.5 trillion SHIB ($80.2 million) and 32,650 ETH ($82.38 million). Interestingly, they all came from BitGo.

Shiba Inu Move From Wintermute to Coinbase
Shiba Inu Moves from Wintermute to Coinbase

Meanwhile, transactions like these could be one of the cases where a market maker moves funds from a secure custody provider to an institution-grade crypto exchange for actual market-making or trading purposes. Nonetheless, the reason behind these persistent transfers remains unknown at the time of this press.

Whale Gains $311,000 With Shiba Inu Sales

Another whale was also moving Shiba Inu yesterday, this time to the leading crypto exchange Binance. Market intelligence platform Lookonchain highlighted this transaction in a tweet today.

The post showed that the whale wallet “0x6E45” transferred 100.45 billion SHIB over two transactions to the Binance Deposit wallet late Thursday, adding to the number of the tokens moved to the exchanges.

Interestingly, the whale has been dormant for three years and acquired the stash for less than $900,000 at the time. Yesterday, he sold for a gain of $311,000, which, although substantial, is far below the over $2.7 million he would have earned by selling the stash at Shiba Inu’s peak price of $0.00008845.

Shiba Inu Price Position

It is unclear whether Shiba Inu’s correction yesterday was in response to the skepticism the transaction may have sparked among investors or to the broader market capsize. Nevertheless, the dog-themed meme coin did retrace considerably.

Shiba Inu is down 4.33% in the past 24 hours, trading at $0.00001223 at the time of writing. The continued sideways trend now takes its seven-day and year-to-date retracement to 9.67% and 42.14%, respectively, suggesting a strong streak of underperformance.

Nonetheless, analysts remain confident that a change of form is still feasible. For instance, Whale.Guru predicted that Shiba Inu would be “pumping like crazy” by next week.

Here is the Cardano Price by the End of 2025, According to Deepseek

0

DeepSeek, a prominent AI model, predicts Cardano price could see significant growth before the end of this year, 2025.

In recent days, Cardano has struggled to maintain momentum. As of June 6, ADA’s price stood at $0.639, marking a 5.7% decrease in just 24 hours. From June 1 to June 6, ADA faced consistent downward pressure, hitting a low of $0.62. 

However, this short-term struggle doesn’t appear to reflect a lack of long-term potential. AI-based predictions, in particular, point toward substantial growth for Cardano before the end of the year, despite the current volatility.

AI Model Predict Significant Growth for Cardano

Notably, China’s advanced AI model, DeepSeek, has presented a bold prediction for Cardano price, according to TapTools. 

DeepSeek forecasts that ADA could experience a remarkable 10x increase in value by the end of 2025, potentially reaching $7 per token. This prediction has triggered excitement, especially within the Cardano community, as it suggests that despite recent market challenges, the token may still have significant room for growth.

This forecast represents an ambitious target, as Cardano would need to surge by roughly 1,029% to reach $7. However, TapTools did not present specific reasons behind DeepSeek’s prediction.

Despite this, some market observers expressed skepticism about the validity of AI forecasts, especially considering the level of speculation during the bear market. One critic pointed out that “speculation and hopium” posted repeatedly on social media, particularly on X, could have impacted the quality of AI-driven predictions. 

Despite mixed opinions, some traders are beginning to see potential in the current price dip. One user shared their regret for selling ADA recently but noted that the ongoing drop could present an opportunity to buy at a lower price.

Divergent Price Predictions from Analysts

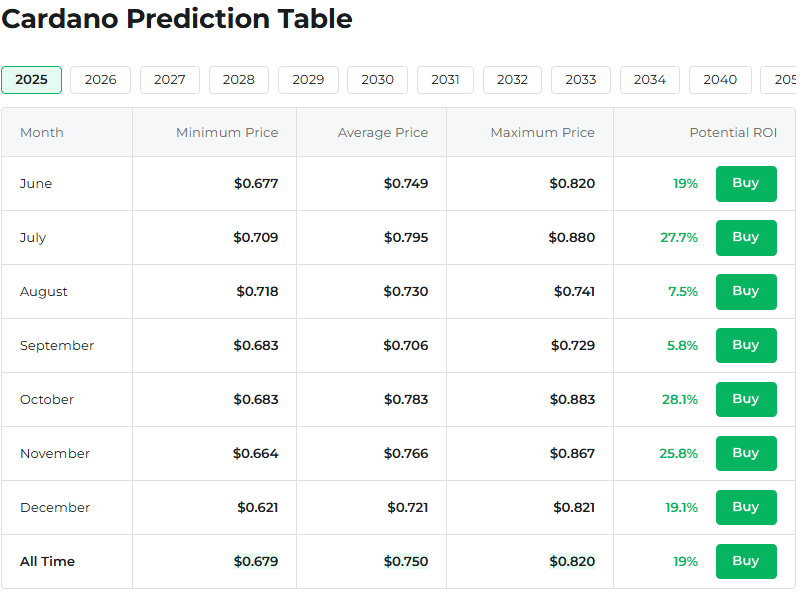
In contrast to DeepSeek’s optimistic forecast, several crypto analytic platforms have provided their own price predictions for Cardano by 2025. For instance, Changelly anticipates ADA will trade between $0.621 and $0.821, with an average of $0.721 this year.

Screenshot 2025 06 06T095822423
Cardano Price Prediction | Changelly

CoinCodex is slightly more bullish, predicting ADA to range from $0.87 to $0.94, with an average price of $0.9. Meanwhile, Investing Haven provides a broader range, from $0.66 to $1.88, with a more optimistic peak target of $2.36.

These varying predictions highlight the uncertainty surrounding Cardano’s future but also suggest that growth potential remains on the horizon.

Cardano Journey to $7

Meanwhile, Egrag Crypto, a crypto analyst on X, previously drew comparisons between Cardano and XRP’s performance during the 2021 bull run. Egrag noted that XRP underperformed during that period, failing to break its all-time high despite the broader market surge. 

He believes Cardano may follow a similar path in the current cycle, underperforming compared to other assets. 

Egrag’s analysis suggests two key takeaways: First, ADA might not be the most profitable coin from its current price point, especially when compared to other mid-cap assets with more room to grow. Second, while a 10x move to $7 is possible, it would require the total cryptocurrency market cap to grow to $10 trillion.

Here’s When XRP Could Finally Break Out of Its Current Consolidation — If It’s Following 2017

Historical data from its 2017 performance shows that XRP might be closer to breaking out of the current consolidation pattern than many believe.

Market analyst Xoom highlighted this positioning in a recent disclosure amid XRP’s underwhelming performance. Despite not appreciating like the rest of the market in early May, the altcoin has collapsed alongside the market since late May, now trading below the pivotal $2.2 support.

This extends a bearish consolidation phase that has lasted for too long, since February, with market participants growing impatient by the day. Comments from analysts such as Ripple Van Wickle have also not helped matters, with the market watcher suggesting this week that XRP’s chart looks “horrible.”

XRP Following 2017 Precedent 

However, Mr. Xoom has found that this consolidation might be close to an end. He highlighted data from XRP’s 2017 historical performance, which closely resembles the current price action, as the inspiration behind this latest suggestion.

Interestingly, data shows that XRP could indeed be following the 2017 fractal. Specifically, after underperforming at the start of that bull run, XRP eventually saw a massive explosion, soaring from $0.00555 in March 2017 to a peak of $0.3988 in May 2017. 

However, the asset faced a roadblock at this peak, leading to a pullback below the $0.3 mark a month later. For the rest of this period, XRP observed a bearish consolidation phase, just like it’s witnessing right now. This bearish consolidation lasted for 210 days before XRP eventually broke out to hit $3.8 in January 2018.

XRP 1W Chart Mr Xoom
XRP 1W Chart | Mr Xoom

Timeline for XRP Breakout

This exact pattern appears to be playing out in the current bull run. Notably, after consolidating at the start of this bull run, XRP’s price eventually skyrocketed in November 2024, leading to a rally from $0.5 to $3.4 in mid-January 2025.

Nonetheless, this $3.4 peak featured massive resistance that resulted in another pullback. Now, XRP has entered into a consolidation phase similar to what it saw in 2017. Highlighting this similarity, Xoom confirmed that XRP is now 190 days into the current consolidation. 

As a result, he expects a breakout in the next two to four weeks. If this plays out, XRP could witness a change in market momentum this month or in early July. However, there is no guarantee this would occur, as current market dynamics could delay or accelerate the timeline this time, especially considering new factors like institutional demand and ETFs.

XRP Liquidity and Upside Targets

However, while he expects a breakout soon, Xoom failed to present any price targets for when this breakout occurs. Interestingly, even before the breakout materializes, Xoom has suggested that XRP must first drop to the $2 mark to scoop up liquidity before it can observe a reasonable pump. 

Meanwhile, market technician Gert van Lagen is already projecting lofty targets for XRP. In a previous analysis, he highlighted a seven-year XRP double-bottom structure. According to him, XRP is currently retesting the breakout from the pattern and could hit $38 once it completes this retest.

Currently, XRP changes hands at $2.13. From this level, XRP would need to drop another 6% to reach Xoom’s $2 support for liquidity. However, it would have to spike 1,800% from the $2 level to claim $38.