Home Blog Page 700

Pepe Eyes $0.000015 as Open Interest Surges 6% to $537M

Pepe jumps 10% as the price reclaims the 50% Fibonacci level. With EMAs hinting at a golden cross and rising derivatives inflows, a breakout toward $0.000015 is possible.

As meme coins gradually gain momentum, Pepe is up nearly 10% over the past 24 hours. With the uptrend strengthening, can Pepe reclaim the $0.000015 psychological level? Let’s find out.

Pepe Price Analysis

On the daily timeframe, Pepe faced resistance at the 61.8% Fibonacci level near $0.00001470 due to strong selling pressure. The decline tested the 200-day EMA, forming a long-tailed doji candle at $0.00001107 on Saturday, May 31.

Since then, the memecoin has reversed its course, forming four consecutive bullish candles and reclaiming the 50% Fibonacci level at $0.00001227. With this short-term recovery, Pepe is attempting to regain a key support level amid increasing momentum.

Additionally, this recovery supports the formation of a golden cross between the 50-day and 200-day EMA lines, while the rising 100-day and 200-day EMAs hint at a potential bullish crossover.

Pepe Price Chart
Pepe Price Chart

Despite these bullish signals, the daily RSI line, currently at 51, shows a downward trend as it hovers near the midline. However, with Pepe maintaining a position above the 50% Fibonacci level, the RSI could soon rise above the midpoint, signaling growing bullish strength.

According to the Fibonacci retracement levels, immediate resistance for Pepe lies at $0.00001470, followed by the 78.6% Fibonacci level at $0.00001903. On the downside, key support remains at the 200-day EMA ($0.00001107), followed by the psychological level at $0.000010.

Optimism Builds in Pepe Derivatives

Over the past 24 hours, optimism in the Pepe derivatives market has increased significantly. Open interest (OI) is up 6.47% to $537.96 million. Additionally, the OI-weighted funding rate has turned positive, currently at 0.0095%.

PEPE
PEPE

This derivatives data indicates growing bullish sentiment, supported by a spike in short liquidations, which suggests bearish traders are being squeezed out.

In the last 24 hours, short liquidations totaled $2.33 million, while long liquidations were limited to $719.44k.

The long-to-short ratio of 1.0165 points to a greater number of long positions, according to CoinGlass data.  This supports the likelihood of an extended rally for Pepe.

Shiba Inu Eyes Bullish Reversal as Burn Rate and Short Liquidation Spike

Shiba Inu shows signs of recovery after a 140% spike in its burn rate and rising open interest, targeting a move to $0.0000139.

With the market cap of meme coins rising to $60.71 billion, Shiba Inu is capitalizing on the sudden tailwinds. It is teasing an extended rally amid increasing burn rate and growing optimism in the derivatives market.

Shiba Inu Price Analysis

On the daily chart, Shiba Inu reflects a bullish failure to sustain the inverted head-and-shoulders breakout rally. Despite breaking out above the neckline at the 23.60% Fibonacci level of $0.00001390, Shiba Inu failed to hold above the 200-day EMA line and the critical $0.000017 resistance level.

BINANCE:SHIBUSDT Chart Image by Trojan69420

After a decline over the past three weeks, Shiba Inu is down nearly 18%. Currently, it trades at $0.00001319, showing a minor recovery over the past three days.

Notably, Shiba Inu finds local support near the $0.00001252 level, corresponding to the bottom support of the previous right-shoulder formation. As Shiba Inu bounces off this critical support, the RSI signals a hidden bullish divergence. This increases the possibility of a rebound targeting the 23.60% Fibonacci level at $0.00001390.

Despite this short-term optimism, the longer-term downtrend persists in the 50-, 100-, and 200-day EMA lines. The immediate dynamic resistance is the 50-day EMA at $0.00001391, which aligns with the previously broken neckline.

However, a failure to break above this resistance could lead to a retest of the $0.00001252 support or a steeper correction toward $0.00001066.

SHIB Burning Count Grows

Over the past 24 hours, the SHIB burn rate has increased nearly 140%, with 39.49 million Shiba Inu tokens burned. Burning activity has become more regularized, with 1.57 million SHIB tokens burned on Monday alone. To date, approximately 410 trillion SHIB tokens have been burned from the initial supply.

Derivatives Market Turns Hopeful on Shiba Inu

With the short-term recovery underway, optimism in the derivatives market has significantly increased for Shiba Inu.

Specifically, CoinGlass data shows open interest rising by 2.69% to $162.97 million. Meanwhile, the funding rate surged to 0.0088%, reflecting heightened trading activity with a bullish bias.

SHIB Derivatives
SHIB Derivatives

Furthermore, over the past 24 hours, short liquidations ($71.15K) have outpaced long liquidations ($15.59K), signaling a larger wipeout of bearish traders. Consequently, the derivatives data reflect bullish optimism in the market, anticipating a bullish reversal for Shiba Inu.

SUI Struggles Below $3.45: Is a Drop to $3 Inevitable?

SUI faces strong rejection near $3.45 as bearish signals accumulate on the charts. Derivatives data shows indecision, while network TVL and stablecoin market cap rise.

SUI is up almost 2% today, trading at $3.30. However, facing crucial resistance, the prevailing downtrend hints at a prolonged correction back to the $3 psychological level.

SUI Price Analysis

On the 4-hour price chart, SUI shows a bullish failure to overcome the $4.20 resistance level, resulting in an ongoing correction phase. With lower high formations, SUI also forms a local resistance trendline. Last week, SUI bottomed out at the $3.03 support level before re-challenging the local resistance trendline.

SUI Price Chart
SUI Price Chart

However, the bullish action faces additional opposition from the support-turned resistance zone, extending from $3.33 to $3.44 alongside the 50-period EMA at $3.41. With multiple bearish elements filing against the bullish recovery, SUI is likely to take a bearish turnaround. 

Supporting the downside chances of 100- and 200-period EMAs closing towards a negative crossover. Meanwhile, the 4-hour RSI line struggles to resurface above the halfway level. 

As per the price action analysis, the downfall is likely to test the $3.03 crucial support level. However, a potential 4-hour closing below the support line could test the 50% Fibonacci level at $2.71. 

On the flip side, a potential crossing above the 23.60% Fibonacci level at $3.45 will reinstate a bullish trend for SUI. This could result in a price surge to $4.20 resistance level.

SUI Derivatives Reveal Traders Waiting on the Sidelines

As SUI stands at a crucial crossroads, the derivatives data reflects a minor increase in bullish sentiment. Open interest has surged by 1.72% to reach $1.43 billion, reflecting increased inflow in the SUI derivatives. 

Screenshot 2025 06 03 at 121408

The 24-hour liquidations show an indecisive trend, with long and short positions nearly balanced at $769K and $749K, respectively.

Hence, derivatives data suggest traders are waiting for SUI to establish a decisive trend before committing.

SUI TVL Recovery Signals Network Growth

According to DeFiLlama, the SUI network’s total value locked (TVL) surged to $1.75 billion after the recent Cetus hack dropped it to $1.57 billion.

Furthermore, the stablecoin market cap on the SUI network has jumped over 8% in the past seven days, reaching $1.10 billion, signaling increased liquidity. Overall, the SUI network maintains a slow but steady growth trend.

Top Analyst Compares Buying Bitcoin in 2025 to Apple Stock in 1995: Details

0

An expert likens buying Bitcoin in 2025 to investing in Apple stock in 1995, a move that later turned into one of the most successful investments in modern history.

Currently trading at $105,000, Bitcoin has dipped 0.33% in the past 24 hours and 3.97% over the past week. While short-term price action has cooled, attention is shifting toward longer-term growth narratives and emerging chart patterns.

The Apple Analogy: A Forrest Gump Flashback

On X, Cedric Youngelman, host of the philosophical podcast Bitcoin Matrix, drew parallels between Bitcoin in 2025 and Apple stock in 1995. He referenced the famous scene from the 1994 film Forrest Gump to back his point.

For context, Forrest Gump includes a fictional plot point where Forrest credits part of his wealth to an early investment in “some kind of fruit company”—Apple Inc.—well before it became a tech giant. Though dramatized for storytelling, the scene illustrates how a small, early investment can yield massive returns over time.

The implication is that by 1995, many might have believed the biggest gains from Apple were already in the past. Yet, over the next 30 years, those who invested even at that point went on to see extraordinary returns, demonstrating that what feels ‘late’ in the moment can still be remarkably early in the long run.

Bitcoin in 2025 is Not Late

Youngelman used this analogy to suggest that buying Bitcoin at $105,000 in 2025 might feel late, but could actually be early, much like buying Apple stock in 1995.

At that time, Apple was still a struggling company, and few foresaw its exponential rise. A $1,000 investment in Apple shares in 1995 would be worth approximately $63 million today, assuming a compounded annual growth rate of 31.99%.

If Bitcoin were to follow a similar trajectory over the next 30 years, a $1,000 investment today could potentially yield a comparable return by 2055, underscoring the idea that long-term growth may still lie ahead.

In response to the comparison, users on X offered varying perspectives. Some described personal conviction in long-term holding, citing purchases dating back to 2013.

Another user projected that Bitcoin could rise to $13 million within two decades, adding that up to 66% of the existing supply may never return to market due to holders’ unwillingness to trade for fiat currency.

BTC Short-Term Price Action and Key Levels

While the long-term narrative around Bitcoin remains compelling, recent technical patterns offer insight into its near-term behavior.

Chart analyst Moustache on X identified a repeating “ascending broadening wedge” pattern on the four-hour BTC/USDT chart from OKX.

This pattern first emerged in late April with resistance levels near $94,500 to $97,900 and support between $91,800 and $93,800. After consolidating, Bitcoin broke above $104,000 in early May, then formed a second similar wedge in mid-May at higher levels. Bitcoin reached an all-time high of $111,980 on May 21 before pulling back.

Since then, Bitcoin has trended downward toward key support zones. Moustache highlights $102,000 as a critical potential entry point, with $97,000 as a vital support level that must hold to sustain the bullish outlook. If this pattern holds, Bitcoin could be poised to break above $125,000 in the near term.

Bitwise Report Shows Public Firms and Funds Led Bitcoin Demand as Individuals Sold in 2025

0

Institutional investors have dominated Bitcoin demand in 2025, acquiring large amounts of BTC year-to-date, according to Bitwise data released this month. 

The report comes at a time when Bitcoin has hit its highest price ever at $111,800 and already pulled back to trade around $105,260.

This trend signals a major shift in market dynamics, as individual investors have moved in the opposite direction. The Bitwise chart titled “Year-to-Date Change in Bitcoin Holdings (2025)” shows how various market participants have contributed to net Bitcoin holdings since the beginning of the year. 

GsfScqfWsAAVo1e


The data shows a divergence between institutional accumulation and retail distribution.

Public Companies and Funds Lead Institutional Accumulation

Specifically, public companies have emerged as the single largest buyers, increasing their net Bitcoin holdings by 218,000 BTC. This rise suggests strong adoption of Bitcoin as part of corporate treasury strategies or strategic reserves.

Following closely, funds and exchange-traded products (ETPs) accumulated 199,000 BTC, pointing to substantial inflows into regulated investment vehicles. Collectively, these two institutional segments accounted for the entire 417,000 BTC net gain among large-scale investors, confirming their role as the primary market drivers so far in 2025.

Meanwhile, DeFi platforms also contributed positively with a net increase of 81,000 BTC. Governments, though more modest in comparison, added 14,000 BTC, which may stem from seizures, experimental holdings, or early reserve strategies.

Retail Investors and Private Firms Contribute to Selling Pressure

In contrast, individual investors have become the largest net sellers, reducing their holdings by 158,000 BTC. This activity may reflect profit-taking behavior or shifting sentiment amid market volatility.

Alongside this trend, private companies offloaded 123,000 BTC, likely due to capital reallocation or liquidity needs. In addition, 69,000 BTC entered circulation as newly mined supply, representing typical post-halving miner behavior.

Notably, mining pools showed minimal net change, with just a 1,000 BTC increase, implying that most newly mined coins are either held or sold quickly. This aligns with historical post-halving patterns.

Long-Term Holders Maintain Accumulation Despite Price Levels

To support this institutional accumulation narrative, analysts reported a significant rise in long-term Bitcoin holder (LTH) supply from March to late May 2025. Between March 3 and May 25, LTH supply increased from 14.35 million BTC to 15.73 million BTC, marking a net accumulation of over 1.39 million BTC within 12 weeks.

This accumulation has diverged from previous bull market cycles in 2013, 2017, and 2021, where LTH supply declined during price rallies. Even with brief dips in May 2024 and March 2025, the broader trend has remained upward. Analysts noted that experienced participants appear unwilling to sell at current prices, suggesting reduced availability for new entrants moving forward.

Meanwhile, Michael Saylor, executive chairman of Strategy, reiterated institutional confidence in Bitcoin. Speaking at the 2025 Bitcoin Conference in Las Vegas, Saylor described the asset as a long-term reserve for balance sheets. He emphasized that while most products fail over five years, Bitcoin has shown a high probability of success over similar timeframes.

Ethereum is Going to $5,000+ This Year: Top Pundit Says It is Very Simple

0

A top crypto YouTube and X outlet has expressed confidence that Ethereum will rebound from its recent underperformance and rally to unprecedented prices.

Specifically, Altcoin Daily shared in an X post that Ethereum, the second-largest cryptocurrency by market cap, would easily surpass its 2021 peak price and current all-time high to new levels before the end of this year.

The June 2 tweet followed Ethereum’s recent sluggish price action. After raising optimism among enthusiasts and the broader crypto community with a 38% surge within three days in early May, the altcoin leader has since ranged.

It also swelled to a two-month high of nearly $2,800 in late May but has since retraced, with strong resistance in the region impeding further upward thrust. Nonetheless, Altcoin Daily remains resolute that Ethereum will soon fend off all supply zones, even reaching those around its all-time high of $4,867.

Ethereum Simply Going Above $5,000

Altcoin Daily, the prominent YouTube and X page managed by two brothers, Aaron and Austin Arnold, shares a bullish disposition towards Ethereum. While many complain about the altcoin king’s underperformance compared to Bitcoin, the top pundits have insisted that Ethereum will repel the bearish trend before the end of the year.

For perspective, Bitcoin is up 12.40% year-to-date, but Ethereum is down 22% in the same timeframe. While Ethereum showed strength against the premier crypto asset in May with a 26.8% rally, the ETH/BTC chart remains down 30% since the start of the year at 0.0248.

Nonetheless, yesterday’s analysis suggests Ethereum could rebound, not necessarily to the detriment of Bitcoin, but against its dollar valuation. Specifically, Altcoin Daily predicted a minimum price of $5,000 by the end of 2025, calling it “actually very simple.”

Notably, the rally to $5,000+ would see Ethereum rally past its current all-time high. Based on the current price, this would result in a 91.8% growth.

Influential Figure Insists on $10,000

While market watchers see $5,000 as bullish, others believe Ethereum has more to offer. According to crypto influencer Ash Crypto, the second-largest cryptocurrency by market cap would double Altcoin Daily’s $5,000 prediction to $10,000.

An accompanying chart supporting his claims suggests Ethereum is mirroring its 2016/2017 price action. The 1W chart highlighted that the asset stalled at a resistance level similar to where it currently is after its early 2016 rally, dipping to $6.40.

Ethereum’s Current Price Action Compared With 2016/2017 per Ash Crypto

After consolidating at the resistance level around $15 for months, Ethereum broke out in March 2017, rallying over 2,700% to a high of $420 in June 2017. Ash Crypto noted that Ethereum is following a similar price action, with the resistance at $4,100 proving too strong for the asset in two attempts in March and December 2024.

Following a similar dip to April’s low of $1,383, Ether has rebounded, with the supply zone its next target. The analyst predicted that it would defy the resistance and target a 283% uptick to $10,000 next.

Moreover, strong investor traction and the adoption of Ethereum Treasuries by large firms further add to the bullish momentum. Ethereum co-founder Vitalik Buterin recently revealed plans to scale Ethereum’s layer 1 network tenfold by 2026, another confidence booster and potential price catalyst.

Ethereum trades at $2,606 at the time of writing.

Here’s XRP Price if It Handles 100% of Expected Annual Cross-border Volume of $300T by 2030

A recent analysis shows that XRP price could see a significant uptick if it dominates the cross-border payments sector by 2030.

Ripple is setting its sights on the global payments industry. In a previous video presentation, Pegah Soltani, who leads payments product at Ripple, shared the company’s outlook on the future of cross-border payments. 

Ripple Seeks to Dominate the Cross-Border Sector 

She pointed out that trillions of dollars already move between countries every year. However, by 2030, that number could climb to $300 trillion.

Nonetheless, even with that kind of growth, Soltani noted that cross-border transactions today still face major problems. Specifically, they’re often slow, expensive, and prone to errors. Ripple wants to fix that by using blockchain and digital assets to make global payments faster and cheaper for businesses and their customers.

She walked through a typical instance. In particular, imagine a company in the UK that wants to send money to the Philippines. They start by asking for an exchange rate quote. Once they approve it, they send the payment. Importantly, XRP acts as a bridge between currencies. 

Ripple’s payment service converts the funds into Philippine pesos, and the recipient gets the exact amount, instantly. Soltani also explained that Ripple’s system lets businesses expand into new markets quickly, and payments settle in seconds, not days.

The prospect of XRP Dominating the Cross-Border Scene

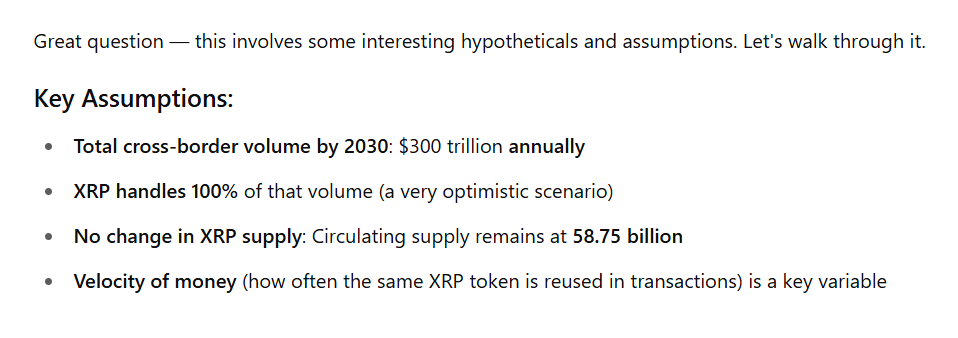
The Crypto Basic sought to ascertain what this kind of growth could mean for XRP’s price, so we asked ChatGPT a hypothetical question: what if XRP handled all $300 trillion in annual cross-border payments by 2030? What kind of price could that lead to?

ChatGPT admitted that this is a highly optimistic scenario but first made a few important assumptions. Notably, in this scenario, XRP would have to process 100% of that $300 trillion volume, an incredibly tall feat. 

Key Assumptions by ChatGPT

Second, its circulating supply would stay fixed at 58.75 billion tokens. Third, the outcome would depend heavily on how often each XRP token gets reused in transactions, a concept analysts call the “velocity of money.”

XRP Price if It Handles 100% of Projected $300T Volume by 2030

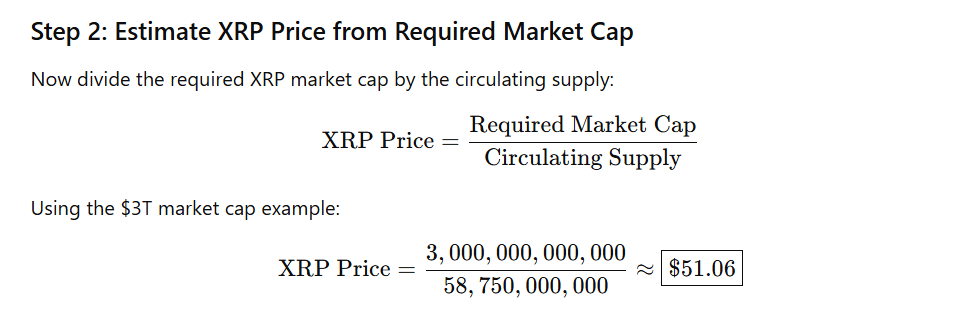
Essentially, to estimate XRP’s potential value, ChatGPT first looked at how much XRP would be necessary to process $300 trillion a year. It used a simple formula: total volume divided by velocity. For instance, if every XRP token was reused 100 times a year, the network would only need $3 trillion worth of XRP to handle the entire $300 trillion.

XRP Price Prediction ChatGPT
XRP Price Prediction | ChatGPT

Next, ChatGPT calculated the token’s potential price. It divided that $3 trillion value by the 58.75 billion tokens in circulation. This resulted in an XRP price of about $51.06. Interestingly, analysts at crypto resource Changelly expect XRP to reach $51 by August 2033.

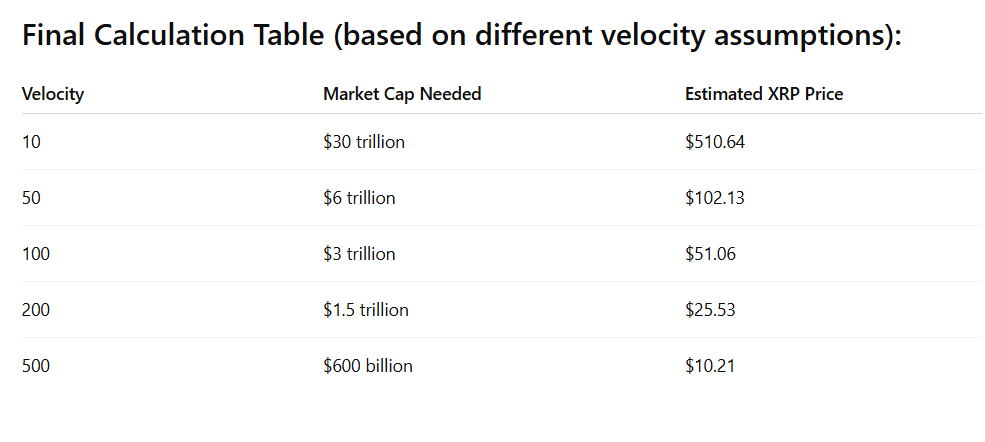
Notably, ChatGPT then mapped out several other scenarios based on different reuse rates. If the token velocity was just 10, XRP would need to be worth $30 trillion, pushing the price to around $510.64. 

XRP Price Based on Different Velocity Assumptions

Meanwhile, at a reuse rate of 50, the price could reach $102.13. However, a higher velocity of 200 would suggest a $25.53 price, and if tokens were reused 500 times, the price might land near $10.21.

The takeaway is that XRP’s price depends a lot on how often people use it in real-world transactions. While it’s unlikely XRP will handle all global cross-border payments, ChatGPT suggested that even capturing a small share, say, 5% or 10%, could drive up its value if adoption grows with it.

A $5,000 Shiba Inu Investment Could Become $5 Million: How and When?

0

As investor confidence in Shiba Inu remains intact despite recent downturns, this article explores how and when a modest $5,000 investment in SHIB could potentially grow to $5 million.

For many, the primary goal of entering the crypto market is to achieve financial freedom and enjoy a more comfortable life. This aspiration has led investors to put their money into volatile, high-growth assets, hoping their modest stakes will deliver life-changing returns.

Over the years, cryptocurrencies like Shiba Inu have demonstrated their ability to transform investors’ financial standing, turning average-income earners into overnight millionaires.

During the previous bull run, particularly in 2020 and 2021, numerous investors shared stories of how Shiba Inu significantly changed their financial circumstances. Notably, The Crypto Basic reported several of these stories, including one involving two New York-based brothers who made $9 million from an initial investment of just $7,900.

Investors Remain Confident About Shiba Inu’s Prospects 

While such stories are remarkable, the pressing question is whether Shiba Inu can still produce similar transformations given its recent performance. The asset has seen a significant drop in recent weeks, falling from around $0.000017 to $0.000013.

Despite this downturn, many investors remain optimistic about SHIB’s long-term potential to enhance their financial well-being.

Data from IntoTheBlock suggests that most investors have been holding SHIB for the long term. Specifically, approximately 1.13 million addresses, representing 77.93% of Shiba Inu’s 1.45 million on-chain holders, have held 787.27 trillion SHIB for over a year. 

However, 288,500 addresses have held 171.59 trillion SHIB tokens for less than a year. Only 25,760 addresses are short-term holders, holding 26.33 trillion SHIB under 30 days.  

This data underscores that the majority of Shiba Inu investors remain optimistic about its future.

Turning $5,000 Into $5 Million with Shiba Inu

Based on this investor sentiment, we estimated how a $5,000 investment in SHIB could potentially grow to $5 million, along with an approximate timeline for such growth.

To put this into perspective, turning $5,000 into $5 million requires an astronomical return of 99,900%. At the time of writing, Shiba Inu was trading at $0.00001320, marking a daily gain of 2.69%.

At this price, a $5,000 investment would buy approximately 378.78 million SHIB tokens. These tokens would be worth $5 million if SHIB’s price eventually reaches $0.01320.

Should this scenario play out, early investors could see their $5,000 balloon into $5 million, potentially changing their financial situation.

When Can a $5K Shiba Inu Investment Become $5M 

Although hitting the $0.01320 target requires a substantial surge of 99,900% from the current price, predictions from Changelly and Telegaon suggest that SHIB could reach the milestone. 

According to Changelly, SHIB could hit the $0.01320 mark between 2041 and 2049—approximately 16 to 24 years from now. Based on this projection, an investor who commits $5,000 to SHIB today might see it grow to $5 million by 2049.

On the other hand, Telegaon forecasts that SHIB could reach the $0.01320 milestone sooner, between 2036 and 2039. This suggests a timeline of 11 to 14 years. If accurate, an investor entering the market today could see their $5,000 grow to $5 million by 2039 at the latest.

Views of Community Analysts

Notably, the broader Shiba Inu community has engaged in a heated debate over whether SHIB will ever reach the $0.01 range in its lifetime. 

Shiba Inu’s marketing lead, Lucie, and community figure Luis Delgado believe the $0.01 target is attainable. Interestingly, Lucie has even suggested that SHIB could aim for more ambitious targets, such as $1.

However, skeptics, including enthusiasts like Oscar Ramos, question the feasibility of SHIB reaching such heights due to its enormous circulating supply of 589.5 trillion tokens.

Despite growing optimism in Shiba Inu, investors must exercise caution and not rely on this article as financial advice.

Tether and Bitfinex Move 35,812 BTC Worth $3.77B to Twenty One Capital

0

Paulo Ardoino, the CEO of Tether and CTO of Bitfinex, confirmed that both firms sent Bitcoin worth over $3 billion to Bitcoin treasury firm, Twenty One Capital.

Ardoino noted through a string of X tweets that Tether and Bitfinex were moving funds to Twenty One Capital. Over four transactions, the sister firms transferred $3.77 billion worth of Bitcoin to the heavily backed new Bitcoin Treasury firm.

Tether, Bitfinex Fulfill Pre-Funding Rights

Twenty One Capital CEO and Strike founder Jack Mallers announced the imminent launch of a Bitcoin-focused venture in April, offering exposure to the largest cryptocurrency by market capitalization. He introduced a new dynamic where the firm makes investors rich in Bitcoin rather than fiat currency, introducing new metrics such as Bitcoin per Share (BPS) and Bitcoin Return Rate (BRR).

Among its star-studded early investors are Tether, the largest stablecoin issuer; Bitfinex; SoftBank; and Cantor Fitzgerald. Meanwhile, Mallers noted that the first three firms would contribute 14,000 BTC, 7,000 BTC, and 10,500 BTC in a May 29 tweet.

Now, Tether, Bitfinex, and SoftBank have fulfilled their end of the bargain. Ardoino tweeted yesterday that Tether Group sent 18,812 BTC ($1.98 billion) to Twenty One Capital’s public address. He also disclosed that Bitfinex has transferred 7,000 BTC ($736,981) to the wallet.

Meanwhile, Tether moved another 10,500 BTC ($1.1 billion) to the Bitcoin treasury firm today on behalf of prominent US bank SoftBank. Notably, Maller had disclosed that the issuer would remit the funds on behalf of the institution.

Ardoino noted that the funds were part of the pre-funding of the initial equity raise in Twenty One Capital (XXI).

Twenty One Capital Focused on Transparency

Both Ardoino and Maller had argued that the public disclosure and proof of reserve marked the firm’s priority on transparency. “BTT=Bitcoin Treasury Transparency,” Ardoino tweeted.

Notably, Twenty One Capital’s revelation of its Bitcoin wallet address is the direct opposite of what Michael Saylor’s Strategy practices. The business intelligence-turned-Bitcoin treasury company adopted a privacy stance, with the executive chairman citing security reasons for the lack of disclosure.

Meanwhile, the Tether-backed investment firm will list on Nasdaq through a merger with Cantor Fitzgerald’s SPAC firm, Cantor Equity Partners (CEP), under a new ticker, XXI. According to BitcoinTreasuries, it is the third-largest public firm holding Bitcoin, sitting below Strategy and Marathon Digital.

Analyst Says Shiba Inu Price Getting Ready to Run Over 503%, Here’s How

0

Shiba Inu price has shown signs of a potential long-term trend reversal, according to a recent technical analysis by crypto market analyst Javon Marks. 

While the price of SHIB currently stands at $0.00001322—marking a 2.71% increase over the past 24 hours and an 8.70% decline in the last week—the broader focus is on a chart pattern developing since 2022. 

According to Marks, the formation of an Inverse Head and Shoulders pattern across this extended timeline could indicate a significant technical pivot for the asset. The pattern, which spans from early 2022 to mid-2025, is a bullish reversal signal typically forming after sustained downward trends.

Breakdown of Inverse Head and Shoulders Pattern

The structure of the pattern begins with the left shoulder forming in mid-2022, after a steep fall from Shiba Inu’s October 2021 all-time high of around $0.000081.

Shiba Inu Price Chart Javon Marks
Shiba Inu Price Chart | Javon Marks

At that point, Shiba Inu price dropped to a local low near $0.0000077 in June 2022, creating a double bottom structure. This was followed by the head of the pattern, which developed after another drop around December 2022 and hit its lowest point in June 2023 at approximately $0.00000657.

Subsequently, SHIB entered a recovery phase that led to a sharp surge in March, with the price reaching a local top of $0.00003629. However, the asset later pulled back again, with notable dips in September 2024 and April 2025, forming the right shoulder of the pattern. This shoulder remains higher than the head, aligning with the typical characteristics of an Inverse Head and Shoulders structure.

Potential Confirmation and Shiba Inu Price Target

The pattern’s neckline, which serves as the breakout level, remains a key point of observation. According to the analysis, a clear move above this neckline would confirm the pattern. If that occurs, the projected Shiba Inu price target is $0.000081. 

This target, based on technical measurement principles, would represent a gain of approximately 512.6% from current levels at $0.00001322. Marks notes the importance of this confirmation before any implications are drawn regarding future price movement.

On-Chain Activity Trends From IntoTheBlock

Supporting this technical structure, recent on-chain data from IntoTheBlock shows increasing network activity around SHIB. From early to mid-2025, three key metrics have recorded gains. 

Screenshot 2025 06 03T110426815
Shiba Inu Daily Active Addresses

Specifically, new addresses rose by 9.41%, active addresses increased by 9.75%, and zero balance addresses climbed by 15.37%.

Importantly, this network chart is essential in supporting a bullish SHIB narrative. While the price remains below previous highs, the resurgence in new and active addresses reflects improving fundamentals and growing network traction.

Typically, spikes in address activity precede significant price movements. If this behavioral pattern holds, the recent rise in address growth could be an early indicator of another price acceleration phase.