Home Blog Page 73

XRP Could Reach $35 if Citi’s $5.5T Projection for the Tokenization Market Plays Out

0

XRP could climb to higher price levels if the XRP Ledger (XRPL) keeps its share of the market and Citi’s $5.5 trillion tokenization forecast becomes reality. 

This idea recently gained traction after comments from Roger Bayston, Head of Digital Assets at Franklin Templeton, in the latest Evernorth interview.

Citi’s $5.5 Trillion Projection Still Conservative

During the conversation, Asheesh Birla, CEO of Evernorth, mentioned the tokenization report from Citi released in early June. 

For context, the report projected that tokenized securities on blockchain could reach $5.5 trillion by 2030. Birla asked for Bayton’s view on whether the figure might be too high or too low.

In response, Bayton said the estimate may be too low. He explained that when you compare it to the overall size of global capital markets, $5.5 trillion would still represent only a small portion. 

The Franklin Templeton executive pointed out that the financial system is gradually being rebuilt, with blockchain now acting as a more efficient foundation for how these markets operate.

XRPL Market Share and Growth Implications

Right now, the XRP Ledger holds about 2.28% of the total tokenized market, which equals roughly $4 billion in value. This comes as XRP currently trades at around $1.13. 

If Citi’s $5.5 trillion projection becomes reality by 2030 and XRPL keeps its 2.28% share, the network could hold about $125.4 billion in tokenized assets. This would be a major jump from the current $4 billion.

This potential growth could have implications for XRP’s price. To assess this, we asked Google Gemini for a hypothetical estimate.

Responding, Google Gemini explained that there remains no single formula that directly links the value of assets on a blockchain to the price of its native token. As a result, it used three different models to estimate possible outcomes.

XRP Valuation Models

The AI chatbot first presented an estimated market cap-to-tokenized value ratio of about 17.51 for XRP, based on a $70.06 billion market cap and $4 billion in tokenized assets. 

In the first model, it assumed this relationship grows at the same rate. Using a growth multiplier of 31.35x, based on the increase from $4 billion to $125.4 billion, the model produced a projected XRP price of $35.43. This would also put the market cap at around $2.196 trillion.
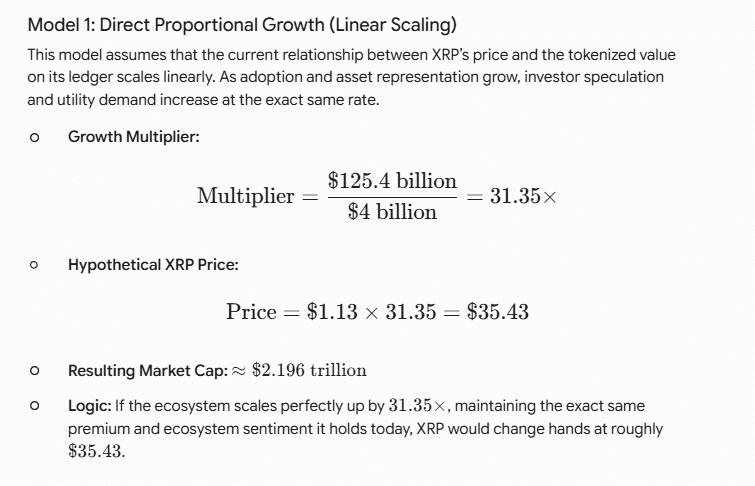
XRP Linear Scaling Valuation Model Google Gemini
XRP Linear Scaling Valuation Model | Google Gemini

In the second model, Gemini looked at how markets might behave as they mature. It suggested that speculative pricing could reduce over time as real utility becomes more important. 

XRP Institutional Utility Valuation Model Google Gemini
XRP Institutional Utility Valuation Model | Google Gemini

If the ratio drops to 10x the underlying asset value, XRP’s market cap could reach $1.254 trillion, giving a price of $20.23. Meanwhile, if it drops further to 5x, the market cap would be $627 billion, with XRP priced at $10.11.

The third model assumed that XRP’s value would only increase by the exact amount of new assets added to the network. With an increase of $121.4 billion in tokenized assets, the total market cap would rise from $70.06 billion to $191.46 billion. Under this scenario, XRP would be priced at about $3.09.

XRP Pure Value Absorption Valuation Model Google Gemini
XRP Pure Value Absorption Valuation Model | Google Gemini

Key Drivers

Gemini also highlighted two major factors that could affect these estimates. The first is XRPL’s deflationary system, where a small amount of XRP is burned with each transaction. If activity grows alongside a $125.4 billion ecosystem, the supply could drop, which may push the price higher.

The second factor is liquidity velocity. Specifically, if XRP is widely used to move value across borders, transaction activity would increase. 

While this could mean people hold XRP for shorter periods, it would also require larger liquidity pools. This could lead institutions to hold significant amounts of XRP, reducing the available supply and supporting higher prices.

In the end, these projections remain theoretical. Still, they show that XRP’s price could range from $3.09 to $35.43 depending on how adoption, market structure, and real-world use develop by 2030.

Cardano Showing Signs of Life Again: 14,783 New Holders as ADA Jumps Four Places to 14th

0

Cardano is showing signs of life after nearly 15,000 new wallet holders joined the ecosystem in a few days, even as its price rebounded from recent lows.

According to an analysis shared by Santiment Intelligence, the number of non-empty ADA wallets has increased by 14,783 since June 23, reversing a short-lived decline in holder count. At the same time, Cardano (ADA) has climbed toward the $0.20 level for the first time in roughly a month after rebounding sharply from its recent bottom.

The combination of rising wallet activity and improving price action suggests retail participation is returning after weeks of market uncertainty. Furthermore, ADA has climbed several places higher in the crypto market cap ranking to reflect the recent price growth.

Cardano Holder Count Surges Amid Price Rebound

The Santiment data shows the total Cardano holder count starting to recover after falling through much of June. Since reaching a local low on June 23, the network has added 14,783 non-empty wallets, lifting the total holder count back above 4.62 million.

Cardano Non-Empty Wallet Rise/Santiment

A rising holder count means more adoption. The situation confirms that buying pressure is returning for Cardano, as users saw the June dip as an opportunity to buy lower.

Meanwhile, this has seen ADA stage a notable recovery from its recent lows. The asset rose by roughly 45% from its June 25 bottom of $0.138 to the $0.20 level before retracing slightly. 

Notably, last week’s 32% rebound marks its strongest weekly upward move since late February 2025, when it rallied 47%. Nonetheless, the token remains well below prices seen earlier this year.

Santiment noted that Cardano has historically maintained a loyal retail community even during prolonged market downturns. As such, the latest increase in wallet addresses may indicate that smaller holders are returning as market sentiment stabilizes.

Cardano Climbs to 14th Place in Crypto Market Cap Ranking

The price shift has also impacted ADA’s position in the cryptocurrency ranking by valuation.

Following the 38% dip in June, Cardano dropped to the 18th asset by market cap. However, as prices started to outperform Bitcoin and other major large-cap assets, ADA started to move in the rankings.

It briefly moved five spots to the 13th spot before the current pullback saw it lose that spot to Stellar again.

With a market cap of $6.71 billion, ADA now ranks 14th, climbing above the Dai stablecoin, Canton, Chainlink, and Monero. Meanwhile, the current momentum is now fueling optimism that Cardano will reclaim the 10th place in the cryptocurrency market cap ranking.

Cardano Reclaims 14th in Market Cap Ranking/CoinMarketCap

Sentiment Slowly Shifts After Weeks of Uncertainty

Cardano faced heavy selling pressure throughout June as bearish sentiment intensified across the ecosystem.

Several factors fueled the weakness, including ADA falling to price levels not seen since 2020, public comments from Cardano founder Charles Hoskinson about ecosystem shortcomings, and community debate around efforts to move Cardano discussions away from X.

Together, those developments weighed on confidence and contributed to the decline in both price and holder activity. Growing FUD also climbed as Cardano’s social dominance rose considerably.

However, the recent recovery in wallet growth suggests confidence may be gradually returning. Santiment added that if the number of holders continues to rise while ADA establishes support around the current levels, it could signal that the period of FUD marked a local capitulation rather than the beginning of another prolonged decline.

Kim Hye-young’s Family Held More Than 522,000 XRP

0

Recent social commentary has brought attention to official records showing that South Korean lawmakers and other public officials own significant amounts of XRP. 

Although the disclosures first became public around March 2025, market participants have recently started discussing the data, as they assess the cryptocurrency holdings of government officials.

For context, South Korea now requires public officials to regularly disclose their assets, and those disclosures now include cryptocurrencies. The country expanded these rules after a series of regulatory changes and high-profile crypto-related controversies. 

South Korea’s Disclosure Rules

Notably, South Korea has one of the world’s most active cryptocurrency markets, and the country has continued to strengthen oversight as digital assets become more widely used. 

As part of this effort, authorities expanded public asset disclosure rules to cover virtual assets. Data released around March 2025 showed that lawmakers held substantial amounts of XRP.

Among those disclosures, Seoul City Councilor Kim Hye-young reported the largest cryptocurrency portfolio during the reporting period. 

Her family’s virtual asset holdings were worth about 1.76 billion Korean won, or roughly $1.14 million. The portfolio included 16 different cryptocurrencies.

Kim Hye-young’s Family Held More Than 522,000 XRP

The filing showed that Kim Hye-young’s spouse owned 519,004 XRP, while her eldest son held another 3,336 XRP. Together, the family’s XRP holdings came to 522,340 XRP.

The disclosure also included several other digital assets. Her spouse reported holding 0.01226935 ETH and 472 DOGE in addition to XRP. Kim Hye-young also disclosed personal cryptocurrency holdings, including 0.00144591 BTC.

Seoul City Councilor Choi Min-gyu reported the second-largest cryptocurrency portfolio. His virtual assets were valued at about 1.62 billion Korean won, or around $1 million. His holdings included 409,551 XRP, 9,402 Arbitrum (ARB), and 4,701 Cardano (ADA), along with several other altcoins.

Hundreds of Officials Reported Crypto Assets

The broader disclosure figures came from the Public Officials Ethics Committee, which published changes to officials’ property filings for 2025 around March 27, 2025. 

The data showed that 411 of the 2,047 officials required to file disclosures reported owning cryptocurrencies. This represented about 20.1% of all officials covered by the reporting rules.

The total value of those crypto holdings reached 14.4 billion Korean won, or over $9.4 million. On average, each official who disclosed digital assets reported holdings worth around 35 million Korean won, equal to roughly $25,000.

The records also showed that XRP ranked among the cryptocurrencies most commonly held by officials and their family members. 

South Korea expanded these disclosure requirements after earlier controversies, including the case involving lawmaker Kim Nam-guk and his large undisclosed cryptocurrency holdings. 

Before the reforms, officials did not always have to report virtual assets. Lawmakers began proposing changes as early as 2023 to close those gaps in the disclosure rules.

U.S. Lawmakers Report Much Smaller XRP Holdings

Meanwhile, in the United States, lawmakers disclose financial assets under the STOCK Act, which covers investments such as stocks and cryptocurrencies. Public filings generally show much smaller XRP holdings than those reported in South Korea.

Representative Guy Reschenthaler of Pennsylvania disclosed cryptocurrency purchases made in late 2024, including XRP and Solana around Dec. 11, 2024, before later buying Bitcoin. 

His reported holdings fell within the required disclosure range of $1,000 to $15,000 for each asset. Meanwhile, more recently, White House official Ian Kelley confirmed holding XRP in an official disclosure.

XRP Ledger Missing From Stablecoin Data as Ethereum and Tron Dominate With 81% Share

A viral social media post claiming Ethereum controls 87% of the global stablecoin supply has sparked debate within the XRP community.

However, the chart behind the claim excluded Tron, one of the largest stablecoin networks. The discussion comes as stablecoin activity reaches new highs. At the same time, Ripple’s RLUSD continues to gain traction on the XRP Ledger.

Ethereum and Tron Control 81% of the Market

Notably, a crypto user shared Artemis data claiming Ethereum now controls 87% of the stablecoin supply. Longtime XRP critic on X, @ScamDetective5, used the post to further criticize XRP, saying, “The XRP Ledger is not even on the map.”

However, an Artemis dashboard that includes all major blockchains tells a different story. Ethereum remains the largest stablecoin network, with $162.7 billion in circulating supply. This gives it a 52.4% market share, not 87%.

Tron ranks second with $89.4 billion in circulating supply, accounting for 28.8% of the market. Together, Ethereum and Tron host more than 81% of the global stablecoin supply.

Other major networks include:

  • BNB Chain: $16.6 billion (5.4%)
  • Solana: $16.2 billion (5.2%)
  • HyperEVM: $5.7 billion (1.8%)
  • Base: $4.6 billion (1.5%)
  • Arbitrum: $4.3 billion (1.4%)
  • Polygon PoS: $3.9 billion (1.3%)
  • XRP Ledger: Approximately $1.2 billion (0.4%)

The dashboard puts the total stablecoin supply at $312.7 billion.

Source: Artemis
Source: Artemis

Stablecoin Transaction Volume Reaches New High

Notably, the market share debate comes as stablecoin adoption continues to grow. According to Visa’s Allium-powered analytics, adjusted stablecoin transaction volume hit a record $1.79 trillion in June. That was up 63% from May and 125% compared with the same month last year.

Visa’s methodology removes bot activity, treasury rebalancing, and repetitive smart contract transactions. The goal is to better measure genuine economic activity.

USDC led June’s transaction volume at $1.21 trillion, accounting for about 67% of the total. USDT followed with $576 billion, or roughly 32%. PYUSD processed another $2.42 billion.

Among blockchains, Base narrowly led June’s transaction volume at $565 billion. Ethereum followed closely with $562 billion, while Tron processed about $320 billion.

The data suggests stablecoins are seeing increased use for payments, decentralized finance, and cross-border transfers despite broader market uncertainty.

RLUSD Gains Ground on the XRP Ledger

While the XRP Ledger remains a small player in the broader stablecoin market, Ripple’s RLUSD recently reached an important milestone.

In late June, RLUSD’s circulating supply on the XRP Ledger surpassed its supply on Ethereum for the first time. That made XRPL the largest network hosting Ripple’s stablecoin.

Current figures from the RLUSD Tracker show that the XRP Ledger holds about $848 million in RLUSD. Ethereum holds a far lower figure at $727 million.

Across both networks, RLUSD’s circulating supply has grown to nearly $1.6 billion. The figures indicate growing adoption within Ripple’s ecosystem, even as Ethereum and Tron continue to dominate the overall stablecoin market.

Cardano Reclaims Long-Term Support, Opening the Door to a 7,400% Rally by 2028

Cardano (ADA) is showing fresh bullish momentum after erasing nearly four weeks of losses in just five days.

The recovery follows a rebound from a multi-year support zone. This price area previously served as a major resistance level during the 2020-2021 bull market.

Now, market watchers believe the latest move could mark the start of a new multi-year uptrend. Under this bullish scenario, ADA could climb as high as $13.52 by 2028.

Cardano Rebounds From Key Long-Term Support

Notably, Cardano’s long-term chart confirms ADA hit a critical support zone after its strongest bearish cycle since 2021. The previous bear market bottom formed in December 2022. ADA later confirmed a double bottom in June 2023.

This present cycle followed a different timeline. Cardano peaked in December 2024 at $1.3187 before falling to its latest low in June 2026 at $0.1387. With ADA trading at $0.1824, it has rebounded by over 31%.

The recent recovery developed within a support zone that held for about five weeks. Interestingly, this same price range acted as major resistance in 2020. Buyers needed nearly six months to break above it before Cardano entered its previous bull market.

With that former resistance now acting as support, the long-term trend has turned bullish.

Cardano Chart by TheCryptoBasic

A Longer ADA Bull Market Is Possible

Now, Cardano’s next bull cycle could last longer than previous ones. While a one-year rally remains possible, at least a two-year timeline is more realistic.

Essentially, rather than another prolonged bear market, future cycles will resemble Bitcoin’s recent price action, meaning shorter corrections followed by upward momentum.

Moreover, the crypto market has matured since the last cycle, with the rise of ETFs, institutional participation, and regulatory clarity from the SEC. Accordingly, future bull runs could last longer while major downturns become less severe.

Key Price Targets Stretch to $13.52

Notably, several technical levels could serve as milestones if Cardano’s recovery continues. The first target is $1.32, where the rally could temporarily slow. The next major resistance sits at $2.05, which may attract stronger selling pressure.

A move back to the previous all-time high region near $3.1 would mark the next major long-term objective.

Beyond that, there is a potential rally to $7.76, representing roughly 4,200% gains from current levels. The most bullish target stands at $13.52 by 2028, implying an estimated 7,400% increase if the technical outlook plays out.

Cardano ADA chart by MasterAnanda on TradingView

Ripple-Backed Evernorth Registers Trademark in Cayman Islands as XRP Treasury Initiative Advances

0

The Evernorth trademark has been publicly recorded in the Cayman Islands, marking another milestone in the development of the Ripple-backed XRP Digital Asset Treasury (DAT).

Based on a recent update, the trademark filing was handled by HSM IP Ltd., a Cayman-based intellectual property firm that frequently manages trademark registrations for companies operating in the jurisdiction. 

Evernorth Registers Trademark in Cayman Islands

Evernorth Trademark Covers Digital Asset Financial Services

According to the Cayman Islands Gazette, the Evernorth word mark (No. T0004840) has been registered under Classes 36 and 42, covering a wide range of digital asset-related financial and technology services.

Under Class 36, the trademark protects services related to digital asset portfolio creation and management, financial advisory and consulting for digital assets, digital asset treasury management, financial custody solutions, and investment strategy information for publicly traded investment funds.

Meanwhile, Class 42 focuses on the technological infrastructure supporting these offerings. Specifically, it includes software-as-a-service (SaaS) platforms for blockchain validation, digital asset portfolio management software, electronic payment processing, authentication software, digital asset storage, and electronic data storage solutions.

Notably, the trademark registration remains valid until April 1, 2036, giving Evernorth nearly a decade of legal protection for its brand and related services.

Why the Cayman Islands Matter for the XRP DAT

The Cayman Islands registration aligns with Evernorth’s broader corporate structure and long-term strategy. The XRP Digital Asset Treasury is currently pursuing a business combination with Armada Acquisition Corp. II, a Cayman-domiciled Special Purpose Acquisition Company (SPAC).

Establishing the trademark in the Cayman Islands complements this structure, as the jurisdiction is widely used by global investment vehicles due to its tax neutrality, asset protection framework, and efficient intellectual property and global licensing regime.

Consequently, the trademark filing strengthens the legal foundation for Evernorth’s institutional XRP treasury initiative as the company moves closer to becoming a publicly traded entity.

Evernorth Expands Institutional XRP Strategy

Beyond securing its intellectual property, Evernorth continues to expand its institutional XRP strategy. The company already holds approximately 473 million XRP, making it one of the largest corporate holders of the cryptocurrency.

Rather than operating as a passive investment vehicle, Evernorth plans to actively grow its XRP reserves. Its strategy includes institutional lending, liquidity provisioning, and participation in decentralized finance (DeFi) yield opportunities to generate additional returns on its holdings.

At the same time, Evernorth is advancing its public listing plans. The company has submitted multiple amendments to its S-4 registration filings as it seeks a Nasdaq listing under the ticker XRPN, which would provide institutional investors with regulated exposure to XRP.

Additionally, Evernorth has strengthened its leadership team by appointing four new board members, including Ripple Chief Legal Officer Stuart Alderoty, further reinforcing its ties to the XRP ecosystem and its long-term institutional ambitions.

Shiba Inu Bears Stay In Control With Next Downtrend Target at $0.0000010

0

Shiba Inu continues to follow a well-defined downtrend pattern, with the latest price action reinforcing the broader bearish structure. 

The Shiba Inu (SHIB) chart shows sellers maintaining control through a series of lower highs, while each recovery attempt has not been sustainable.

A long-term descending trendline early capped rallies for months, and the recent move fits the same pattern. After slipping below support, SHIB has repeatedly attempted to rebound, but its price has stalled around key resistance zones, raising the possibility of deeper corrections.

Shiba Inu Recovery Attempts Continue to Lose Momentum

Shiba Inu trailed beneath a descending trendline between September 2025 and April 2026, consistently making lower highs and lower lows. After breaking out, it made a series of higher lows along an ascending trendline before breaking below it in May. This confirmed the bearish bias.

The SHIB/USDT 4H chart highlights a familiar sequence that repeated throughout the decline. A brief rebound has followed each sharp sell-off, only for earlier gains to be wiped out as the retested resistance attracts fresh selling pressure.

Shiba Inu confirmed this in the early June retest, where its price peaked near $0.00000558. What followed was a sharp decline to a new low of $0.00000430 five days later. Another fakeout happened with a brief rally to $0.00000520 on June 15. Bears regained control and dragged SHIB lower.

Shiba Inu Chart Analysis

SHIB Downward Structure Intact

Meanwhile, the latest market bounce has carried SHIB back toward the former support area near $0.0000046. The meme coin stalled near the resistance area, which aligned closely with the 100-period moving average. Notably, the loss of momentum there is critical as the dynamic resistance has repeatedly rejected earlier recoveries.

The latest rejection means the overall market structure has not changed. The sequence of lower highs and lower lows remains intact, while repeated failures near resistance indicate that buyers have yet to establish sustained control.

As long as SHIB remains below the 100 MA and the nearby resistance zone around $0.0000046, the broader bias continues to favor the downside. The downside target is a potential decline toward the next support region near $0.0000010, a 77% crash from the current price level.

However, a successful reclaim of the resistance could open the door to a stronger recovery. A decisive move above resistance, supported by sustained buying pressure, would weaken this outlook.

Could SHIB Accumulation Disrupt Bears?

While price analysis shows a bearish outlook, on-chain data provides a glimmer of hope. Specifically, Shiba Inu whales are accumulating Shiba Inu through weakness, suggesting confidence in the asset’s price trajectory.

In the past 24 hours, the total exchange netflows have turned negative, highlighting that coins that flowed out surpassed those that entered. The metric increased by 1.43% to a negative 33.5 billion SHIB tokens, worth $146,207.

Shiba Inu Trending Metrics/CryptoQuant

Notably, with the negative flow, total exchange reserve dropped slightly to 86.9 trillion. Fewer tokens of these platforms reduce selling pressure. It also means more of SHIB’s supply is in wallets more likely to hold longer. Whether this accumulation disrupts the bearish trend remains to be seen.

XRP ETF Inflows Resume as Bitwise Leads With $6.55M, Franklin and Grayscale Maintain Monthly Momentum

U.S. spot XRP exchange-traded funds (ETFs) returned to positive territory on July 2 after a brief pullback, with Bitwise XRP ETF leading the day’s inflows.

Data from SoSoValue confirmed that July has started with net positive flows. Although inflows have slowed from the record levels seen late last year, institutional interest remains steady.

Bitwise Leads Daily XRP ETF Inflows

Specifically, U.S. spot XRP ETFs recorded $6.55 million in net inflows on July 2. Bitwise’s XRP ETF was the only fund to attract fresh capital during the session, bringing in the full $6.55 million. Its cumulative historical inflows have now reached approximately $501 million.

The latest inflow lifted total assets across all U.S. spot XRP ETFs to $988 million. Meanwhile, cumulative net inflows across all issuers also rose to $1.487 billion. The rebound came just one day after the market posted modest outflows.

Franklin’s Gains Couldn’t Offset Bitwise Redemptions

On July 1, U.S. spot XRP ETFs recorded $1.86 million in net outflows. Franklin’s XRP ETF (XRPZ) attracted $2.88 million in fresh capital. However, Bitwise’s XRP ETF saw $4.75 million in redemptions, pushing the overall market into negative territory.

Following that session, total XRP ETF assets stood at approximately $961 million. Historical cumulative net inflows reached $1.480 billion.

The return to positive inflows the next day suggests institutional demand remains resilient despite short-term fluctuations.

Monthly XRP ETF Inflows Remain Positive

SoSoValue’s monthly data shows XRP ETF inflows have slowed compared with the strong finish to 2025. Even so, funds have continued to attract net positive capital in most months.

Monthly net flows:

  • November 2025: +$666.61 million
  • December 2025: +$499.91 million
  • January 2026: +$15.59 million
  • February 2026: +$58.09 million
  • March 2026: -$31.16 million (the only monthly net outflow so far)
  • April 2026: +$81.59 million
  • May 2026: +$131.94 million
  • June 2026: +$59.46 million
  • July 2026 (month-to-date): +$4.68 million

July has started on a positive note after June’s $59.46 million in net inflows. However, current monthly totals remain well below the record buying seen during the ETFs’ first months.

Even with slower inflows, cumulative net investment has continued to rise. That points to sustained institutional participation.

XRP ETF Monthly Inflow Data | SoSoValue

Institutional Demand Persists Despite Derivatives Slowdown

The ETF data comes as XRP derivatives markets have cooled. Open interest has dropped sharply from around $1.3 billion to below $150 million. The decline signals a significant reduction in leveraged trading activity.

At the same time, on-chain activity has strengthened. Daily active XRP addresses are up roughly 72% from mid-June, suggesting network usage continues to improve even as speculative trading eases.

Institutional demand has also remained steady. Before the latest July inflows, U.S. spot XRP ETFs attracted $15.34 million on June 29. The trend suggests long-term investors continue adding XRP exposure through regulated investment products despite weaker derivatives activity.

Hoskinson Says Cardano Will Be as Performant as XRP With Leios Upgrade

0

Charles Hoskinson believes the network’s Ouroboros Leios upgrade will increase transaction capacity, positioning Cardano alongside some of the industry’s fastest blockchain networks, including the XRP Ledger (XRPL).

Hoskinson made the assertion during a virtual interview with David Gokhshtein on The Breakdown podcast. During the discussion, he revealed that Leios technology could boost Cardano’s throughput by as much as 60 times its current capacity.

“Leios will be 60x in terms of throughput inside the system,” he said, highlighting the upgrade’s potential to significantly increase the number of transactions Cardano can process per second. 

If Cardano reaches that level, Hoskinson believes the network will “be as performant as the XRP Ledger (XRPL).” 

Cardano Aims to Match XRPL’s Speed and Efficiency

For years, the XRPL has built its reputation on fast settlement times and high transaction throughput, making it a preferred option for payments and cross-border transfers.

The network typically settles transactions within three to five seconds and supports a throughput of up to 1,500 TPS. Notably, the blockchain surpassed 120 TPS in March 2026 while processing around 650 transactions during peak activity.

Against this backdrop, Hoskinson’s latest remarks suggest that Cardano no longer views transaction speed as a competitive disadvantage. Instead, he believes the introduction of Leios will place the network on par with leading blockchain platforms in terms of performance and scalability.

Preserving Decentralization and Security

Notably, Hoskinson stressed that Cardano achieved these throughput gains without sacrificing its core principles, particularly decentralization and security.

The blockchain industry has long struggled to balance scalability, decentralization, and security, a challenge commonly known as the blockchain trilemma. Many networks improve performance only by compromising one of the other two elements.

However, Cardano aims to prove that such trade-offs are not inevitable. With Leios, Cardano hopes to deliver the speed required for mainstream adoption while preserving the principles that have guided the ecosystem since its inception. 

Current Status of Leios 

Meanwhile, the Ouroboros Leios upgrade officially launched its public testnet on June 23, 2026. Named Musashi Dojo, the testnet represents the first time the protocol has operated in a live network environment.

Looking ahead, Cardano plans to deploy Leios on the mainnet later this year, marking what could become one of the network’s most significant scalability upgrades to date.

XRP Exchange Net Wallet Flows Flip Negative for First Time in a Year

0

XRP activity on Binance recorded an important directional change in June, as wallet behavior moved more toward withdrawals. 

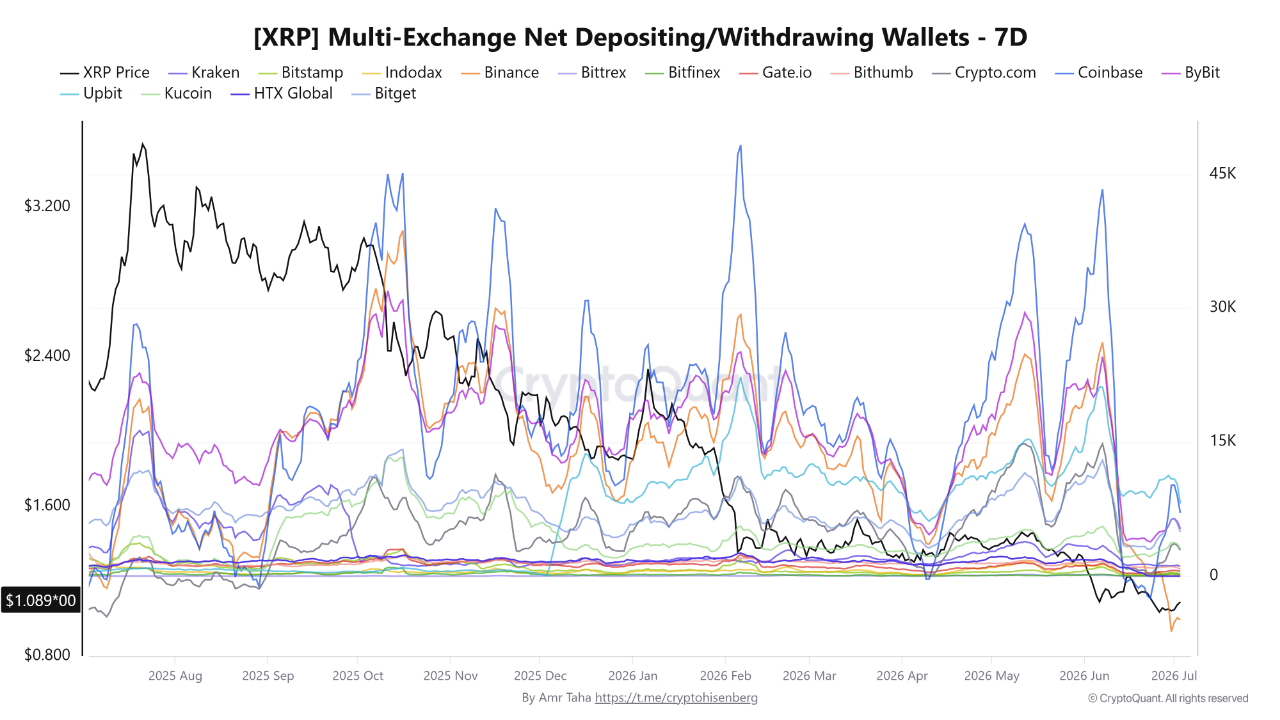
Specifically, the Binance exchange’s 7-day net depositing and withdrawing wallet count fell from +26,200 on June 7 to -6,210 on June 30, according to on-chain data sourced by market resource CryptoQuant.

For context, this represents a 32,410-wallet swing over 23 days, which pushes Binance from a period where deposits dominated into one where more wallets are taking XRP off the exchange than sending it in.

XRP Exchange Net Wallets CryptoQuant
XRP Exchange Net Wallets | CryptoQuant

Notably, June 30 marks the first negative reading since July 9, 2025, when the figure only dropped to -1,350. The current level of -6,210 is about 4.6x deeper, indicating a much stronger move toward withdrawals than previously seen.

Across other exchanges, withdrawals now appear to outweigh deposits as well, suggesting that fewer participants are moving XRP onto trading platforms. However, Binance still stands out, as the platform remains the only major exchange with a deeply negative net-wallet reading.

What the Data Can and Cannot Confirm

Despite the shift in net wallet flow on Binance toward negative readings, the metric has its limits. It tracks the number of wallets moving XRP, not the amount being transferred. As a result, it cannot confirm whether large holders are accumulating.

For instance, a few wallets moving large amounts of XRP would appear similar to many wallets moving smaller amounts. This means the idea of accumulation remains possible, but the data does not directly prove it.

What the data does clearly show is a change in Binance’s flow structure. Essentially, fewer wallets are sending XRP to the exchange, while more are taking it off.

XRP Eyes July Recovery After 22% Drop in June

This change in wallet flows happened alongside a decline in price, followed by a modest recovery. XRP began June around $1.30 but dropped by about 22% during the month, reaching a low of $1.01 in late June before stabilizing.

At the start of July, XRP traded between $1.04 and $1.09, placing it near its lowest level since early 2025. Interestingly, since then, the price has improved slightly, rising to $1.13 at press time and recording three straight intraday gains in July.

Amid the rebound push, the $1.00 level continues to act as an important support zone. This area has backing from a strong cost-basis cluster, where about 830 million XRP last changed hands between $1.00 and $1.06. Buyers have continued to defend this range, helping to hold the price above this level.

Binance XRP Reserves Fall to March Lows

Meanwhile, the change in wallet behavior matches a decline in Binance’s XRP reserves. The exchange’s holdings dropped from around 2.78 billion XRP on May 12 to about 2.61 billion by July 2, a reduction of roughly 170 million tokens, or close to 6%.

This drop brings Binance’s reserves to their lowest level since March 2026, and shows a gradual reduction in the amount of XRP available for trading on the largest exchange by volume. This sort of decline often comes from steady withdrawals, not short-term changes.

A similar pattern appears on Upbit, though on a smaller scale. Specifically, XRP reserves there fell from about 6.515 billion tokens on May 30 to 6.457 billion by July 2, a decrease of roughly 58 million XRP. Together, Binance and Upbit have seen a combined drop of about 228 million XRP.

Whale-Sized Withdrawals on Coinbase

While Binance shows strong overall outflows, Coinbase data reveals who is driving the withdrawals, as larger holders have started to enter the conversation. 

Specifically, transactions above one million XRP made up about 10% of total outflow value on June 16, but this share increased to 25.7% by July 1. 

The change took place over about two weeks and showed that bigger wallets have become more active in moving XRP off the exchange.