Home Blog Page 737

Here is when $500 Invested in Shiba Inu Today Can Turn Into $50K, $100K, or $500K

0

If Shiba Inu continues its rally, a $500 investment in SHIB today could skyrocket into jaw-dropping gains of $50,000, $100,000, or $500,000. 

Shiba Inu has experienced a significant spike in the past few days, with its price soaring from around $0.000013 to above $0.000015. This rally coincides with a recent surge in the market, fueled by renewed crypto interest amid macroeconomic events such as the recent U.S.–U.K. trade agreements. 

Latest SHIB Performance 

Currently trading at $0.00001558, Shiba Inu has witnessed a double-digit growth of 17.59% over the past seven days. Its 30-day gain is even higher, currently standing at 30% in the hours leading up to press time. 

However, the YTD chart shows Shiba Inu has lost 26.4% of its value since the beginning of 2025. Despite this, it looks committed to clawing back those losses, as it has already spiked by 16% month-to-date. 

Shiba Inu’s recent performance has reignited investors’ belief in the token’s potential. Some suggest that SHIB could replicate its previous performance in the 2020/2021 market when it transformed meager investments into remarkable gains. 

Turning a $500 Investment in SHIB to $50K, $100K, or $500K 

Amid these projections, we assessed what it would take for a $500 Shiba Inu position to blossom into $50,000, $100,000, or $500,000–and how soon those milestones could occur. 

Based on the current price, $500 invested in Shiba Inu today can procure 32,092,426 (32.09 million) SHIB tokens. For a portfolio containing 32.09 million SHIB to hit valuations of $50,000, $100,000, or $500,000, the token’s price must soar significantly. 

This $500 investment would be worth $50,000, $100,000, or $500,000 if Shiba Inu’s price skyrockets by 9,900%, 19,900%, or 99,900%, respectively. Applying these growth rates to the current price would push it to $0.001558, $0.003116, and $0.01558. 

Therefore, a $500 investment in Shiba Inu today could significantly increase to $50,000, $100,000, or $500,000 if SHIB’s price rallies to ambitious targets like $0.001558, $0.003116, and $0.01558, respectively. 

When Can SHIB Reach These Targets?  

Despite how ambitious these projections seem, some analysts think they are achievable. 

Specifically, prominent analysts at crypto trading platform Changelly have set different timelines for when SHIB’s price will rally to these targets. According to them, the $0.001558 prediction will materialize between 2035 and 2039. 

However, they envision the $0.003116 target coming to fruition in the next 15 years, specifically by March 2040. Based on their calculations, Shiba Inu could hit the one-cent dream and rise toward the $0.01558 target by early 2041. 

While there has been a growing debate regarding whether SHIB can hit the $0.01 milestone, Shiba Inu’s marketing lead asserts that the one-cent dream is achievable. Although Lucie expects the projection to take time before materializing, she suggested that Shiba Inu could surpass it and aim for greater targets like $1, but $0.01 is more likely. 

Meanwhile, this article is purely informational, portraying the potential timeline for a $500 investment to blossom into $50,000, $100,000, or $500,000. That said, investors should not rely on it as financial advice, as SHIB’s potential surge to the aforementioned price targets remains uncertain. 

Cardano Defends $0.75 Support as Analyst Eyes $1 Price Target

Cardano is retesting the $0.75 support level amid rising volatility. Will ADA rebound to $1, or break down toward $0.71?

The price of ADA is struggling to maintain its uptrend, as short-term volatility threatens a breakdown below the $0.75 support zone. A drop could lead to a test of the 200-day EMA at $0.71, while the chances of reclaiming $1 after the retest are diminishing.

Cardano Price Analysis 

Cardano is down nearly 5% this week as supply pressure increases and Bitcoin remains stagnant near $103k. The pullback in ADA has halted last week’s 18% rally and raises concerns about a potential failure of the inverse head and shoulders pattern breakout.

Cardano Price Chart
Cardano Price Chart

The recovery peaked at $0.864 earlier this week before pulling back to retest the broken neckline around $0.75. However, increased selling pressure, driven by a broader market slowdown, supports the retest phase and raises the likelihood of a breakdown. A drop below $0.75 could lead to a retest of the 200-day Exponential Moving Average (EMA) near $0.71.

Amid rising downside risks, the Relative Strength Index (RSI) has fallen to 55 from the overbought zone, hovering near the midpoint. Despite this, the higher low trend in the RSI remains intact. A minor uptick suggests a possible rebound and hints at a return of bullish momentum.

Additionally, the convergence of the 50-day and 200-day EMAs is teasing a golden crossover, while the 100-day EMA remains flat. Overall, technical indicators point to a potential continuation of Cardano’s uptrend.

According to trend-based Fibonacci levels, the 23.60% level aligns with the $0.75 zone, indicating strong demand. A post-retest rebound from this area could face immediate resistance at the 38.20% level near $0.903. Beyond that, the 50% level at $1.010 represents a key psychological resistance, marking a 17% increase from the current price.

Analyst Targets $1 as Cardano Nears Channel Breakout

Crypto analyst Ali Martinez supports the bullish rebound thesis for Cardano. In his latest tweet, he suggests that ADA could rally to $1 following a breakout from a declining channel.

Notably, this channel forms a bull flag in the context of the ongoing uptrend on the three-day price chart. Based on the Fibonacci levels in the shared chart, the ADA rally could extend to the 100% level at $1.212.

Image

Brazil’s Méliuz Invests $28.4M in Bitcoin, Adopts BTC Treasury Strategy

0

Brazil’s fintech company Méliuz has become the first in the country to include Bitcoin in its treasury, buying more than $28 million of BTC.

The move marks a shift in the firm’s financial strategy, with the company now focusing on increasing its Bitcoin holdings through corporate structures and capital management. Méliuz confirmed that the bank is using this strategy not just to deal with inflation and currency risks, but because it’s now one of its main ways of doing business.

Méliuz Shareholder Approval and Strategic Shift

On May 15, Méliuz held a shareholder meeting, at which investors approved the proposal to transform the firm into a Bitcoin treasury corporation. Israel Salmen, the executive chairman of Méliuz, posted on the social platform X, confirming that the plan received support from a clear majority of shareholders.

This move makes Méliuz the first publicly traded company in Brazil to formally adopt Bitcoin as a key financial asset in its corporate treasury.


Méliuz’s management explained that the company will now work to maximize the amount of Bitcoin per share. The company emphasized using cash generation, corporate structures, and financial instruments to grow its Bitcoin holdings.

Details of the Bitcoin Purchase

Méliuz confirmed that it has acquired 274.52 BTC at an average price of $103,604 per coin, for a total purchase cost of $28.4 million. This brings the company’s total Bitcoin holdings to 320.3 BTC, which are currently valued at over $33 million. 

Amid this announcement, the BTC price has been trading above $104k, with experts even predicting a potential to touch a $1M high.

The company made its initial Bitcoin purchase on March 6, 2025, when it acquired 45.73 BTC. Méliuz stated that future purchases will be strategic and structured to increase value for its shareholders.

Wider Crypto  Industry BTC Buying Trends

Alongside Méliuz, other companies have recently announced Bitcoin treasury strategies following Michael Saylor-led company Startegy. DayDayCook, a U.S.-listed company, announced on the same day that it had purchased 100 BTC, with a goal of reaching 500 BTC in six months and 5,000 BTC in three years.

In the Middle East, Abraaj Restaurants Group became the first publicly listed company in Bahrain to add Bitcoin to its balance sheet, acquiring 5 BTC. Meanwhile, the United States is also advancing a proposal to establish a national Bitcoin reserve.

Essentially, Méliuz’s announcement adds to the growing trend of corporate Bitcoin adoption, with companies worldwide exploring Bitcoin as part of their treasury management approach.

Solana Targets $262 as Analyst Spots Cup and Handle Bull Pattern

Solana bounces back to $172 as traders set their sights on $262. A breakout from a rounding bottom pattern and strong futures market data are fueling bullish momentum.

Solana’s move above the $170 mark signals a strong resurgence in buying pressure. Bulls are now eyeing the key psychological level of $200. Could a breakout in SOL lead to a new all-time high?

Solana Price Analysis Targets $262

Solana is currently trading at $172, up 1.75% today after a 7% decline over the past two days. As SOL recovers from two consecutive red candles, it hints at a major breakout rally, forming a rounding bottom pattern.

Solana Price Chart
Solana Price Chart

Solana has made a U-shaped recovery following a 60% drop from $262 to $105 between January 18 and April 8. With a 64% gain over the past 34 days, SOL now challenges the 50% Fibonacci retracement level at $183 — the midpoint of the previous decline.

This 50% level also acts as the neckline of the rounding bottom pattern on the daily chart. A breakout above this level could push SOL toward the 100% Fibonacci level at $262, a projected 52% increase.

The RSI has begun to rise after dipping below the 14-day SMA from overbought territory, supporting the bullish outlook. Meanwhile, the 50-day and 100-day EMAs are on the verge of a bullish crossover, which may serve as a buy signal.

On the downside, a breakdown below the 200-day EMA would invalidate the reversal pattern, potentially triggering a decline to the $150 level.

Analyst Predicts Parabolic Rise Above $200

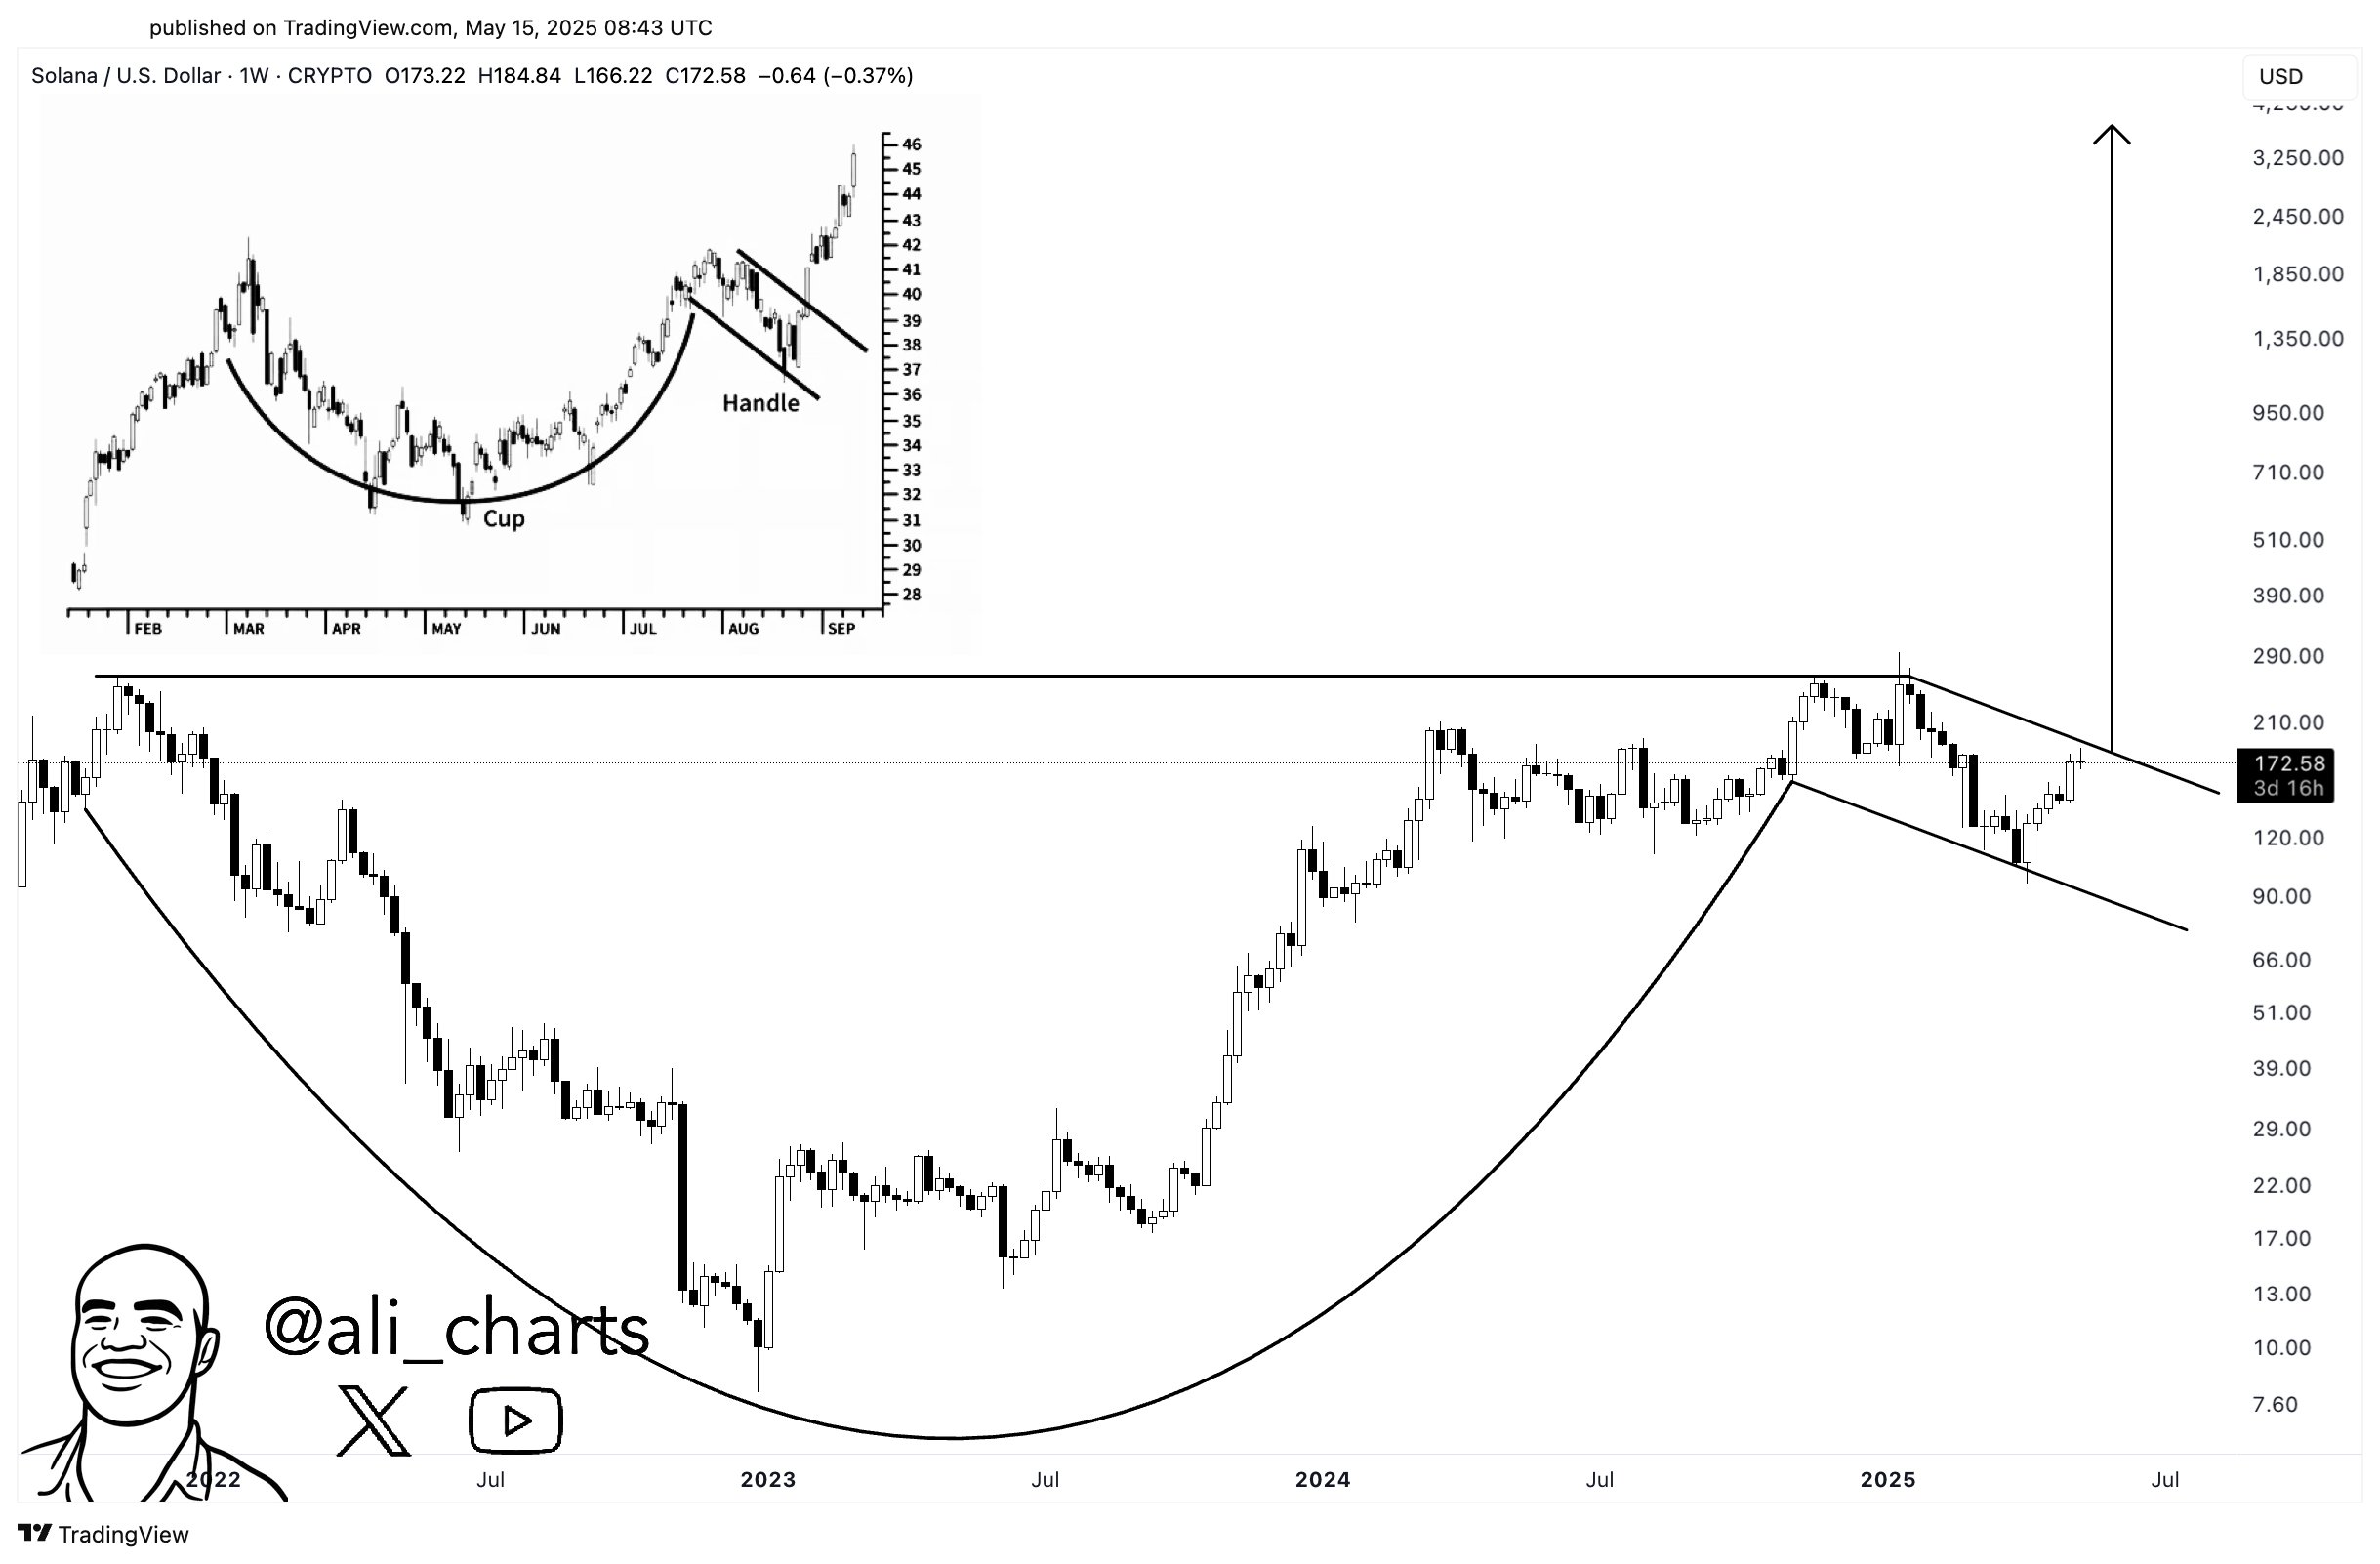
Echoing this bullish sentiment, crypto analyst Ali Martinez recently identified a cup and handle pattern in Solana’s weekly chart. According to Martinez, the handle is forming as a short-term descending channel, with resistance near the $200 level.

If SOL can break above this psychological barrier, the analyst predicts a parabolic move into triple-digit territory.

Image

70% of Binance Traders Expect Breakout Rally

Amid rising anticipation for a breakout, derivatives market activity around Solana has surged. According to Coinglass, Solana’s future open interest has reached $6.83 billion, while the OI-weighted funding rate remains positive at 0.0023%.

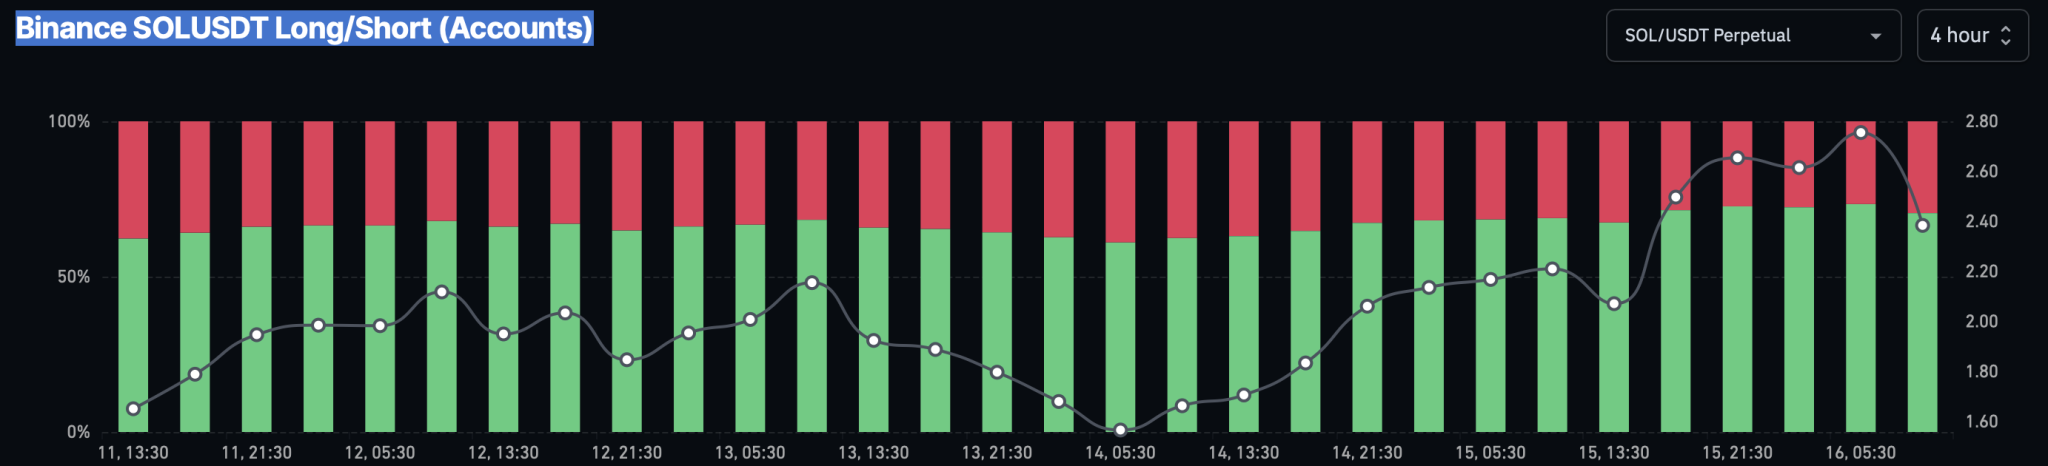
Binance SOLUSDT Long/Short (Accounts)

Binance traders appear highly optimistic about Solana’s price trajectory. The long-to-short ratio for the SOLUSDT pair, based on user accounts, stands at 70.45% long. The overall long-to-short ratio is 2.38, indicating a strong bullish bias. This trader’s optimism could fuel a leverage-driven rally in Solana’s price.

Here’s the Capital Inflow XRP Needs to Reach a $1T Market Cap

XRP might require a small amount of capital inflow to reach the much-coveted $1 trillion market cap.

As the momentum behind XRP Exchange Traded Funds (ETFs) builds in 2025, discussions around the impact of such products on XRP’s valuation are now becoming relevant. 

Notably, a recent analysis by xAI’s Grok suggests that XRP could achieve a $1 trillion market cap with relatively modest capital inflows. However, the analysis assumes there is a large multiplier effect and sustained institutional interest.

Currently, XRP holds a valuation of $140 billion, trading at $2.39 with a circulating supply of around 58.55 billion tokens. The possibility of a spot XRP ETF in the United States has raised questions about how much capital would be necessary to push XRP’s market cap into the trillion-dollar range. 

Capital Inflows Necessary for XRP to Hit $1T Market Cap

Grok, an AI chatbot developed by xAI, answered this question using a market cap multiplier model, which assesses how capital inflows lead to increases in asset valuation.

According to Grok’s analysis, XRP has shown high market responsiveness to inflows, largely attributed to its liquidity and trading volume. For instance, on April 12, 2025, XRP experienced $12.87 million in inflows that resulted in a $7.74 billion increase in market cap. 

This translates to a multiplier effect of about 601x. However, Grok used a 200x multiplier in its estimates to ensure a more conservative and realistic projection.

Meanwhile, XRP would need $860 billion in additional valuation for its market cap to reach $1 trillion. Leveraging the 200x multiplier, the capital necessary to welcome this $860 billion additional valuation would be around $4.3 billion in net inflows. 

Projected XRP Inflow Requirement Grok
Projected XRP Inflow Requirement | Grok

Importantly, if the actual multiplier drops to 100x due to less favorable market dynamics, the inflow requirement will double to $8.6 billion. On the other hand, should XRP continue to maintain a higher multiplier similar to past performance, inflows as low as $1.43 billion might be enough to push it to $1 trillion, which translates to a price of $17.

Interestingly, JPMorgan estimates that XRP ETFs, once approved, could attract between $4 billion and $8 billion in their first year. This range aligns with Grok’s $4.3 billion estimate, making the trillion-dollar milestone potentially within reach if investor interest remains strong.

XRP ETF Prospects

Meanwhile, several recent developments have added momentum to XRP’s ETF prospects. On April 8, Teucrium Investment Advisors launched the Teucrium 2x Long Daily XRP ETF (XXRP) on the NYSE Arca exchange. 

The leveraged product debuted with $5 million in trading volume, ranking in the top 5% of ETF launches in U.S. history. Teucrium has already announced plans to introduce an inverse product depending on investor demand.

In addition, ProShares is set to launch three XRP futures-based ETFs on May 14, after receiving regulatory approval. Notably, ProShares has also filed for a spot XRP ETF, which remains under SEC review.

Internationally, Brazil became the first country to approve a spot XRP ETF. Specifically, Hashdex’s XRPH11 began trading on the B3 stock exchange on April 25. The fund has roughly $40 million in assets under management and allocates at least 95% of its holdings to XRP or XRP-linked products.

In the United States, optimism around regulatory approval is growing. Nine major asset managers, including Grayscale, Bitwise, Franklin Templeton, and 21Shares, have submitted applications for spot XRP ETFs. 

Key decision dates are approaching, with Grayscale’s SEC deadline on May 22, and Franklin Templeton expecting a verdict by June 17. Analysts now predict approvals could arrive in the second half of the year, likely by Q4.

Now, with Ripple having settled its long-running legal battle with the SEC, and the current administration adopting a notably pro-crypto stance, market participants see fewer obstacles ahead.

Dogecoin Eyes $0.35 as Whale Accumulation Signals Bull Flag Breakout

Dogecoin is trading within a bullish flag pattern as whale support increases. Could this propel DOGE into a breakout rally toward $0.35?

The meme coin is up 3.56% today, currently trading at $0.2270, as meme coins bounce back following days of consolidation. Will this short-term rebound push DOGE above the $0.25 level?

Dogecoin Price Analysis Targets $0.35

On the 4-hour chart, Dogecoin shows a pullback within a narrowing range after peaking at $0.25 on May 11. As bullish momentum weakens, DOGE forms lower highs, resulting in a descending trendline. However, strong support around the $0.2183 level has formed a triangle pattern.

Dogecoin Price Chart

The 53% surge in DOGE last week supports the formation of a bull flag pattern. Currently, DOGE is forming a bullish engulfing candle near the baseline, with a 3% gain. This development increases the likelihood of a bullish breakout as the price approaches the flag’s apex.

The recent slowdown in price action pushed the Relative Strength Index (RSI) below the midline. However, a surge in momentum has brought the RSI back to the center, raising the chances of a bullish resolution. Additionally, the MACD and signal lines are nearing a positive crossover in negative territory, supported by a decline in bearish histogram bars.

A potential breakout could push DOGE’s price up by 53%, targeting the $0.3543 level. Conversely, a breakdown below $0.2183 would invalidate the bull flag pattern, with the price at risk of retesting the $0.20 zone.

Analyst Highlights Whale Accumulation and Network Growth

Supporting the bullish outlook, Dogecoin has experienced network expansion and increased whale accumulation over recent months.

According to a tweet by Ali Martinez, whales have acquired more than 1 billion DOGE in the past month, bringing their total holdings to 25.97 billion DOGE. This growing confidence among large holders strengthens the bullish case for DOGE.

Further bolstering the trend, network activity has surged, with transaction volume nearing $549 million and daily active addresses reaching 69.2k.

Together, these metrics enhance the likelihood of a successful bull flag breakout and a continued rally for Dogecoin.

Analyst Predicts When Shiba Inu Price Pump to $0.000033 May Start

0

According to analyst MMBTtrader, the Shiba Inu price pump hasn’t started yet, with real bullish momentum expected only after a confirmed breakout above a descending trendline.

Shiba Inu (SHIB) experienced notable price fluctuations between May 10 and May 16, 2025, trading within a range of $0.00001460 to $0.00001730. Despite several attempts to rally, the token failed to maintain upward momentum. 

These repeated reversals pointed to strong resistance levels and potential profit-taking behavior by short-term traders. 

According to an analyst on TradingView, the market has yet to confirm the start of a true bullish rally, despite the short-term volatility. The technical chart analysis reveals a longer-term bearish structure still in place.

Descending Trendline Maintains Bearish Pressure

The TradingView chart by analyst MMBTtrader highlights a dominant descending trendline that has acted as dynamic resistance since early 2024 after SHIB dropped from the $0.00004 high. This trendline has consistently rejected multiple rally attempts, with price unable to establish higher highs. 

Shiba Inu Price Prediction

Most recently, SHIB tried to surpass the resistance level near $0.000033 but failed, retracing to a local support zone at $0.000010083. The analysis indicates that only a strong breakout above this trendline could signal a shift toward sustained bullish momentum. If achieved, it could lead to increased trading volume and potentially larger bullish candles.

Notably, the trendline resistance currently rests on $0.000026 at press time. However, the asset believes SHIB will remain below it for an extended period, with the dynamic resistance dropping to $0.00002044 by the time it pushes to break above the trendline.

Should a breakout occur, he expects an impressive rally, one placed at $0.000033. This reflects a more aggressive objective, requiring a 121.75% increase from SHIB’s current price of $0.00001488. 

However, the analyst’s commentary is that real bullish candles—accompanied by high volume and a notable price surge—are expected only after SHIB breaks above the descending resistance trendline. Apart from that, he says, “the pump is not even started yet.”

Support Levels Form Key Structural Foundation

The chart also outlines critical support zones. A major daily support area, marked in green between $0.00000582 and $0.00000676, has served as a historic base before SHIB’s earlier climb to $0.000045. 

Another local support, at $0.00001067, has been revisited several times, creating what appears to be a triple-bottom pattern. Such a formation reflects strong buyer interest in the area. 

Whale Activity Rises Amid Retail Exit

Meanwhile, a separate chart from IntoTheBlock presents ownership trends across whale, investor, and retail categories. Over the last 30 days, whale holdings increased by 1.53%, according to the data, while mid-sized investor holdings declined by 4.69%. 

Shiba Inu Historical Concentration Chart

Retail participation also saw a modest drop of 0.47%. This change in distribution indicates ongoing accumulation by large holders, typically seen as a stabilizing force in volatile markets.

Although smaller holders exited, the transfer of supply into stronger hands could potentially reduce short-term sell pressure and support price stability during periods of consolidation.

Cardano Founder Says Midnight Will Bridge, Not Battle, With XRP

0

Cardano Founder Charles Hoskinson recently reiterated that Cardano’s Midnight will cooperate with major ecosystems like Ethereum, Solana, Avalanche, and XRP Ledger. 

During his remarks at Consensus 2025 in Toronto, Hoskinson explained that the new privacy-focused network is built to integrate rather than compete.

Midnight will enable developers to pay transaction fees using native tokens from their own chains, removing the need for asset migration. This model supports interoperability without forcing ideological alignment, to create a callable infrastructure rather than a standalone ecosystem.

This cooperative model, which Hoskinson described as “cooperative economics,” directly challenges the zero-sum mindset prevalent in Web3 development. Rather than attempting to dominate, Midnight seeks to act as a bridge between platforms. 

Privacy Design Confronts Transparency Overreach 

However, according to Hoskinson, technical integration alone does not address the industry’s foundational weaknesses. Notably, the founder also raised another structural issue: privacy.

While the blockchain industry has succeeded in creating transparent and immutable ledgers, he argued that excessive visibility now undermines user security. He cited stablecoins such as USDT and USDC, where every transaction is publicly traceable. This, he said, creates a system resembling financial surveillance.

Midnight’s development was initiated six years ago within Input Output to offer an alternative. It operates as a privacy layer that allows selective disclosure, limiting sensitive financial or medical data exposure. 

Shielded, a newly formed engineering subsidiary, now leads the technical build-out of the network. Additionally, a new coordinating entity, the Midnight Foundation, has been launched under the leadership of Fahmy Syed to manage governance. Through these structures, the network aims to balance transparency with necessary confidentiality.

Airdrop Model Rejects VC Funding

Midnight’s rollout also includes a large-scale token distribution to avoid traditional fundraising methods. Hoskinson identified the third issue in crypto as what he referred to as “Ponzonomics”—tokenomics that disproportionately reward early investors and insiders. 

In contrast, Midnight was funded directly without a venture capital raise or initial coin offering. Instead, a VC-free airdrop known as the Glacier Drop will target 37 million addresses across eight blockchains, including XRP, Bitcoin, and Cardano.

The airdrop will distribute two native tokens: NIGHT, which is used for governance, and DUST, which facilitates private transactions on the network. This distribution strategy reflects an effort to challenge centralized capital flows and support long-term infrastructure development. 

According to Hoskinson, resilient communities must govern blockchain protocols to remain adaptable and relevant. Cardano’s on-chain treasury and community-led roadmap were examples of how such governance models can function during fluctuating market conditions.

Expert Predicts Bold Timeline for XRP to Hit $9

Discussions about XRP reaching a new all-time high have gained momentum recently, as the asset attempts another historic price breakout.

As XRP makes a renewed attempt to approach the $3 mark this week, the move has emboldened some market commentators who continue to issue ambitious projections for where XRP is headed.

In a tweet, the influencer behind “The Modern Investor” sparked a conversation about XRP reaching $9. Specifically, he boldly asserted that XRP would break $9 by September 2025.

He issued this projection with a question, asking investors if they would sell their XRP tokens when the asset claims the $9 mark. With XRP trading at $2.45 today, reaching the $9 target would reward current holders with a 267% gain.

This price would also mark a new all-time high for XRP, bringing it closer to the much-cherished double-digit range. It is worth mentioning that a $9 price puts XRP’s market cap at approximately half a trillion dollars. This development would place XRP in direct rivalry with the valuations of Mastercard and Netflix.

While this may seem like an ambitious outlook, numerous market commentators agree on the possibility of XRP reaching, and surpassing, $9 this cycle.

Industry Voices Calling for XRP $9+ This Year

Recently, market analyst DK64Trades expressed that XRP could “easily” surpass $10 this cycle, dismissing skepticism about higher price targets. He highlighted a stark contrast in XRP’s market dominance: 31.33% during its $3.84 peak in 2018 vs. just 5% at $3.34 in January 2025.

He suggests that if XRP regains its previous dominance, its market cap could hit $1.04 trillion, implying a potential price of $17.80, based on the current $3.33 trillion global crypto market cap.

Meanwhile, market watcher Capt Toblerone projects the crypto market could reach $35 trillion this cycle, with XRP attaining a $1.25 trillion market cap. He also expects Bitcoin’s dominance to fall sharply from over 62% to around 17%, creating room for significant altcoin growth. In this scenario, he anticipates XRP could reach $22 per token.

Beyond charts and market cap speculation, Bitcoin evangelist Davinci Jeremie recently argued that XRP has a good chance of reaching $24 by the end of this year. Jeremie emphasized that XRP is seeing strong political backing from the highest office in the United States, which could influence its price appreciation.

Others with a More Conservative Outlook

While these analysts are confident about XRP’s potential this year, other popular prediction platforms have offered a more extended timeline for when XRP might reach $9.

For instance, Telegaon suggests XRP could hit $9 in 2026, but only in a hyper-bullish market. From 2027 onward, it sees the $9 price as the minimum. Crypto exchange Changelly shares a similar outlook, noting that XRP may not reach $9 until 2028.

Abu Dhabi Bought More Bitcoin Through BlackRock’s IBIT in Q1 2024

0

Abu Dhabi’s sovereign wealth fund, Mubadala, has disclosed increased exposure to Bitcoin in the first quarter of the year through the BlackRock IBIT.

Its Form 13F filing with the US Securities and Exchange Commission on Thursday reveals that the sovereign wealth fund now holds 8,726,972 BlackRock iShares Bitcoin Trust (IBIT) shares valued at $408.5 million as of March 31.

The new figures show a difference of 491,000 in the share amount compared to its Q4 2024 holdings of 8,235,972 IBIT. This confirms that Mubadala leveraged the dip in Bitcoin and IBIT shares to increase its exposure to them.

Abu Dhabi Displays Resilience Despite Turbulence

At the end of last year, its BlackRock ETF stash was worth $436 million. During this period, Bitcoin surged extensively, and investment vehicles tracking its performance followed suit. By December 31, the IBIT shares stood at $54.

However, the crypto market suffered severe downsides in the first quarter of the year, with IBIT’s shares dropping from $54 to $47 as of March 31. The dip saw Mubadala shares’ worth drop from $436 million to $408.5 million despite buying more.

Moreover, its decision to stack more reflects a long-term disposition towards Bitcoin rather than a short-term syndrome. Notably, the shares have surged extensively in today’s market to reclaim $58, with the Abu Dhabi sovereign wealth fund’s holdings now worth over $512 million.

Other 13F Filing Disclosures

Meanwhile, several other companies filed Form 13F with the US SEC on Thursday. For instance, Citadel Advisors disclosed that it holds 3,139,079 shares of IBIT worth $146.9 million, also increasing its stash from Q4 2024.

The investment firm also confirmed exposure to other iShares Bitcoin products, including $366 million in put options and $676 million in call options. This reflects its inclination towards other means of Bitcoin exposure.

The highlight of Thursday’s filings was Wisconsin’s liquidation of its ETF holdings. The State of Wisconsin Investment Board sold all $321 million worth of BlackRock’s IBIT, diverting to other forms of investments. Meanwhile, it still holds $19 million of Coinbase’s COIN stock.

Currently, Goldman Sachs remains the leading IBIT holder, followed by Millennium Management. Other notable holders include Avenir Group and Barclays Bank.