Home Blog Page 756

With a $1M Retirement Target by 2030, Here is How Much XRP You Need to Hold

XRP investors looking to hit a $1 million retirement goal by 2030 would need to procure a substantial amount of the asset at current discounted prices.

The crypto market has a knack for rewarding early investors, as observed with assets such as Bitcoin (BTC), XRP, and even meme coin Shiba Inu, which rallied extensively shortly after they launched. 

Can XRP Engineer Another Explosive Run?

However, with these assets maturing to their current positions, current investors wonder if rallies similar to the ones witnessed in the early days are possible. In fact, some of these investors hope to retire with their current investments, with the $1 million retirement goal featuring prominently.

Notably, for investors with a $1 million goal to retire with XRP in the next five years, the crypto asset would need to appreciate substantially from the current price of $2.13. Interestingly, several sources have projected multiple price goals for XRP by 2030. 

Consequently, The Crypto Basic recently assessed these predictions to evaluate how much an investor must hold to hit the $1 million retirement goal by 2030. For context, these projections come from crypto platforms Changelly and Telegaon, as well as the AI model ChatGPT.

How Much XRP to Hold to Hit $1M Retirement Target by 2030

Specifically, analysts at Changelly expect XRP to begin 2030 with a price of $12.09 in January. They believe the asset could rise to a maximum price of $17.16 by mid-2030. However, their most bullish projection for XRP in 2030 is a price of $20.22 by December 2030.

XRP Price Prediction Changelly
XRP Price Prediction | Changelly

For an investor to hit the $1 million retirement target with this $20.22 price by December 2030, they would have to hold 49,455 XRP tokens. At the current price, these 49,455 tokens cost $105,341. However, at XRP’s price of $0.50 in early November 2024, these tokens were worth $24,727.

Meanwhile, Telegaon analysts are more bullish on XRP. In particular, they predict XRP to trade at an average price of $42.34 by 2030, with a possible maximum price of $48.02. Notably, at this maximum price, an investor must hold 20,820 XRP tokens to hit the $1 million retirement target. Interestingly, these tokens currently cost $44,347.

XRP Price Prediction Telegaon
XRP Price Prediction | Telegaon

Lastly, the AI model ChatGPT suggests XRP has a brighter future than other sources predict. According to ChatGPT, XRP could soar to a price range of $25 to $50 by 2030, especially if the broader crypto market rises to the $20 to $30 trillion range. 

XRP Price Prediction ChatGPT
XRP Price Prediction | ChatGPT

At the higher end of this price prediction, an investor would need to hold 20,000 XRP tokens to hit a retirement target of $1 million. Currently, these 20,000 tokens are valued at $42,600. Nonetheless, if the investor had procured these tokens in early November 2024, they would have only spent $10,000. 
Expert Says Big News Coming for XRP as High-Net-Worth BlackRock Clients Are Seeking More Exposure to Crypto

A tweet from widely followed crypto commentator Altcoin Gordon sparked renewed speculation about BlackRock’s involvement in XRP.

In the post, he claimed to have had lunch with a friend “high up at BlackRock,” who revealed growing interest in crypto, particularly XRP, among ultra-wealthy clients.

High-Net-Worth BlackRock Clients Seeking More Exposure

According to the tweet, individuals with a net worth of $50 million and above are increasingly asking about crypto exposure.

More notably, Gordon hinted that “some HUGE news” related to XRP could be on the way as a result of this. He promised to issue further updates on the subject in follow-up commentaries.

While he failed to provide specific details, his mention of BlackRock has fueled theories ranging from institutional accumulation to potential ETF involvement.

Meanwhile, others have pushed back against the claims, disputing them as false. Commentators argue Gordon’s claim is merely a “Trust me, bro” source, saying BlackRock’s public statements already reflect institutional interest in XRP. They stressed the need to focus on verifiable data, “huge news” discussions.

Community reaction
Community reaction

Deep Anticipation for BlackRock XRP News

Notably, the XRP community has long theorized BlackRock’s involvement in XRP, taking cues from various hints and mysterious factors supposedly connecting XRP and BlackRock. They eagerly seek official confirmation, as they believe BlackRock entering the XRP market could change the coin’s story.

Notably, most significant asset managers listed Bitcoin ETFs have made similar applications for XRP ETFs. Specific names include Grayscale, Franklin Templeton, and Bitwise. Meanwhile, BlackRock’s name remains missing in the picture despite other rivals pursuing XRP investment products in the U.S.

BlackRock’s potential application is highly anticipated due to hopes that its ETF could attract the biggest investments for XRP, as seen with the firm’s Bitcoin and Ethereum spot ETFs.

In perspective, BlackRock’s Bitcoin spot ETF has so far seen investments of $44.25 billion, while Franklin Templeton’s has seen only $250 million after over one year of trading. Likewise, BlackRock’s Ethereum spot ETF has seen $4.2 billion since its inception, while Franklin Templeton’s has only $36.5 million.

Given this landslide gap, some believe the only ETF that would truly matter for XRP is BlackRock’s. Interestingly, industry commentators like ETFStore President Nate Geraci have suggested that BlackRock will eventually join the race. According to him, the firm would fight to dominate the XRP ETF space, not giving rivals a chance.

Regarding when this could happen, some suggest it may occur when the SEC and Ripple reach a full settlement in their case. Right now, both parties are negotiating the terms.

Here’s Dogecoin Price if DOGE Market Cap Hits $500B, $1T, or $2T

0

The recent price surge in Dogecoin has reignited investors’ hopes about its potential rally to valuations like $500 billion, $1 trillion, or $2 trillion. 

Data from CoinMarketCap shows that Dogecoin’s price has soared 3.47% in the past 24 hours, pushing the asset above the $0.17 mark. At the current price of $0.1735, DOGE is up 5.53% from its daily low of $0.1736. As expected, Dogecoin’s renewed rally has reignited investors’ optimism in the premier meme coin’s potential. 

Consequently, some users speculate that Dogecoin could soar to ambitious market caps like $500 billion, $1 trillion, or $2 trillion someday. Based on these projections, The Crypto Basic estimated how much 1 DOGE would be worth if any of these forecasts come to fruition. 

Growth Required for DOGE to Hit $500B, $1T, or $2T Valuations 

With DOGE currently trading at $0.1735 per token, its market cap is $25.89 billion. This makes Dogecoin the eighth-biggest cryptocurrency by market capitalization. 

Notably, DOGE has not reached any of the projected market caps—$500 billion, $1 trillion, or $2 trillion—in its lifetime. It registered its peak valuation of around $88 billion on May 8, 2021, when its price reached an ATH of $0.7376. 

Since then, Dogecoin has failed to revisit the level or attain the $100 billion mark as forecasted by Jake Gagain. Hitting the $500 billion market cap from the current level of $25.89 billion demands a surge of 1,831%. Similarly, Dogecoin’s valuation must grow 3,762% or 7,625% to clinch the $1 trillion or $2 trillion valuations.   

DOGE’s Price at $500B, $1T, or $1T Market Caps 

Notably, the $500 billion valuation translates to a price of $3.35. Similarly, the $1 trillion or $2 trillion valuation would see each DOGE token trade at $6.7 or $13.4, assuming Dogecoin’s supply remains constant at 149.16 billion. 

If DOGE’s price increases to $3.35, $6.7, or $13.4, a portfolio of 100,000 Dogecoins would be valued at $335,000, $670,000, or $1.34 million. It is worth mentioning that these 100,000 DOGE tokens are currently worth $17,350 today. 

When Can DOGE Reach $3.35, $6.7, or $13.4 

According to Changelly analysts, Dogecoin could reach the $3.36 target by October 2033. They expect it to climb further to about $6.7 between 2035 and 2039 and finally clinch the ambitious mark of $13.4 by early 2040. 

On the other hand, Telegaon provided closer timelines for these targets to become a reality. Telegaon prediction platform forecasts that Dogecoin will rise to the $3.35 mark by 2027, six years earlier than Changelly’s timeline. 

The prediction platform expects Dogecoin to reach the $6.7 milestone the following year, and eventually hit the $13.4 target by 2030, five years from today. 

Although these milestones seem ambitious, they illustrate the scale of appreciation enthusiasts expect Dogecoin to reach if DOGE maintains its recent momentum, accompanied by strong retail and institutional demand. 

Analyst Suggests Shiba Inu Price Ready to Explode Over 30%, Says Don’t Sleep on the Dog

0

Crypto analyst MiguelFT Curado has forecasted a potential 30% Shiba Inu price explosion, citing cup and handle pattern. 

According to his TradingView analysis, SHIB may be forming a rounded bottom pattern on the daily chart, suggesting a change from a long-term downtrend into a possible uptrend. At the time of writing, Shiba Inu price trades at $0.00001289, marking a 2.33% increase over the past 24 hours. 

Shiba Inu Price Forms Reversal Pattern Amid Recovery

Per MiguelFT Curado’s chart, SHIB is likely in a rounded bottom formation. This is a technical chart pattern that can suggest a possible end to a bearish phase.

Shiba Inu Price Prediction | TradingView
Shiba Inu Price Prediction

Per the analyst’s chart, after a potential brief decline, the key breakout level appears near $0.00001274. A confirmed break above this could trigger bullish continuation.

If momentum holds, the next projected target is around $0.00001678, which would represent a 30% increase from the breakout point.

The RSI (Relative Strength Index) currently sits near 52, which is considered neutral. However, the downward movement suggests that bearish momentum is possible in the near term, although a reversal might happen soon if bullish pressure resurfaces. 

Market Conditions Support Short-Term Optimism

Despite recent gains, market conditions for SHIB remain mixed. The token has seen a drop in daily trading volume by 2.61%, according to CoinMarketCap. Current volume is $133.6 million, which still indicates moderate investor activity. This volume trend suggests some caution among traders but does not yet show a full reversal of interest.

Data from IntoTheBlock reveals that 59% of SHIB holders are currently “out of the money,” meaning they are holding at a loss. 

SHIB On-chain Metrics

Only 4% are at break-even, while 37% are in profit. The high number of holders at a loss may be contributing to reduced retail interest and cautious market behavior. Still, SHIB’s long-term holding pattern shows that 78% of holders have kept their tokens for more than a year, indicating continued belief in the token’s potential.

Supply Data and Burn Rate Movement Could Impact Shiba Inu Price

Meanwhile, SHIB’s total supply remains at 589 trillion tokens. Burn metrics show mixed trends. In the past 24 hours, only 420,814 tokens were burned, a 97.49% decrease from the previous day’s figure. However, the 7-day burn total reached over 329 million tokens, up by over 350%.

Although the burn rate dropped recently, the weekly total suggests long-term efforts to reduce supply are ongoing. A consistent burn rate may support Shiba Inu price increases over time, especially if demand continues to grow or stabilize. However, the current figures are too small to make any difference.

XRP Remains the Only Top Asset With a Positive Cost Basis in the Past 6 Months: Glassnode Report

0

Data from Glassnode shows XRP is the only high-caliber asset that remains profitable for holders who bought in the last three to six months.

Since this year, the cryptocurrency market has suffered from jet lag, failing to replicate its meteoric rise in the closing stages of 2024. While Bitcoin and XRP trade close to their opening prices, other altcoins have slumped deeper.

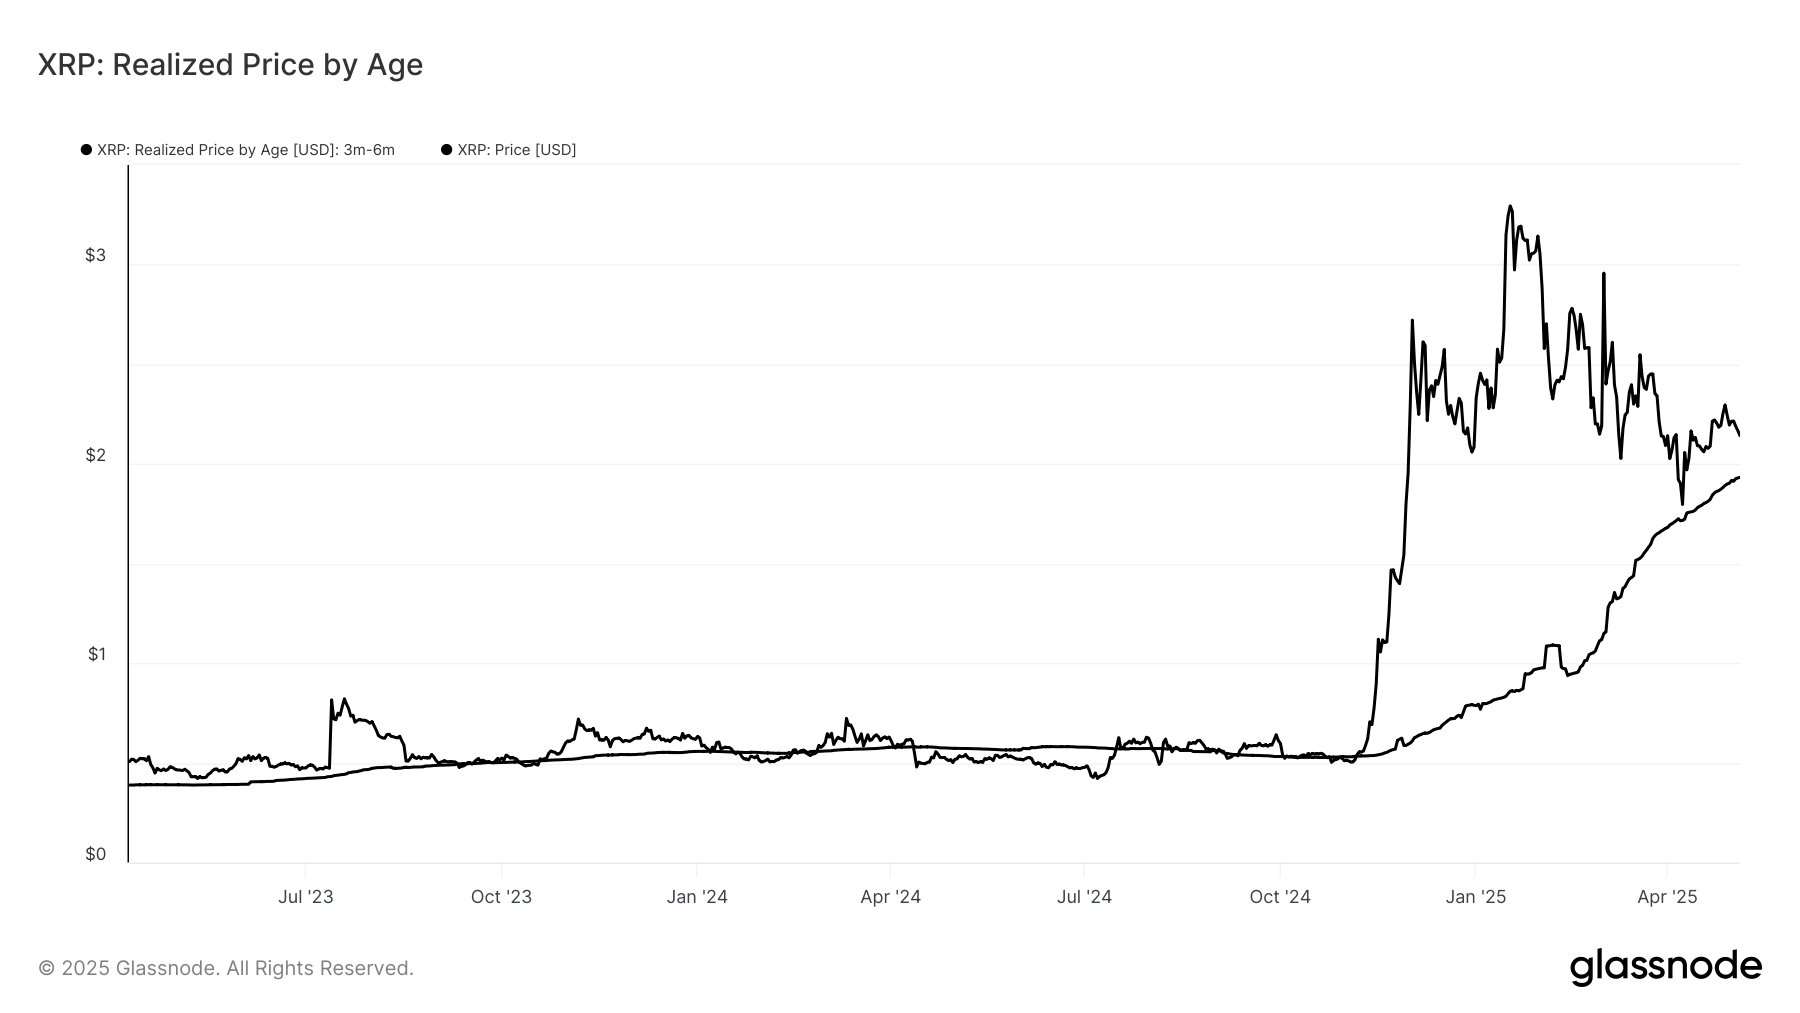
Particularly, XRP has relinquished all its over 35% gains when it rallied to $3.399 in January but is currently up 2% year-to-date. Moreover, recent data suggests it remains profitable to users who have held it for three to six months.

XRP Resilient Despite Market Uncertainties

The Glassnode data, shared in a Tuesday tweet, compared the current prices of four major cryptocurrencies to the cost basis of buyers during the bullish run-up between December and January. The analysis highlighted the mid-term sentiment in the crypto market, drawing reference from portfolio performances of holders between three and six months old.

Notably, the data disclosed that addresses holding major digital assets within this timeframe are nursing considerable losses, except for XRP. This underscores the resilience of the fourth-largest cryptocurrency by market cap, despite unfavorable market conditions.

For perspective, Solana, at $146, trades 28% below the 3-6 month realized price by age trendline, signaling substantial losses for these mid-term holders. Meanwhile, Ethereum looks weaker, with its $1,800 price trending 36% below the average buyer price for this caliber of holders.

Furthermore, while Bitcoin trends slightly below the cost basis at $95,000, it has shown more width than Ethereum and Solana. Moreover, its recent rally past $96,000 could have ensured that 3-6-month-old buyers are now profitable.

Nonetheless, XRP has maintained a mid-term positive momentum, with buyers between December and January in an unrealized profit of at least 11%. The profitability not only diminishes selling pressure among mid-term holders but also presents XRP as a choice asset for new users.

XRP Against 3m-6m Realized Price

General Market Momentum Shows Weakness

Meanwhile, Glassnode emphasized that market trends below the three to six-month cost basis suggest inherent market weakness. The analysis insinuated that the failure to break above mid-term highs indicates a lack of bullish momentum.

Notably, crypto leader Bitcoin, currently facing resistance above $97,000, has remained largely unpredictable. Despite a strong 12.7% rebound from April’s lows, the premier crypto asset has yet to sustain bullish traction as seen during the November and December rallies.

Nonetheless, the asset might be poised to reclaim $100,000 with whales resuming accumulation. For context, Santiment shows that wallets holding between 10 and 10,000 BTC have accumulated 81,338 BTC over the past six weeks as optimism of higher prices intensifies.

Furthermore, with macroeconomic headwinds slowly turning to tailwinds, Bitcoin and the crypto market could rebound extensively. For instance, progress from the US-China trade talks and imminent quantitative easing could catalyze a surge to unprecedented prices.

Shiba Inu Price Breaks a Falling Wedge: Will SHIB Hit $0.000015 Soon?

Shiba Inu breaks out of a falling wedge with a 3% gain. Can SHIB rally to $0.000015? On-chain data and Fibonacci targets suggest a 20% upside.

With a short-term recovery in the crypto market, meme coins are making bullish moves. Shiba Inu, the second-largest meme coin, signals the breakout of a falling wedge pattern.

Currently, Shiba Inu is trading at a market price of $0.00001277, with a price surge of nearly 3% in the last 24 hours. Will this falling wedge breakout rally push Shiba Inu back to the $0.000015 mark?

Shiba Inu Price Analysis

After a quick V-shaped recovery from the $0.00001240 level, Shiba Inu has formed four consecutive bullish candles. This marks a breakout from a long-standing resistance trendline in a falling wedge pattern.

Shiba Inu Price Chart

At this bullish turnaround, the meme coin is now testing the overhead dynamic resistance of the 200 EMA line. This will likely lead to a short-term retest of the recent bullish breakout.

However, the positive crossover in the MACD and signal lines reflects a shift in underlying sentiment. The meme coin will likely surpass the overhead dynamic resistance as the trend reversal gradually gains momentum.

Despite this, the 50 and 100 EMA lines have formed a negative crossover, increasing the risk of a potential “death cross” event between the 50 and 200 EMA lines.

Optimistically, a bullish continuation of the breakout rally could limit the risk of such a death cross event.

SHIB Price Targets

According to trend-based Fibonacci levels, the falling wedge breakout rally could reach the 23.60% level at $0.00001344 if it surpasses the 200 EMA line. Currently, the 200 EMA line stands at $0.00001297.

Generally, the breakout of a falling wedge pattern leads to a price surge toward the previous swing high. Based on the Shiba Inu price trend, the previous swing high is just above the $0.000015 psychological mark.

Therefore, based on the falling wedge breakout and Fibonacci levels, the uptrend could target the 61.80% level at $0.00001531, highlighting an upside potential of nearly 20%.

However, if the market loses momentum, Shiba Inu could retest the $0.00001240 level, and a potential breakdown could bring it back to the $0.00001156 support.

On-Chain Data Signals Extended Recovery in Shiba Inu

According to data from IntoTheBlock, the Shiba Inu price recovery shows strong potential to reach the $0.000015 psychological mark. Based on the In/Out of the Money Around Price indicator, Shiba Inu is currently trading in a zone around $0.000013, which is a key level for price movement.

As the uptrend gains momentum, Shiba Inu faces a supply zone, where approximately 12.11 trillion SHIB is held across 18,320 addresses. In contrast, the current price zone around $0.000013 holds 11.26 trillion SHIB across 16,250 addresses.

Furthermore, the demand zones—areas where SHIB holders are in profit—show a significantly higher volume. This suggests increased buying pressure, which could boost the chances of a continued bullish trend.

IntotheBlock

As the uptrend continues, the upcoming supply zone in Shiba Inu holds weaker volume, increasing the likelihood of a bullish trend ahead.

3-Year Symmetrical Triangle Signals Shiba Inu Heading Toward $0.0001

0

TradingView analyst BITfinity highlights a potential breakout for Shiba Inu as it approaches the apex of a multi-year symmetrical triangle.

Notably, Shiba Inu has traded within a narrow range between $0.000012 and $0.000013 over the past week. While there was brief intraday volatility, the broader trend has been downward.

A notable dip on May 6 marked a short-term low, followed by a modest bounce on May 7. However, this movement failed to reverse the prevailing bearish sentiment.

Amid this consolidation, an analyst is now focusing on a larger technical setup that spans 3 years, suggesting a potential shift in long-term momentum.

Shiba Inu Potential Breakout as Triangle Apex Nears

According to a weekly chart shared by BITfinity, an extended symmetrical triangle pattern that began forming after Shiba Inu’s all-time high of $0.0000884 in October 2021 is nearing its apex. 

Shiba Inu Price Prediction

This structure comprises a descending resistance trendline connecting a series of lower highs and a steady support level at approximately $0.00001. Since then, the price has compressed gradually within the triangle, indicating a prolonged period of decreasing volatility.

Resistance has repeatedly pushed back bullish attempts, most notably in December 2024 when SHIB approached $0.000032 but fell back to the support just above $0.00001.

Before that, in March 2024, the price briefly surged to around $0.000045, but momentum failed to sustain, pushing SHIB back to the same support. 

This support has consistently held, with the lower trendline acting as a firm base throughout the downward retracements.

As the triangle’s apex nears, the chart now outlines a speculative breakout path, targeting initial resistance at the 50-day simple moving average (SMA 50), positioned near $0.000017. 

If surpassed, the path projects a series of higher highs and higher lows, with a mid-term target of $0.00005 and a longer-term target of $0.0001. A surge from the current $0.000012 to $0.0001 represents a 733.33% increase.

Long-Term Holders Expand as Speculative Activity Declines

Elsewhere, data from IntoTheBlock highlights an increase in long-term SHIB holders. The metric tracking addresses holding Shiba Inu for over one year has risen by 1.46%.

Shiba Inu Ownership Chart

In contrast, short-term traders (under one month) and medium-term holders (one to twelve months) have declined. Specifically, traders dropped by 6.88%, while cruisers fell by 4.45%.

This transition suggests a redistribution phase, where speculative interest wanes while committed holders remain. These shifts in ownership behavior are contributing to lower sell-side pressure.

With fewer active traders in the market, sudden swings from large-scale liquidations or short-term profit-taking diminish, which may provide a more stable base if bullish momentum emerges.

Gradual Shift Toward Long Bias

Complementing on-chain data, a CoinGlass chart analyzing the SHIB OI-Weighted Funding Rate from early April to early May shows signs of market resilience.

Despite several dips in funding that typically reflect negative sentiment, SHIB’s price held above the key support level of $0.00001. 

SHIB OI-Weighted Funding Rate

Short sellers failed to push the price lower, even amid multiple bearish cycles in the derivatives market. Notably, the funding environment has now begun to favor long positions. This shift suggests improving sentiment, a typical precursor of bullish momentum.

Bitwise Reveals What Drives XRP’s Value Within the XRP Ledger and Ripple Ecosystem

0

Prominent asset manager Bitwise Investment has addressesd burgeoning concerns about XRP’s real use case in the XRP Ledger and Ripple ecosystem.

WrathofKahneman (WOK), an influential figure in the XRP community, shared a Bitwise report highlighting the “clear, succinct, and relevant” description of XRP’s role in the Ripple ecosystem. The piece deeply explains XRP as a digital asset and what drives its value.

XRP’s Three Major Functions and Impact on Valuation

First, Bitwise highlighted the difference between XRP, the XRP Ledger, and Ripple. For context, the XRP Ledger is a blockchain running with the proof of authority consensus, built to enable swift and efficient payments.

Meanwhile, XRP is the native token of the XRP Ledger, and Ripple is a private company that acts as one of the contributors of the XRP Ledger, leveraging the network and its native token XRP for its cross-border payment business.

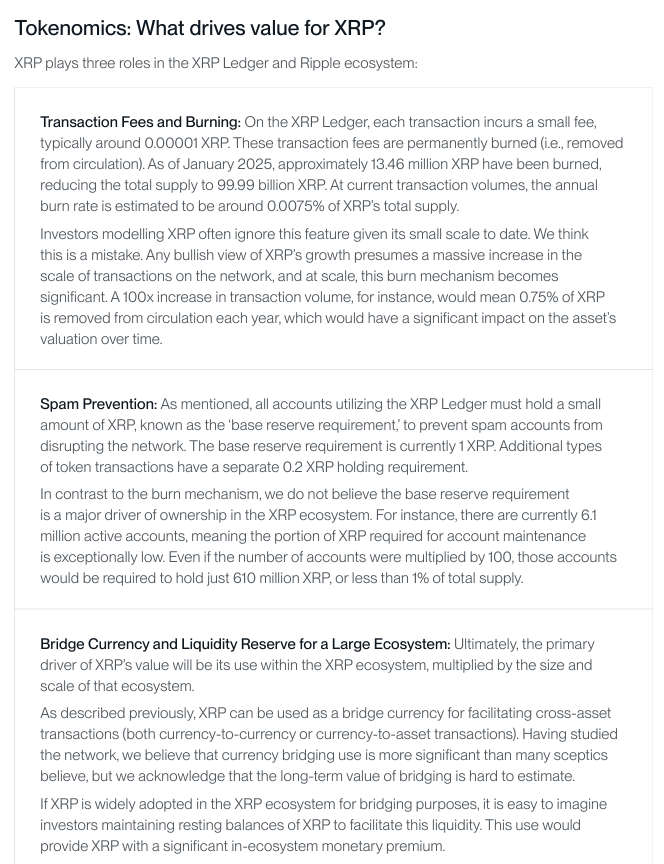
Furthermore, the piece stressed three key roles that XRP plays in the ecosystem and how it derives its value. First, as the native token of the XRPL network, users pay fees for each transaction in the digital asset.

Remarkably, the XRP Ledger is programmed to burn realized transaction fees permanently, effectively reducing the asset’s total supply. At the reporting time, this mechanism has effectively incinerated 13.85 million XRP, cutting the supply to 99.986 billion XRP. Notably, the current transaction volume’s annual burn rate is 0.0075% of XRP’s total supply.

Now, how does this drive XRP’s price? With the Q1 2025 transaction count on the XRP Ledger averaging 1.17 million per day, an increased number will consequently impact the XRP burn rate.

Bitwise emphasized that a notable surge in the adoption of the XRPL blockchain will make the burn rates more significant. For instance, a 100x growth in volume will increase annual incineration rates to 0.75% of XRP’s total supply, which could impact prices in the long term.

Spam Protection and Bridging Utility

Secondly, the report shared that XRP has utility as spam protection for the XRP Ledger. To avoid the creation of multiple junk accounts on the network, the network placed a base reserve requirement of 1 XRP. Notably, the initial requirement was 10 XRP before the December 2024 amendment, which slashed the minimum balance by 90%.

Meanwhile, Bitwise noted that the base reserve requirement is not a notable driver for XRP’s ownership or demand. With about 6.1 million active addresses on the Ledger, the portion of XRP locked in for account maintenance would have minimal impact on supply, even with a 100x increase.

Finally, the exposition mentioned XRP’s bridging currency status as its most important function in the ecosystem and the one it sees as a major driver for the asset’s price.

With Ripple’s core business tied around large-scale currency-to-currency and currency-to-asset bridging through the XRP Ledger, XRP’s adoption as a central bridging asset would encourage institutional clients to hold XRP, significantly impacting supply and prices.

Excerpt from Bitwise XRP Report

Interestingly, Ripple is planning to compete with SWIFT, the largest payment messaging solution in the world. Analysts have predicted that if the financial technology firm processes just 15% of SWIFT’s daily transaction volume, its prices will explode to $25.68.

Nonetheless, XRP’s utility as a central bridging asset faces shared attention from the Ripple USD stablecoin launched in December. While Ripple has assured that the dollar-pegged token will not replace XRP, it will impact the number of transactions processed with the XRPL native token.

Cardano Price Recovery Targets $0.83 Amid $4.46 Million Short Liquidation Risk

Cardano rebounds to $0.6784, breaking key Fibonacci levels. Could ADA hit $0.73 amid improved market sentiment?

As Bitcoin momentarily gains the $97,000 mark, altcoins like Cardano have surged by nearly 4%. Currently, the ADA price stands at $0.6784, witnessing a massive overnight comeback.

As the uptrend in Cardano gains momentum, the bulls have reclaimed the recently lost $0.67 high-volume zone. Will this reversal in Cardano’s price help it surpass the $0.72 decline?

Cardano Price Analysis Signals Potential Breakout Rally

Cardano’s price has made a bullish comeback from a strong support trendline on the 4-hour price chart. Coinciding with the support trendline, the 50% Fibonacci level has helped Cardano regain bullish strength.

Cardano Price Chart
Cardano Price Chart

With three consecutive bullish candles, the recovery in ADA’s price has surpassed the 61.80% Fibonacci level at $0.6732. The key Fibonacci resistance breakout also marks the breakout of a high-volume zone.

This high-volume zone had provided strong support for Cardano in late April. However, the recent breakout signals a V-shaped reversal in the ADA price trend, as well as a falling wedge breakout.

As Cardano sustains above the 61.80% Fibonacci level, buyers anticipate an upside move towards the $0.7292 resistance. This critical resistance has kept the Cardano price under check since late April.

The positive crossover in the MACD and signal lines supports the bullish outlook. According to Fibonacci levels, a potential breakout could reach the 1.272 level at $0.8372.

On the flip side, the crucial support remains the ascending trendline and the 50% Fibonacci level at $0.6437.

Derivatives Market Warns of Sharp Moves Ahead for Cardano

With the bullish recovery in Cardano, the derivatives market has witnessed stability in Cardano’s Open Interest. Since late April, according to Coinglass, Cardano’s Open Interest has sustained around the 700 million mark, currently at $735 million.

The funding rate also remains positive at 0.0065%. The derivatives market shows underlying bullish confidence with a positive funding rate and stable Open Interest.

Notably, with growing optimism, a potential surge in ADA’s price to $0.692 could result in massive short liquidations amounting to $4.46 million. This includes $427K from Binance, $232K from OKX, and $514K from Bybit.

Cardano Liquidation Map

On the flip side, a potential correction to $0.664 would result in intense long liquidations of $5.75 million. Therefore, the liquidation map reflects a double-edged position for Cardano, while the open interest and funding rate indicate a marginally bullish condition.

Here’s How Much Shiba Inu You Need to Become a Millionaire at $0.0001 and $0.001

0

Investors seeking to become millionaires through investment in Shiba Inu must hold a substantial amount of SHIB if the price hits $0.0001 or $0.001. 

Many people pursue becoming millionaires in U.S. dollars for financial freedom. Achieving this status allows individuals to cater to their needs without worrying about money.

While some inherit their wealth, others achieve this goal through self-effort by following specific strategies. These include investing early in assets with high growth potential.

People often commit portions of their income to investment vehicles like real estate and stocks. However, due to the slow pace at which these assets generate returns, many consider cryptocurrencies like Shiba Inu a viable means of reaching millionaire status.

This mindset is fueled by Shiba Inu’s historical performance, particularly during the 2020/2021 market cycles, when many investors became overnight millionaires.

Investors Still Optimistic Despite Shiba Inu’s Underperformance 

While many expect Shiba Inu to replicate its 2021 performance in this cycle and reach jaw-dropping targets like $0.0001 or $0.001, others are skeptical due to SHIB’s recent price action.

For context, Shiba Inu, which surged to a multi-month high of $0.00003329 on December 8, 2024, is currently down 61.76% from that level, trading at $0.00001273.

Since its December peak, Shiba Inu has struggled to stage a major rebound. For weeks, its price has hovered between $0.000011 and $0.000013. However, investors remain optimistic about its prospects.

Some hope that if the price rises to targets like $0.0001 or $0.001, it will propel them to millionaire status.

Shiba Inu Road to $0.0001 and $0.001 

Reaching the $0.0001 and $0.001 targets would mean Shiba Inu eliminates one or two zeros from its current price.

Recall that Shiba Inu came close to hitting the $0.0001 target in October 2021, when it reached an all-time high of $0.00008845. However, the coin has since dropped significantly from its ATH, down 85.6% at its current price.

To reach the $0.0001 target, Shiba Inu would need to rise 685.54% from its current price of $0.00001273. Similarly, the $0.001 target would require a surge of 7,755%.

The $0.0001 and $0.001 targets would translate to market valuations of $58.92 billion and $589.25 billion, respectively.

Predictions for SHIB to Reach $0.0001 and $0.001 

Interestingly, several analysts, like Eunice Wong, believe that the $0.0001 target is within reach for Shiba Inu, with the expert speculating that SHIB could clinch the target this year. 

Similarly, a Forbes report indicated that Shiba Inu would rise to the $0.0001 target during this cycle. However, Changelly projects that the $0.0001 target would not materialize until September 2029, four years from now. 

Furthermore, Changelly also predicts that Shiba Inu could reach the $0.001 milestone between 2035 and 2039. However, TradingView analyst Krao forecasted that the $0.001 price target would materialize sooner than Changelly’s timeline. The analyst expects SHIB to hit the ambitious target this year. 

How Much Shiba Inu Is Required to Become a Millionaire at $0.0001 or $0.001

Amid these projections, to become a Shiba Inu millionaire at $0.0001, an investor must hold at least 10 billion Shiba Inu tokens. At the current price of $0.00001273, investors can procure these 10 billion SHIB tokens for $127,300. 

However, those seeking to become millionaires if SHIB clinches the ambitious $0.001 milestone would require fewer tokens. Becoming a millionaire at $0.001 through SHIB investment demands a holding of 1 billion tokens. At the current price, these 1 billion Shiba Inu tokens cost $12,730. 

Despite how enticing this analysis might seem, it should not be taken as investment advice. Investors must conduct due diligence to assess whether investing in Shiba Inu is appropriate.