Home Blog Page 774

World Mobile CEO Says Nobody is Better To Drive Cardano Than Hoskinson, Its Crazy Not to Back Him

0

Micky Watkins, the CEO of World Mobile, publicly endorses Charles Hoskinson and Input-Output Global (IOG) as the best stewards for Cardano’s future. 

In a recent X post, Watkins, known as Mr. Telecom, endorsed the Cardano founder and his company. According to him, Hoskinson and IOG are better suited to drive Cardano’s growth than any other entity. 

This highlights Watkins’s belief that Hoskinson and the IOG have the expertise and technical vision to drive the growth of the broader Cardano ecosystem. Watkins’ endorsement comes days after several community members criticized Hoskinson’s request for additional funds. 

Hoskinson Requests Additional Funds to Drive Cardano Growth 

In a livestream over the weekend, the Cardano founder revealed that he and the IOG have been working for free since 2020. He said the original contract that started with the Genesis block in 2015 expired in 2020. 

However, he noted that he has been working alongside the IOG to keep development rolling since 2020, even without receiving pay. Hoskinson emphasized that the scaling requirement, as detailed in the original contract, is complete, adding that the functionality is now transcending into a moving target. 

Nonetheless, he stated that the Cardano development team is still working to advance other scaling solutions, particularly around Hydra and Leios. In his view, these projects might encounter significant setbacks if the IOG does not receive additional funding. 

Therefore, he proposed that the community, particularly the elected delegate representatives (DReps), approve a budget package that would ensure the IOG continues as the developer of the Cardano project. 

Hoskinson said the funds would be used to fund the IOG’s vision, adding that it will also ensure that the community gets his time and strategy. The development comes a week after IOG requested 26.848 million ADA, worth $19.39 million at the current price of $0.7196, for a 12-month research and development program.  

It is worth noting that Hoskinson hosted the livestream following a strong debate over an interim budget expected to be funded by the ecosystem’s treasury. 

DReps to Decide Whether to Allow IOG to Continue as Cardano Core Developer 

The DReps must reconcile and approve this interim budget before Cardano’s first on-chain fiscal year ends. For context, the Cardano treasury wallet holds about 1.7 billion ADA coins. Earlier this year, 72% of DReps voted to cap the forthcoming reconciliation at 350 million ADA. 

While Hoskinson applauded the move at the time, he clarified that the DReps are in the position to decide whether to keep the IOG at the helm of Cardano’s development. Meanwhile, critics argue that continuously leaning on IOG contradicts the ethos of decentralization. 

As this criticism soars, Watkins has urged the community to back Hoskinson and his company, praising them as the most suitable stewards for Cardano.  

Analyst Expects XRP Surge from $27 to $120: Here’s Why

0

A prominent market analyst says he now firmly believes XRP is following its 2017 fractal, suggesting it could soar to a three-digit price from his initial target.

This commentary came from EGRAG Crypto, a seasoned analyst, and XRP permabull. Notably, the analyst had persistently suggested that XRP could be following its 2017 pattern, which saw it soar to the $3.8 all-time high price by January 2018. 

However, his latest analysis indicates that he is now more convinced that this pattern is playing out nicely. For context, the 2017 price action saw XRP soar 6,319% from $0.0062 in March 2017  to an initial peak of $0.3988 in May 2017. After this run, XRP saw a pullback and consolidation before resuming the upsurge to hit $3.8 in January 2018.

XRP Following 2017 Fractal?

Interestingly, it appears the asset is following this fractal, having surged 578% from $0.5 in November 2024 to $3.39 in January 2025. Like in 2017, this initial surge met resistance, leading to a pullback, with XRP consolidating within a range for three months now.

With this recent price action, EGRAG now firmly believes XRP is repeating the 2017 price movements. This suggests that another leg up might be on the horizon. However, in his commentary, the market analyst admitted that while XRP could follow the 2017 fractal, it might face a delay or acceleration in the timing.

Further, data from his chart shows that XRP is currently trading within a 5-wave Elliott Wave structure. For context, the asset began this structure last November, with the rally to $3.39 in January 2025 aligning with the end of Wave 1. 

XRP 1M Chart EGRAG Crypto
XRP 1M Chart | EGRAG Crypto

Meanwhile, the correction from this $3.39 peak pushed XRP to Wave 2, with the altcoin currently trading within this wave. EGRAG’s chart indicates that the third wave, which would begin when XRP engineers a rebound push from this correction, could lead to substantial gains. 

EGRAG Sees XRP Surpassing $27 to $120

According to EGRAG’s chart, Wave 3 could end with XRP reaching a target of $27 this summer (between June and September 2025). Interestingly, the market analyst has consistently championed this $27 target, citing varying catalysts. Last December, he suggested XRP could reach this price once its 21 EMA crosses above what he called the Break of Structure (BOS). 

However, EGRAG’s latest commentary suggests the $27 mark is not his ultimate XRP target. The chart shows XRP could potentially collapse from the $27 mark to as low as $5 during the fourth wave. According to him, this fourth wave would play out over the next three years, leading to a bear market.

Nonetheless, a recovery would ensue with the fifth and last wave. His chart suggests this fifth wave could push prices beyond the $27 peak to a new all-time high of $120. Notably, the $120 ambitious target would mark a massive 5,072% increase from the current XRP price of $2.32. Interestingly, at $120, XRP’s market cap would soar to around $7 trillion.

Major Ethereum Breakout Imminent: Bulls Set Their Sights on $2,500

Ethereum approaches major resistance at $1,865 amid resurging institutional support. Can ETH break through to $2,489?

Ethereum is gradually gaining momentum as Bitcoin holds the $94k level. Currently, Ethereum is trading at $1,799, rising from its 24-hour low of $1,753.

The biggest altcoin faces strong overhead resistance, with the confluence of multiple bearish factors. Will the bullish struggle near $1,864 lead to a positive outcome?

Ethereum Price Recovery Faces Multiple Bearish Challenges

Ethereum’s price trend on the daily price chart shows a bullish recovery run, challenging a long-standing resistance trendline. The recovery accounted for a nearly 13% surge last week.

Ethereum Price Chart

However, the bulls face strong resistance near the $1,850 supply zone, extending to the 23.6% Fibonacci level at $1,864. This has led to a sudden halt in the bullish trend. Moreover, the drop in momentum warns of a potential negative crossover in the MACD and signal lines.

Along with the supply zone resistance trendline and the key Fibonacci resistance, the declining 50-day EMA at $1,865 serves as a crucial resistance level.

As the recovery faces a high supply pressure area, a potential breakout could unleash trapped momentum.

Derivatives Traders Anticipate Breakout Run 

Despite the strong overhead resistance, the derivatives market shows traders anticipate a major breakout rally. According to Coinglass, long positions are increasing.

Over the past 8 hours, long positions have increased by 51.47%, pushing the long-to-short ratio above the 1 threshold.

Ethereum Long/Short Ratio Chart

Pectra Upgrade And Rising Ethereum Buyers

The broader market sentiment for Ethereum is gradually improving with the upcoming Pectra upgrade on May 7. If the Pectra upgrade is successful, the Ethereum network will likely witness a spike in mass adoption. 

With the new upgrade, the network will witness faster transactions, lower gas fees, a boost in scalability, and a potential boost in its ecosystem. As the Pectra upgrade nears, large entities are acquiring major amounts of Ethereum. 

After eight consecutive weeks of net outflow, Ethereum ETFs have finally turned green. According to SoSoValue, the resurgence of institutional investment resulted in a weekly total net inflow of $157 million last week. 

Ethereum ETFs
Ethereum ETFs

On Friday, April 25, the daily total net inflow stood at $104 million, with BlackRock recording an inflow of $54.43 million. BlackRock holds $2.18 billion worth of Ethereum, reflecting a strong confidence in the biggest altcoin.

Recently, a whale purchased 30,000 ETH worth $54 million in an over-the-counter deal on Wintermute. Additionally, the hacker behind the Bitrue incident recently sold $2.88 million worth of HOT and SHIB tokens.

The hacker later purchased 1,511 ETH tokens at an estimated price of $1,911. The hacker has also sent 1,050 ETH through Tornado Cash and continues to hold 16.34 million DAI tokens and 5,111 ETH tokens in a different wallet.

Ethereum Price Targets

As the broader market sentiment for ETH improves, the price analysis highlights significant upside potential for ETH. If the uptrend surpasses the 50 EMA line near $1,865, the bulls will likely target the 200-day EMA line.

Currently, the 200-day EMA stands at $2,489, slightly closer to the 50% Fibonacci level at $2,424. Therefore, a potential breakout could unlock an upside potential of nearly 40% for ETH prices. Conversely, the crucial support remains at the $1,500 psychological mark.

Bitcoin Holds Above 78.6% Fibonacci Level: Can Bulls Push Past $106k?

Bitcoin maintains strength above $91,780, the 78.6% Fibonacci level, hinting at a potential bullish continuation. Can BTC set a new all-time high soon?

After a 10% jump last week, Bitcoin trades at $94,000, with a bullish start to the week. Bitcoin records an intraday recovery of 0.33% after forming a 24-hour low at $92,846. 

Will this short-term recovery prolong the prevailing bullish trend for a new all-time high?

Bitcoin Price Analysis

In the daily chart, the double bottom breakout rally in Bitcoin price trend has surpassed the 78.60% Fibonacci level at $91,780. At present, after the short consolidation, Bitcoin hints at a continued bull trend. 

Bitcoin Price Chart
Bitcoin Price Chart

The overall recovery has nullified the chances of a “Death Cross” between the 50 and 200 EMA lines. Additionally, the positive turnaround in the 50-day EMA line is ready to surpass the 100-day EMA line for a positive crossover, signaling a potential bullish extension. 

However, due to the short consolidation, the MACD and signal lines witness a minor pullback in trend momentum. This leads to a declining trend in bullish histograms, increasing the possibility of a negative crossover. 

Based on the Fibonacci levels, a post-retest reversal from the 78.60% level will hit the $106,000 mark. In case of a breakout rally, the new all-time high for BTC could scale to $127,800 at the 1.272 Fibonacci level. 

On the other hand, support for BTC under $91,780 stands at the 100-day EMA at $88,244.

Analyst Spots Multiple Bullish Factors Supporting BTC Bull Run

Analyst Ali Martinez has highlighted an increased demand for Bitcoin in the market, likely to drive the bullish trend. In his recent tweet, Martinez shared Glassnode data highlighting that nearly 100 entities holding more than 1,000 BTC have joined the network since late January.

Image

With the entry of new Bitcoin investors, the Bitcoin accumulation trend score is approaching the upper ceiling of 1. This signals intense accumulation and growing confidence among strong holders.

Furthermore, U.S. Spot Bitcoin ETFs have recorded massive inflows over the past week. The net inflow for the last week stood at 31,324 BTC, marking the highest weekly total since November. The surge in demand will fuel market prices as institutions are back to acquire more Bitcoin.

Derivative Traders Remain Hopeful This Week

Over the past 8 hours, long positions in Bitcoin derivatives have significantly increased. According to Coinglass, long positions now account for 53.74%, boosting the long-to-short ratio to 1.16%.

With the increased long positions, the growing bullish interest in Bitcoin supports the funding rate. Currently, the funding rate stands at 0.0038%, reinforcing the bullish narrative. As a result, derivative traders anticipate an extended uptrend this week.

Screenshot 2025 04 28 at 111414 AM

Expert Says If You Don’t Have an XRP Plan, You’ll Be Reacting Under Pressure

Black Swan Capitalist co-founder Vandell Aljarrah has boldly warned market participants against underestimating XRP.

He argued that skeptics could be putting themselves at a disadvantage in the future without strong XRP plans. Aljarrah expressed this perspective in a recent tweet, suggesting that the next significant move for XRP will be swift. According to him, the pressure of reacting on the fly could prove costly for those without a clear plan.

Meanwhile, Aljarrah also touched on the XRP Ledger, arguing that its value as a settlement layer will become increasingly evident over time.

XRPL’s Value to Be Evident Over Time

The XRP Ledger is designed for fast, low-cost transactions and is already being tapped as a tool for large-scale adoption in cross-border payments.

A more recent case is Ripple’s takeover of Hidden Road, a financial institution that processes $3 trillion in annual volume. The announcement noted that XRPL will henceforth be the tool for Hidden Road’s post-trade transactions. XRPL will improve the initial 24-hour settlement times to just five seconds.

Now, pundits like Aljarrah believe that as more institutions and enterprises begin to recognize the potential of XRPL for seamless transactions, its role as a settlement layer will cement itself over time.

XRP Next Move to Be Instant, Leaving Little Room for Reaction

Meanwhile, Aljarrah believes XRP’s next major move will occur instantly. This bold suggestion raised eyebrows among community members. Specifically, one commenter sought clarification about the justification for XRP’s next move being dramatic. Aljarrah replied that it would be due to an influx of liquidity.

Notably, several key factors could contribute to this influx of liquidity, leading to the rapid rise in XRP’s price. These include the launch of spot ETFs, institutional strategies investing in XRP as seen with other assets, Ripple’s regulatory developments, and partnership announcements.

XRP proponents like Aljarrah believe that the potential impact of these developments on XRP’s price could leave those on the sidelines with insufficient time to react. 

Community commentator Del Crxpto has even argued that investors have until Ripple releases a new plan for XRP in its escrow to accumulate the asset cheaply, as the news could send XRP soaring.

“No Second Chances”

Likewise, crypto founder Edoardo Farina recently warned that XRP’s potential moonshot will offer no second chances for skeptics. His remarks came in response to speculation that President Trump could soon unlock one $150 trillion fund allegedly hidden in a secret trust since 1873.

Former CIA advisor Jim Rickards claims this fund could drastically reshape the financial landscape. Echoing this sentiment, Farina urged investors to get on board with XRP or risk missing out when its value skyrockets.

Meanwhile, critics dismissed these claims, calling them baseless and accusing promoters of exploiting the situation. Essentially, ambitious suggestions from XRP proponents remain speculative, as XRP’s bull momentum closely aligns with the broader market optimism.

This Shiba Inu Price Trendline Breakout Could Take SHIB to $0.00003: Analyst

0

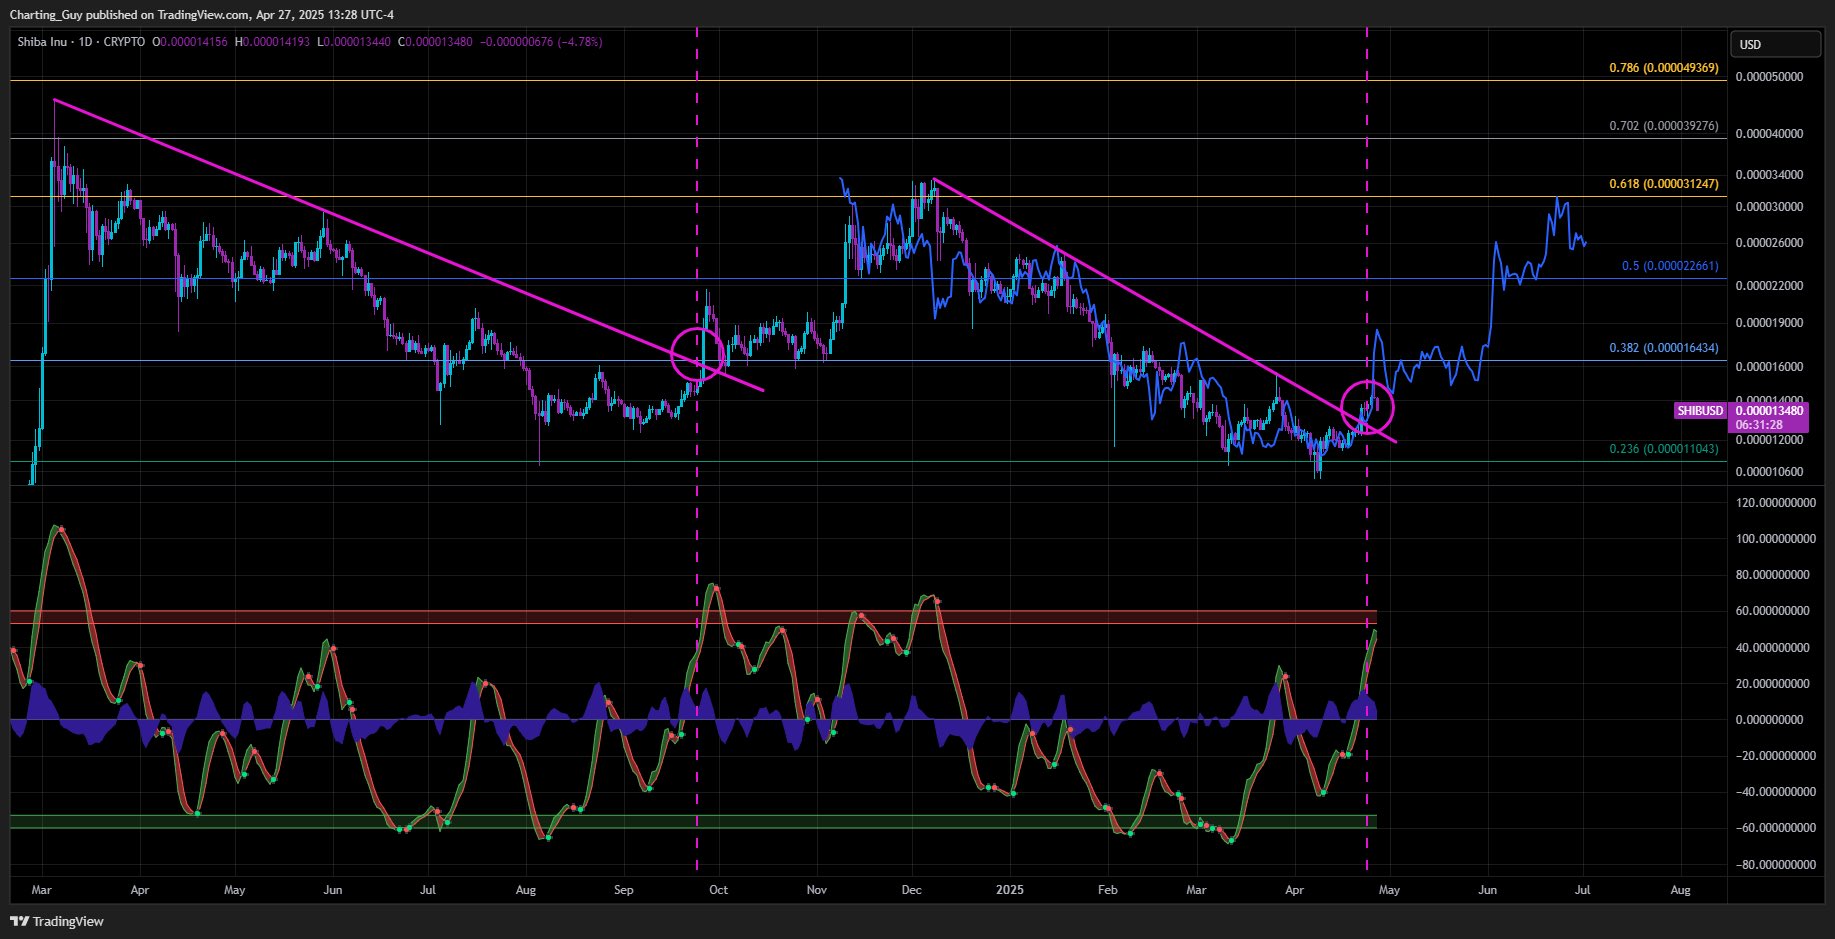
Technical analyst Charting Guy has identified a Shiba Inu price trendline breakout, possibly taking SHIB to December levels.

Shiba Inu recently witnessed a notable shift in its technical setup, following a steady price climb that began around April 22. After bottoming slightly above $0.00001, SHIB advanced to a high near $0.00001510 by April 26. The price then experienced a subsequent retracement toward the $0.0000135 range as of today. 

However, key technical observations suggest that SHIB may be forming a base for larger moves, supported by trendline breaks and strengthening oscillator signals.

Major Descending Trendlines Breached

Notably, an analyst on X, Charting Guy, outlined the significance of two descending trendlines that governed SHIB’s action throughout 2024 and early 2025.

The first major downtrend initiated in March 2024, resulting in a series of lower highs and lower lows. SHIB eventually broke above this initial trendline in late 2024, leading to a price spike that hit $0.000031.

Following this breakout and price spike, another descending trendline formed as selling pressure persisted into 2025. However, in mid-April 2025, SHIB breached this second resistance, suggesting a potential shift in market dynamics. 

Image

Previously, SHIB attempted to break above the trendline at $0.000026 and just below $0.000016, but lacked sufficient bullish momentum to maintain those moves. However, Charting Guy believes Shiba Inu has overcome this trendline in this recent attempt.

Now, the analyst points to a new target above $0.00003, aligning with the 0.618 Fibonacci retracement zone last observed in December 2024.

Supporting this outlook, the WaveTrend Oscillator, featured below the price chart, shows a notable upward turn after a deep oversold reading below 60. Historically, such movements have preceded sustained rallies in SHIB, providing additional confirmation for the current setup.

Oscillators Show Early Bullish Shifts

Meanwhile, a separate analysis by Charting Guy provided further insight using the weekly SHIB/USD chart. Three key indicators — the RSI, WaveTrend Oscillator, and LMACD — show early signs of bullish reversal patterns.

Image

The RSI, positioned around 40–45, has flattened after a prolonged decline. Although not yet overbought, the RSI remains at levels historically conducive to upside movement once momentum builds.

The weekly WaveTrend Oscillator shows a green dot at its lower boundary, a historical reversal signal. Both oscillating lines are nearing a positive crossover, with histogram bars shifting from negative to neutral. Previous green dots on the weekly chart preceded multi-week price expansions for SHIB.

Other Analysts Seeing Potential in SHIB

Elsewhere, analysis from MMB Trader highlights Shiba Inu’s historical surges. With a baseline support at $0.00001, this analyst projects a target near $0.000037 for SHIB.

Meanwhile, in his commentary, analyst SABoikie argued that Shiba Inu offers an excellent buying opportunity at current levels. He pointed to a possible fractal repetition, projecting a breakout above $0.000014 with an extended target above $0.00010.

Analyst Says XRP is Ready—But It’s Begging for Volume to Arrive

Analysts believe XRP could be setting up for a major breakout that might lead to a new peak, building from last week’s bull run.

In the last 24 hours, XRP is up 5.12%, trading at $2.27. This uptick came after the asset briefly retested lows at $2.10 yesterday, following a move closer to the $2.30 level. For the past two weeks, XRP has traded within a tight range of $2.00 to $2.29. It failed to break out despite the broader bull market momentum, with Bitcoin reclaiming the $95K level.

However, market watchers believe XRP is now ripe for this long-awaited breakout, with a possible move toward a new all-time high.

“XRP: Is it time?”

In a tweet, analyst Maelius suggested it could be time for XRP to move, citing patterns from a 3-day chart. The chart shows XRP forming a descending triangle with a series of lower highs. Notably, the price has recently begun breaking out of this downtrend.

The downtrend followed a major surge that lifted XRP above $3, but the market has since cooled, finding support around $2. The 50 EMA has flattened beneath the price, acting as a crucial backbone for bulls to defend.

Despite the promising technical structure, one key element remains missing: volume. Trading activity has been in decline since the frenzy earlier in January. Meanwhile, XRP’s RSI on the 3-day chart hovers around 50, reflecting a neutral state, neither overbought nor oversold.

Maelius captured the chart’s promising sentiment, questioning if it was time for a breakout and noting that “it begs for volume to arrive.” This highlights that XRP’s breakout could gain real momentum once meaningful buying pressure returns.

Image
XRP 3-day chart by Maelius

XRP Needs Aggressive Buying

Analyst Dom agrees with Maelius’s sentiment, suggesting that XRP needs some aggressive buyers to step in. He argues that such action could quickly bring back the long-lost $2.40 level. Dom added that XRP order books have remained pretty thin.

Essentially, XRP stands poised on the edge of a breakout, but without a decisive influx of volume, the setup risks fading into continued sideways movement.

XRP Breakout Could Lead to $5 and Beyond

Meanwhile, widely followed market analyst “World of Charts” shared a bolder outlook on XRP’s chart formation, highlighting a potential price target.

He first acknowledged that after XRP’s fourfold price surge, it consolidated within a tight range. According to him, XRP is now gearing up for another breakout.

Specifically, he stated that this breakout could come much sooner, pushing the price toward $5 in the coming weeks. This development would mark a new all-time high for XRP.

Notably, the foundation of this target is the observation from XRP’s 2-day chart, which highlighted the dramatic rise from $0.49 in November 2024 to $2.50 the following month. He expects a similar price pattern to unfold in the ongoing breakout.

Image
XRP chart by World of Charts

However, other market watchers like XForceGlobal have reasons to believe XRP could be setting up for a $10 price target upon a successful breakout.

It is Extremely Rare to Hold Over 10,000 XRP Nowadays: Alpha Lion Academy Founder

0

A prominent XRP community commentator and founder of Alpha Lion Academy has pointed out that it is extremely rare to see holders of 10,000 XRP, identifying an accumulation opportunity.

XRP has maintained relevance in the crypto ecosystem since its launch over a year ago. Expectedly, the asset has attracted millions of investors, with total wallets soaring to 6.42 million at press time. Data confirms that, with this latest figure, XRP has welcomed over 610,000 addresses this year alone. 

However, most of these wallets are not holding substantial amounts of the token. Edoardo Farina, who serves as the CEO of Alpha Lions Academy, called attention to this reality in a recent disclosure. Interestingly, the pundit’s disclosure identified an opportunity for those on the sidelines to deepen their reach in the market.

Only 4.67% of XRP Wallets Hold 10,000 XRP

According to Farina, it is “extremely rare” to see investors who hold more than 10,000 XRP tokens. Interestingly, on-chain data confirms this comment from the community pundit. Specifically, data from the community-driven Rich List shows that XRP wallets with 10,000 XRP and more only amount to 300,119.

XRP Wallets
XRP Wallets

Notably, this figure indicates that investors holding 10,000 XRP and more only make up 4.67% of the total XRP wallets of 6.42 million. Also, bringing this threshold further up, only 136,347 addresses hold 25,000 tokens and more. This figure represents a mere 2.1% of total wallets.

Interestingly, data also shows that the top 4% of XRP holders hold at least 11,166 XRP tokens, with only 256,836 wallets in this tier. Meanwhile, the top 1% hold 51,319 XRP and above, with 64,209 in this category. Only 642 addresses are in the top 0.01%, mostly constituting Ripple and other institutions.

Top XRP Holders
Top XRP Holders

Retail Still Early

This reality shows that retail investors have not particularly entered the XRP market en masse, presenting an attractive opportunity for those who have remained on the sidelines to get into the scene. Despite XRP’s near-13-year history, adoption is still in its early stages, especially for the everyday investor.

Farina has consistently championed the call for a broader accumulation by retail, recently intensifying this campaign. Particularly, in late December 2024, the pundit boldly suggested that individuals who do not own at least 10,000 XRP might be making a lifetime mistake. 

His commentary not only targeted market participants without an XRP investment but also those with significantly fewer XRP holdings. In January 2025, Farina also predicted that those holding at least 10,000 XRP tokens could attain financial freedom in the future, suggesting that the 10,000 token mark might be the benchmark. 

Currently, with XRP trading for $2.28, an investor would need to spend $22,800 to procure 10,000 XRP tokens. This capital was significantly lower last November when XRP traded for $0.50. At the time, one needed only $5,000 to amass 10,000 tokens. 

Community pundits such as Edoardo Farina believe the cost of securing these 10,000 XRP tokens will continue to increase in the years to come. This presents the current cost as a discount. Most recently, analyst Barric suggested that investors would someday say XRP at $100 as a cheap price, predicting a possible run to $1,000. Notably, at $100, the 10,000 tokens would be worth $1 million.

RTFKT NFT Investors Hit Nike with $5M Class Action

0

Nike, a popular American sportswear giant, is facing a lawsuit of $5 million following the sudden shutdown of its RTFKT NFT platform. 

A group of RTFKT NFT purchasers recently filed a class action against Nike in Brooklyn, New York. The plaintiff, led by an Australian, Jagdeep Cheema, made two allegations against Nike following the closure of its RTFKT platform in December 2024. 

Accusations Against Nike 

The investors accused Nike of misleading them about the long-term stability and value of the RTFKT non-fungible tokens. It bears mentioning that Nike acquired RTFKT Studios in December 2021. The platform was used to create virtual sneakers in the form of NFTs. 

Given Nike’s involvement in the initiative, many expected the NFT’s value to skyrocket tremendously. However, they were stunned last year after Nike shut down the NFT unit in December 2024. 

This led to a massive drop in investors’ interest in and value of the NFTs, causing early investors huge losses. 

Also, the plaintiff alleged that Nike failed to register RTFKT NFTs under federal securities law. The complaint noted that Nike’s failure to register the NFTs as securities clearly skipped the legal process required to protect investors. 

This class action underscores the regulatory uncertainty surrounding digital collectibles like NFTs. At the moment, the U.S. law does not explicitly state whether NFTs qualify as securities or commodities.

In the U.S., an asset is given the securities tag when it fulfills the conditions of the Howey Test. The plaintiffs argued that the RTFKT NFTs functioned like securities, as buyers expected Nike’s success to drive their values. 

Further, they accused Nike of using its marketing prowess to promote the RTFKT NFTs. The development came a few weeks after the leading NFT marketplace, OpenSea, urged the SEC to clarify that NFTs are not securities. 

Notably, the class action seeks $5 million in damages from Nike to cover investors’ losses. It also accused Nike of violating consumer protection and state unfair trade and competition laws. 

Nike NFTs Value Plunge 

It bears mentioning that the value of Nike NFTs has plummeted heavily from their initial listing price. When the NFTs were first listed on OpenSea in April 2022, they traded at an average price of 3.59 ETH ($6,483). The value has plunged to an average price of 0.0099 ETH ($17.87), representing a decline of 99.72% from the initial listing price. 

Additionally, the number of RTFKT NFT sales also dropped from 835–recorded on its debut date–to 13 in the hours leading up to press time. This drop coincides with the collapse observed in the broader NFT market in Q1 2025. 

Notably, the broader NFT market sales plunged to $1.5 billion in the first three months of the year, marking a 63.41% drop from the $4.1 billion sales recorded in the previous year.   

Binance’s Changpeng Zhao Teases Higher Bitcoin Prices with Latest “Buy the Dip” Tweet

0

Binance co-founder and former CEO, Changpeng “CZ” Zhao, recently teased higher Bitcoin prices with a recent post questioning if investors bought the dip.

Bitcoin struggled over the weekend, closing in the red on both Saturday and Sunday. Interestingly, the two-day recession was the premier asset’s first for seven consecutive days amid recent price resurgence.

Nonetheless, Changpeng Zhao, popularly known as CZ, inquired whether market enthusiasts had taken advantage of the price corrections. In an April 27 tweet, he again reiterated his stance to his over 10 million audience on X that every dip is an opportunity to stack more choice assets.

Hope You Bought the Dip?

CZ saw Bitcoin’s latest price struggles as another buy opportunity, a sentiment he has shared often on his social media handle. The former CEO, who is currently the crypto advisor to Pakistan, has been sharing a similar message whenever the crypto market retraces, assuring users that higher prices are on the horizon.

Recall that he made a similar statement on January 14, a day after Bitcoin briefly crashed to $89,400. He emphasized the importance of downsides like that, insisting it gives users who wish they bought Bitcoin early or used dips to their full effect an opportunity to do so.

Meanwhile, Bitcoin has rebounded from its low on Sunday and an earlier dip on Monday below $93,000 to trade close to $95,000. Furthermore, CZ’s comments have fueled optimism that Bitcoin could target even higher prices in the near term.

Higher Bitcoin Prices?

The tweet from the former CEO, who accurately predicted Bitcoin’s crash to $85,000 from six figures, adds to the bullish outlook from market observers amid the premier crypto asset’s price rebound. Notably, this optimism stems from the sentiment that higher prices typically follow each Bitcoin downside.

Interestingly, CZ recently predicted an ambitious Bitcoin surge to $1 million per coin. While he did not set a timeline for its realization, as he hasn’t with earlier predictions, he expressed a strong belief that the leading crypto token would reach the price mark.

Meanwhile, in the short term, Bitcoin maxi Alfred expects BTC to reclaim the six-figure mark, specifically $109,000, after successfully recovering $95,000. According to him, there is an air gap between the two price marks; hence, Bitcoin will not encounter any resistance if upward momentum persists.

At the time of writing, Bitcoin is trading at $94,836, with a market capitalization of $1.88 trillion.