Home Blog Page 799

Here’s the Next Move for Dogecoin as It Makes First False Break Since Dec 2024

Dogecoin has made its first false break since December 2024, as it witnesses a rebound above the support line, suggesting a potential bull run.

Dogecoin (DOGE) has faced notable struggles in recent days, with the price hovering around $0.1539 amid a 4.13% decline over the past 24 hours. Despite this short-term dip, analysts are presenting views on the future movements of the memecoin.

Insights into major technical patterns suggest that the downward momentum could soon reverse.

“False Break” on Dogecoin’s Price

One of the primary patterns gaining attention among analysts is the “False Break” observed in Dogecoin’s daily chart. According to Trader Tardigrade, the price has followed a consistent downtrend since December 2024. 

The downtrend is marked by a series of lower highs and lower lows, confirming the bearish market sentiment. Interestingly, throughout the year, Dogecoin has observed successful breakdowns to lower levels amid the downturn. The first breakdown occurred on Feb. 2, while the second materialized on Feb. 21. Further, DOGE saw a third breakdown on March 8.

However, the bears sought to trigger another breakdown on April 7 by pushing prices to $0.13 lows, but DOGE recovered quickly. This introduced a shift with a key “False Break.” This pattern occurs when the price temporarily falls below a critical support level but quickly rebounds, suggesting that the downward movement was not sustainable. 

Unlike previous breakdowns where the price continued to decline, the April decline failed to maintain its momentum. The analyst notes that Dogecoin has remained above the support line for several days, confirming the characteristics of a false break. According to him, this pattern could indicate the start of a new bull run for DOGE.

Per the analyst’s chart, this could signal the potential for a bullish reversal, eyeing the next target at $0.42, which marks a possible 172.90% increase from the current level.

Symmetrical Triangle Points to Potential Rebound

Another notable technical pattern is the Symmetrical Triangle, highlighted by Trader Tardigrade in a separate analysis. According to his chart, the price has been confined within the triangle, frequently bouncing between the upper resistance and lower support trendlines. Each time DOGE approaches the upper resistance, it faces rejection and retraces to the support. 
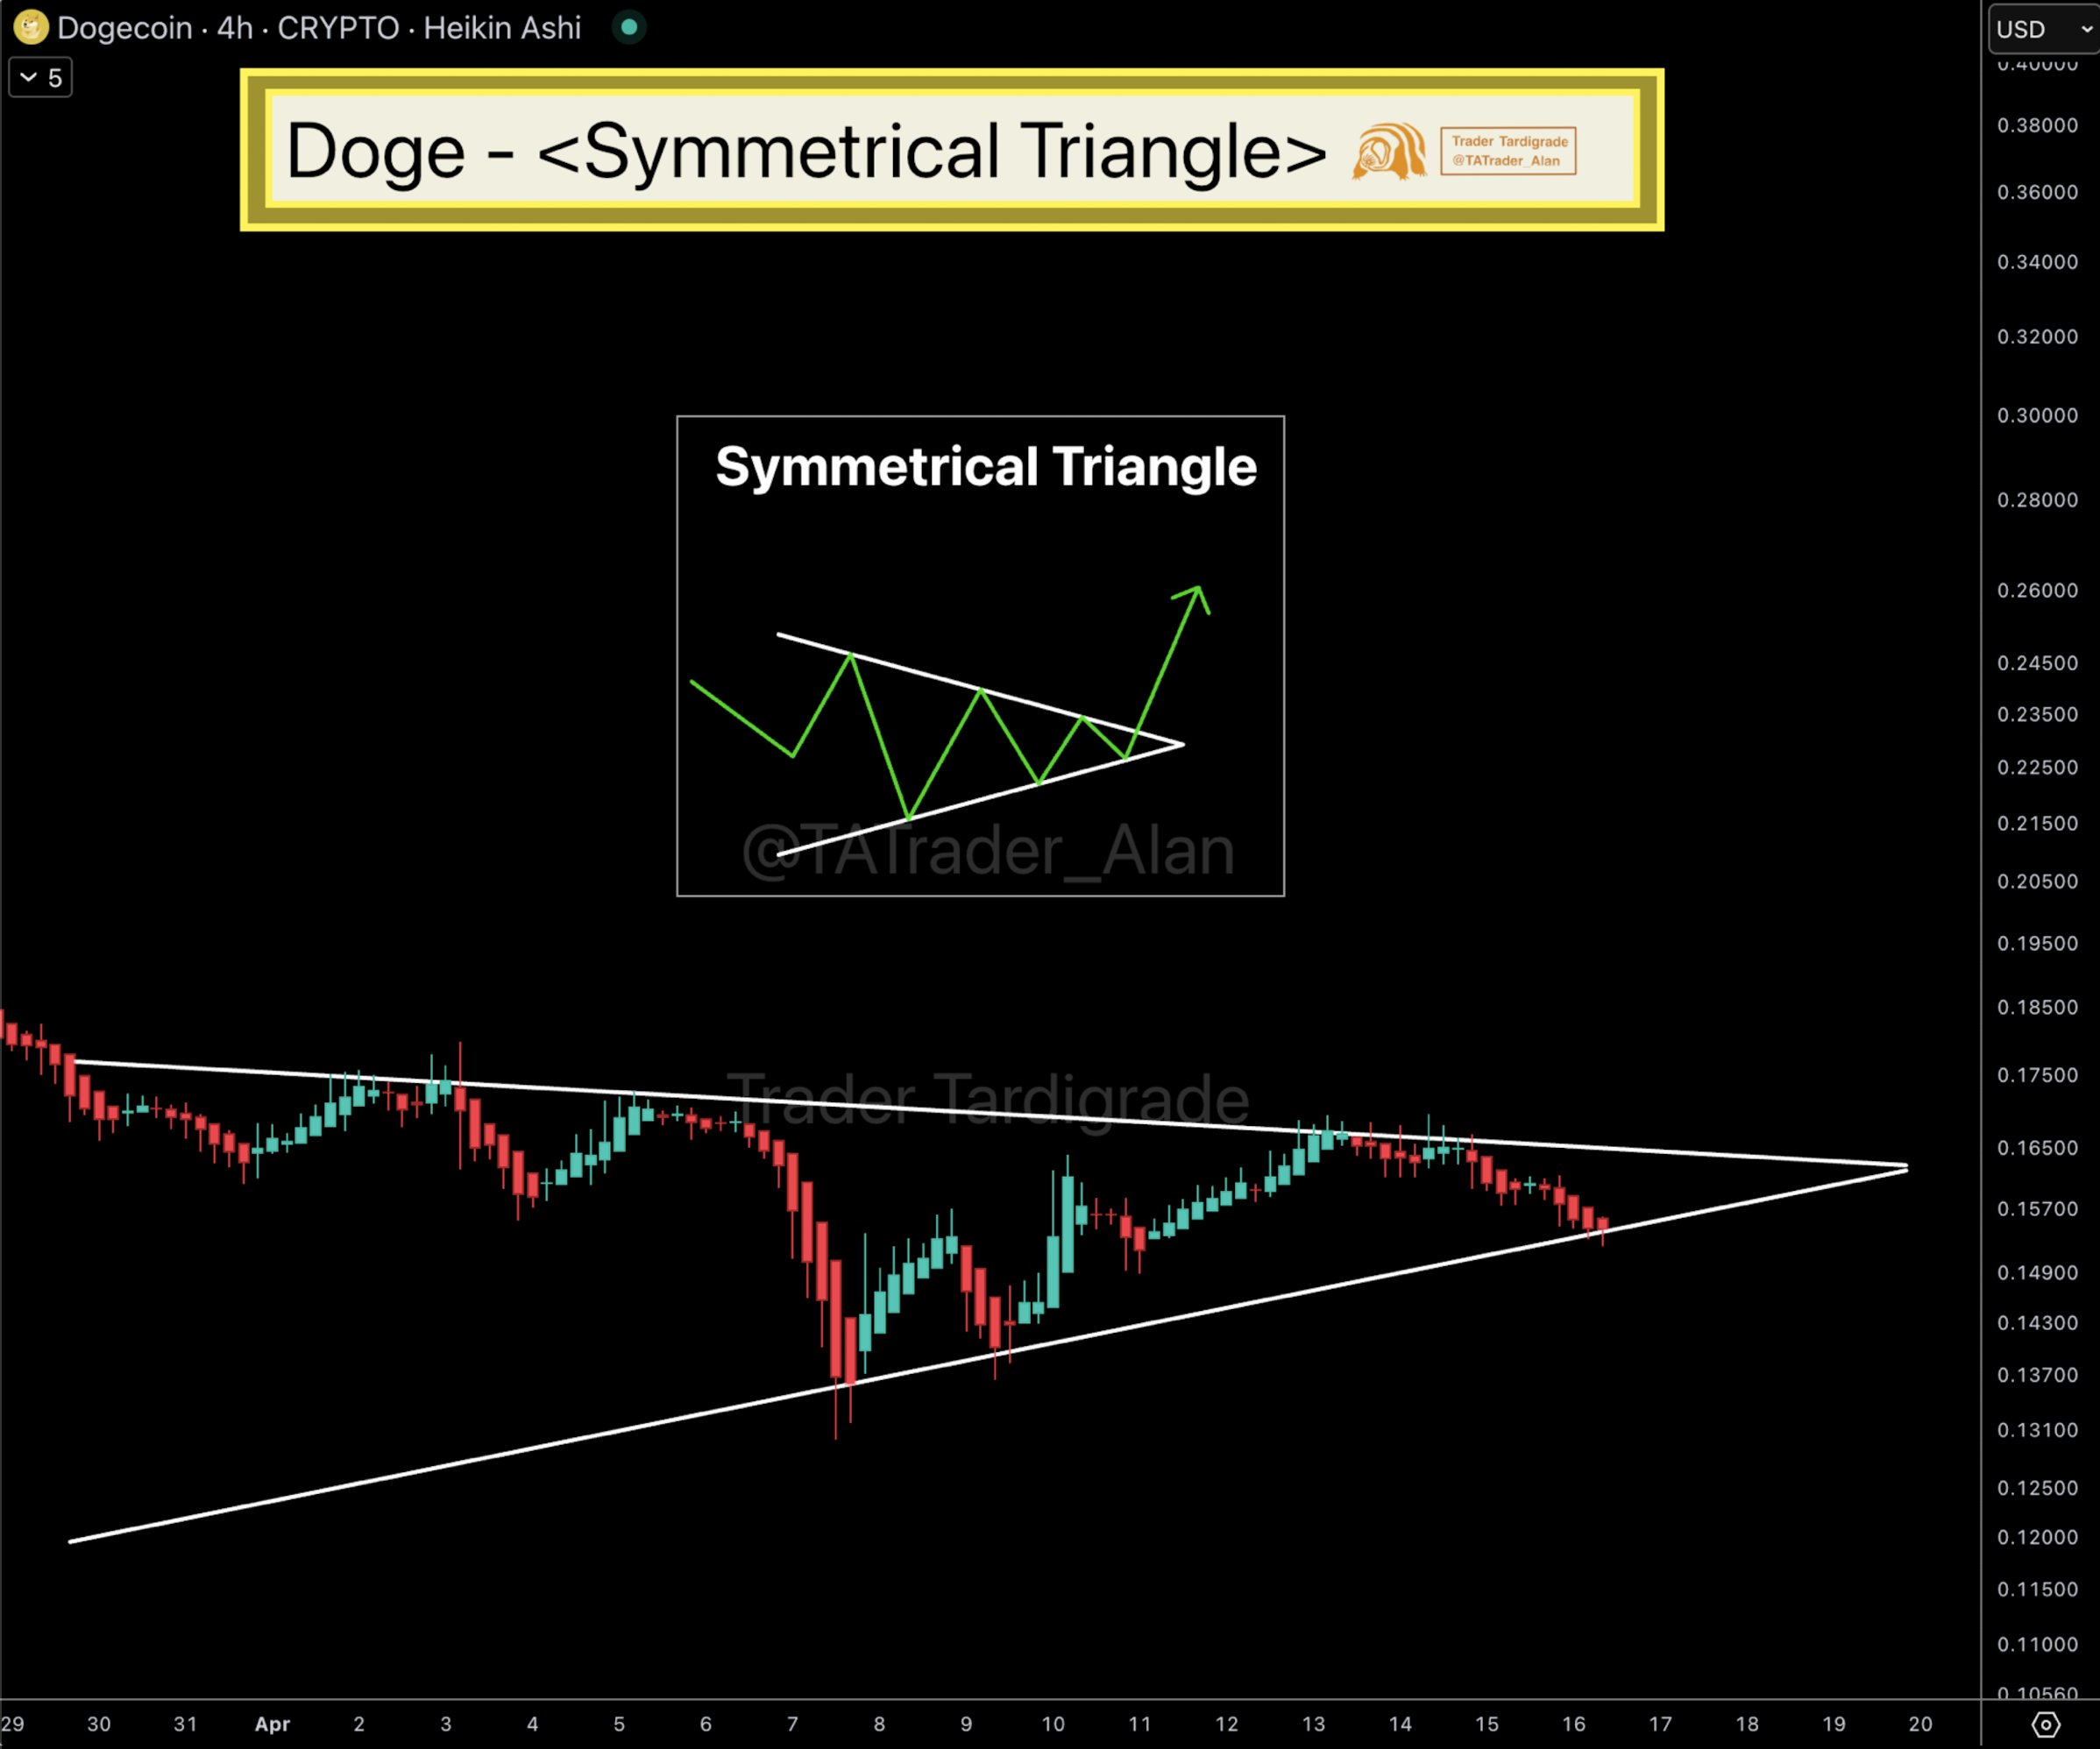
Dogecoin Symmetrical Triangle

Conversely, when it hits the support, buying interest pushes the price higher. In the most recent part of the chart, the price has hit the lower boundary of the triangle and is expected to rebound toward the resistance.

Although the analyst did not specify a target price in case of a breakout, he suggests that the longer the consolidation, the stronger the expected pump. 

Possible Return Near All-Time Highs

Meanwhile, an analysis by the TradingView account ‘FuaCompany’ presents a bullish outlook based on a rising channel. This pattern, identified on a monthly DOGE chart, shows that the price has been moving within parallel lines, forming higher highs and higher lows. 

According to FuaCompany, Dogecoin could continue to respect the rising channel, with potential bounces at the lower boundary leading to upward movements. Historical data suggests that when the price last hit the lower boundary around $0.05, it surged towards the upper limit. 

However, a bearish correction could also occur, causing the price to dip below the channel to around $0.08 before recovering. Despite the potential for short-term declines, the long-term target for Dogecoin remains around $0.70, near its 2021 all-time high.

Expert Says Bitcoin Will Gain Traction in Treasuries While Gold Remains a Sleeping Giant

0

Bitcoin could play a bigger role in discussions about corporate and government treasuries in the coming years, says industry expert Timothy Kotzman.

Meanwhile, gold will continue to be the sleeping giant of legacy finance. Kotzman shared this outlook in a recent panel titled ‘Bitcoin vs. Gold: Which Offers Greater Strategic Value,’ moderated by Eleanor Terrett, a pro-crypto journalist and podcast host.

Bitcoin’s Role in the Future Economy

Earlier in the panel, Kotzman suggests that Bitcoin’s rise is not just a trend but a technological shift that will redefine how the world approaches wealth storage and management. He likened Bitcoin to a “monkey bar” positioned between gold and artificial intelligence (AI). 

He argued that while gold has served as a reliable store of value for centuries, Bitcoin is now outperforming traditional markets. 

Notably, CryptosRus, an account on X, pointed out in March that despite the market pullback, Bitcoin continued to outperform all other assets since the U.S. election. According to the data, Bitcoin has seen a 19.4% pullback from its post-election peak, yet it still leads all assets, outpacing sectors like gold and equities.

As global economies transition to digital currencies and the influence of AI expands, Kotzman believes Bitcoin will emerge as a necessary asset for maintaining economic reality in an increasingly digital world.

According to him, Bitcoin’s role as a “technology tethering us to what is real” will be crucial in the coming years.

Gold’s Continued Significance

However, Kotzman does not discount gold’s place in the financial ecosystem. He acknowledged that gold will continue to be an important asset for those who prefer physical, tangible stores of value. 

Yet, as digital economies evolve, gold’s appeal may diminish for future generations. Bitcoin’s technological benefits and ability to operate within the fast-moving digital landscape position it as a viable alternative to gold, especially for younger investors and institutions looking to diversify into digital assets.

Notably, during the panel discussion, Eleanor Terrett asked about Bitcoin’s shift from a peer-to-peer medium of exchange to a store of value. The response clarified that Bitcoin can serve both functions.

Everyday transactions will primarily occur on Layer 2 solutions and above. On the other hand, large-scale transfers, particularly those by nation states, will take place on Bitcoin’s base layer.

Fidelity’s Perspective on Bitcoin vs. Gold

Jurrien Timmer, Director of Global Macro at Fidelity, has previously commented on the Bitcoin versus gold debate. Timmer presented a scenario in which Bitcoin could eventually surpass gold, although he noted that it would take decades. 

In a March 28 post, Timmer analyzed gold’s compound annual growth rate (CAGR) since 1970 and applied similar models to Bitcoin’s adoption and growth. His analysis suggested that Bitcoin could match gold’s market cap by 2035.

Using the “power law curve,” Timmer predicted that Bitcoin could reach a market cap of $44.62 trillion by that time, driving its value to $2.25 million per coin.

However, he also mentioned that gold’s growth might continue at a faster pace, positioning it as a “quieter older sibling” to Bitcoin.

VeChain Price Slips Again: Will $0.018 Be the Next Stop?

VeChain retests its falling wedge breakout as selling pressure intensifies. Can VET hold above $0.020, or will a drop to $0.018 follow?

With the altcoin market down 2% this week, VeChain is facing renewed selling pressure. After an 8% decline on April 15, the bearish trend continues, with VET registering a 3.57% intraday drop.

Currently, the VeChain token is retesting the breakout from a falling wedge pattern. However, growing supply pressure suggests a deeper correction toward $0.018 could be on the horizon.

VeChain Price Analysis Warns $0.020 Breakdown

On the daily chart, VET shows a breakout from a falling wedge pattern. However, the breakout rally failed to surpass the 50-day EMA near $0.025. Two consecutive Doji candles over the weekend signal market uncertainty.

VeChain Price Chart
VeChain Price Chart

Bears have regained control, forming an engulfing red candle with an 8% drop, completing an evening star pattern. The bulls’ failure to break above the 50-day EMA coincides with rejection at the 78.6% Fibonacci level at $0.02574.

Currently, VET trades at $0.02173, holding just above the broken resistance trendline. As the failed breakout takes a bearish turn, the daily RSI has dipped below the midpoint, indicating weakening bullish momentum.

This increases the likelihood of a new downswing. Furthermore, the 50-day, 100-day, and 200-day exponential moving averages remain in a bearish alignment.

New Partnerships Add Credibility and Support

Despite price volatility, VeChain has secured several high-profile partnerships over the past week, reinforcing its credibility in the market.

In a recent post, crypto analyst Michael Van De Poppe praised VeChain’s partnership with UFC CEO Dana White, who joined as an official advisor.

This could pave the way for further influential partnerships. Additionally, the analyst highlighted VeChain’s collaboration with 4ocean, aiming to combat plastic pollution through blockchain technology.

Analyst Targets 150% Surge in VeChain

Fueling hopes for a breakout rally, crypto analyst Jonathan Carter mapped the falling wedge breakout on the daily chart. According to his analysis, VeChain may be primed for a high-momentum bull run.

Key resistance levels lie at $0.0275, $0.040, $0.048, and $0.057. Based on these levels, the analyst projects an upside potential of up to 150%.

Image

VET Price Targets

According to Fibonacci levels on the daily chart, a breakdown below the $0.020 psychological level could send VET to the $0.018 baseline.

On the flip side, a bullish turnaround after this retest could push VET beyond the 78.6% Fibonacci retracement at $0.025. In that case, the uptrend may extend to the 50% Fibonacci level at $0.038.

Solana Bulls Defend $124: Is a Bounce Back to $150 Next?

Solana retests its breakout level at $124 after a 2.55% drop. A rebound could push prices to $150, but one analyst signals the risk of a fall to $65.

Following a failed recovery attempt this week, altcoin prices have dipped, bringing Solana back to a market price of $124. The SOL price dropped 2.55% on April 15, fueling a 1.66% intraday decline.

Currently, Solana is taking support from a key moving average line, hinting at a potential reversal. Could this propel the SOL price back to $150?

Solana Price Analysis Reveals 20% Upside Potential

Solana’s price action confirmed a bullish breakout of an inverted head-and-shoulders pattern on the 4-hour chart on April 12. The breakout rally peaked near the $135 mark before encountering significant overhead resistance.

Solana Price Chart
Solana Price Chart

Bearish pressure near $135 resulted in multiple long-wick candles, with prices finding support at the 200 EMA line. Additionally, the 38.2% Fibonacci level at $128 reinforced the bullish floor alongside the 200 EMA.

However, a broader market pullback has dragged the SOL price below $128. Currently, the downturn holds above the 50 and 100 EMA lines. Notably, a recent bullish crossover between the 50 and 100 EMAs suggests a short-term upward momentum.

Interestingly, Solana’s pullback appears to be a retest of the inverted head-and-shoulders breakout. The SOL price has completed the retest near the neckline at $124.

Despite the potential for a bullish reversal post-retest, the MACD indicator signals a sell. The MACD and signal lines are trending downward toward the zero line following a bearish crossover.

Based on Fibonacci levels, a successful post-retest reversal could push Solana past the 50% Fibonacci retracement level, targeting the $150 zone—an upside potential of nearly 20%.

Alternatively, a breakdown below $124 could lead to a test of the $116 support level or the psychological $100 mark.

Solana Records All-time High Total Monthly Active Wallets

Despite the short-term pullback in Solana prices, the number of active addresses on the Solana network has increased to 3.94 million. 

Number of Active Addresses on the Solana Network

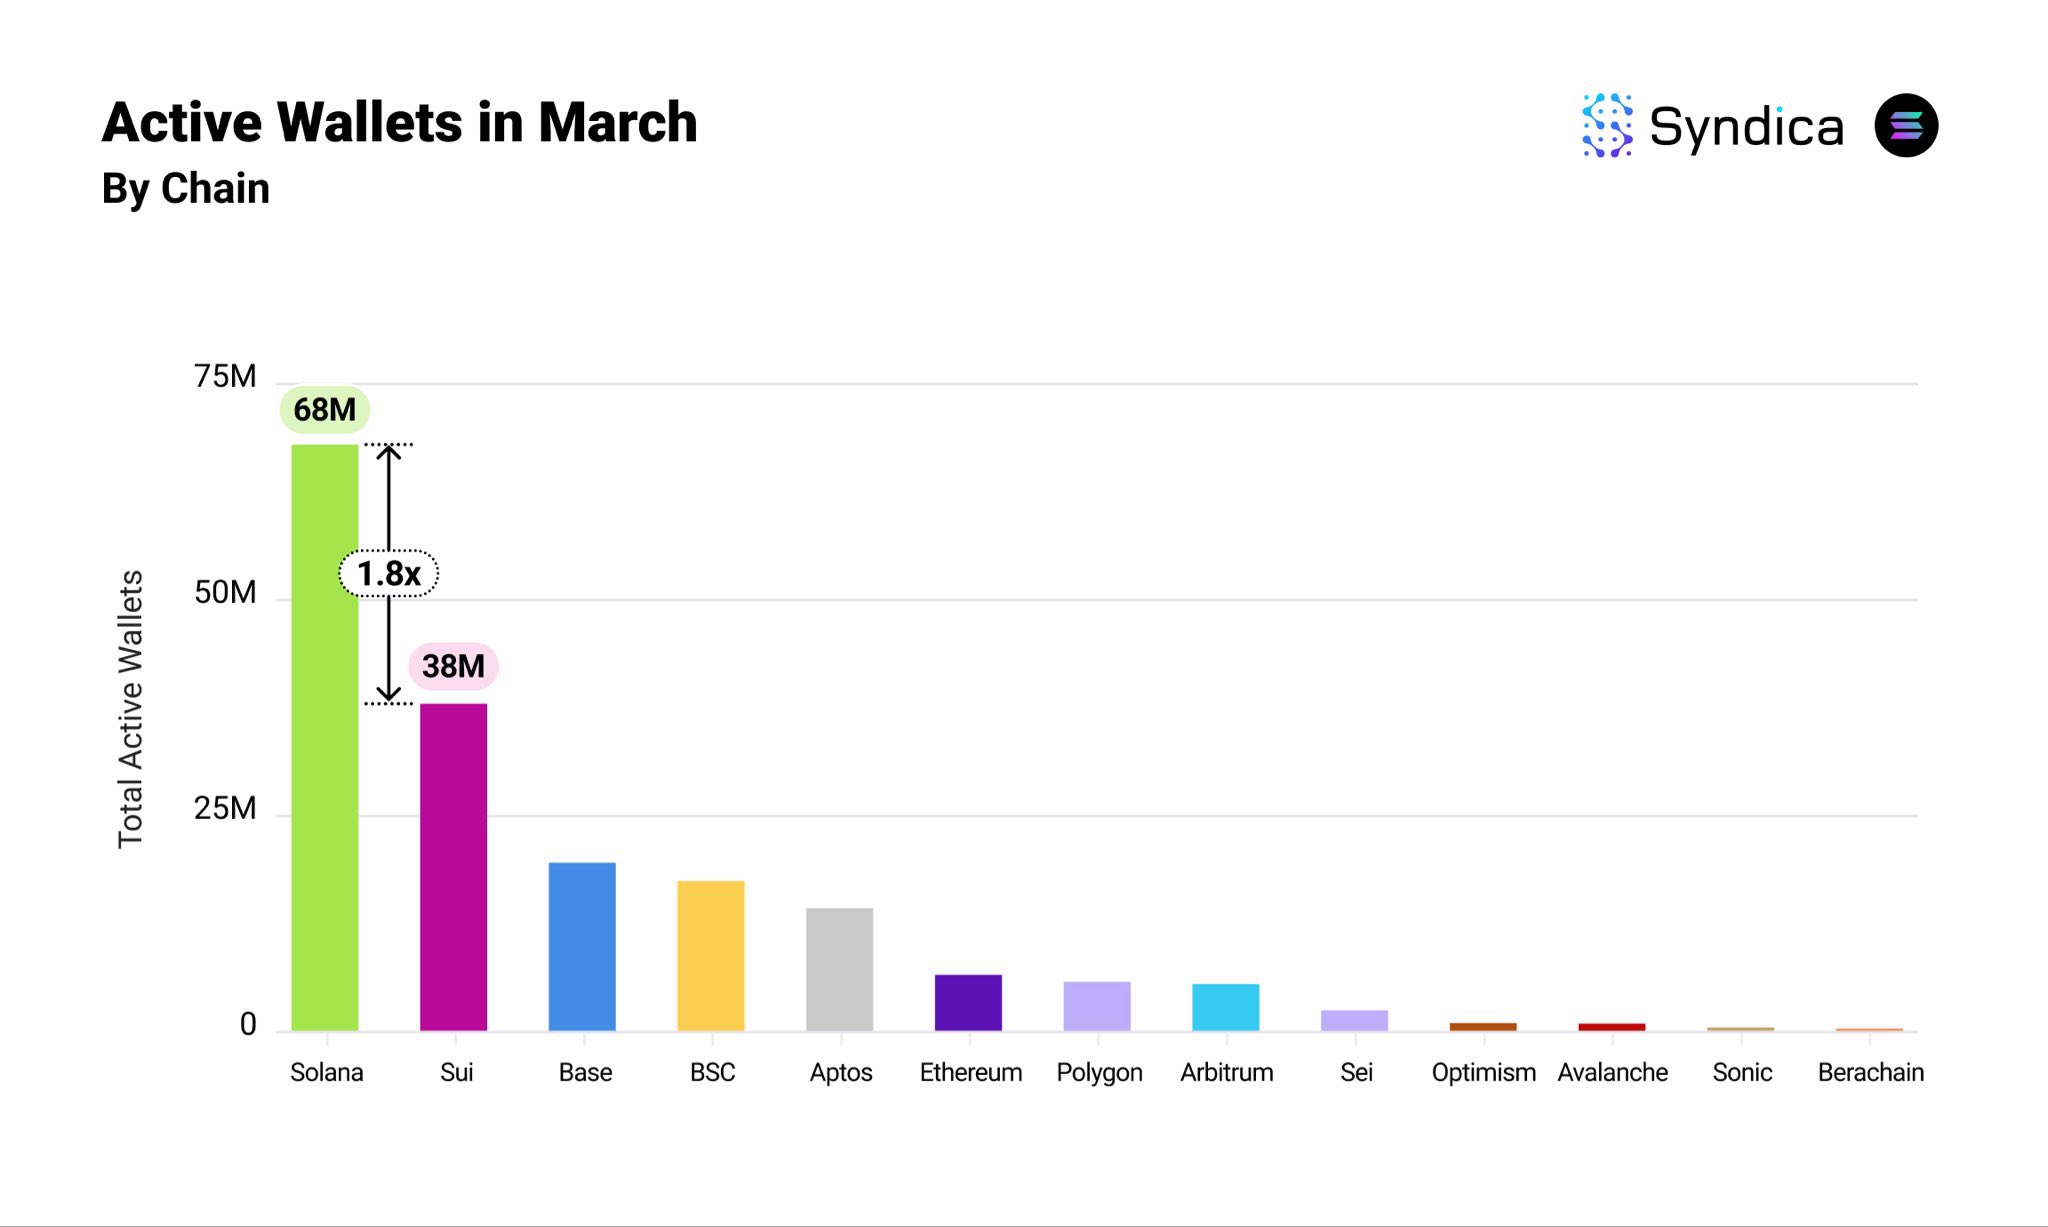
Additionally, the monthly active wallets on Solana hit a new all-time high of 68 million in March, compared to the nearest competitor, SUI. The difference in the monthly active wallets between SUI and Solana is 30 million. The monthly active wallets on SUI were 38 million in March, reflecting a 1.8x difference between the two chains.

Notably, this reflects a short-term growth in network activity, ignoring the market volatility. 

Monthly Active Wallet by Chains

Analyst Warns of A Drop to $60

Despite signs of a potential bullish recovery and improving network fundamentals, crypto analyst Ali Martinez warns of a possible correction in Solana.

In a recent X post, Ali highlighted the potential for a breakdown of an ascending broadening pattern visible on the 3-day chart. If this correction unfolds, he sets a bearish target for Solana at $65.


Here is How High Dogecoin Can Reach if DOGE Grabs 50% of Total Crypto Market Cap

0

Dogecoin (DOGE) could surge to greater heights if it captures half of the global crypto market capitalization. 

The broader crypto market experienced another downturn this week, which wreaked havoc on the prices of major assets, including Dogecoin (DOGE). Consequently, the market recorded a decline of 3.02% over the past day to a valuation of $2.62 trillion. 

Dogecoin’s price reacted negatively to the onslaught, leading to a 5.28% dip in the past 24 hours. This pushed the price of DOGE below the $0.16 mark, as the token currently changes hands at $0.1519. 

Moreover, DOGE dropped to ninth place in the global crypto ranking after TRX flipped it from the eighth position. It bears mentioning that Dogecoin has stayed in eighth place for several months. 

However, TRX overtook the spot, with a market cap difference of over $1 billion. While TRX boasts a market cap of $23.93 billion, DOGE is valued at $22.62 billion in the hours leading up to press time. 

Dogecoin Price If It Grabs 50% of Total Crypto Market Cap 

Despite the setback, some Dogecoin investors are still optimistic about DOGE’s prospects. Consequently, The Crypto Basic considered a hypothetical scenario in which DOGE grabs 50% of the total crypto market cap and its impact on Dogecoin’s price. 

Although the total crypto market cap has dipped in the past day to $2.62 trillion, any asset with 50% of this valuation would soar to unimaginable levels. If DOGE captures 50% of the total crypto market cap, its valuation would be $1.31 trillion. This represents an increase of 5,691% from Dogecoin’s current market cap of $22.62 billion. 

Should Dogecoin achieve this target, its price would skyrocket to around $8.8 per token, so long as DOGE’s circulating supply stays the same at 148.87 billion tokens. 

At this price, early investors would record massive returns on their investments. For instance, someone with a portfolio of 65,832 DOGE currently valued at $10,000 would see their investments rise to $579,321 should DOGE hit a valuation of $1.3 trillion. 

DOGE to $8 Forecasts 

While the possibility of Dogecoin capturing 50% of the total crypto market cap might seem unrealistic, several analysts have projected DOGE’s potential rise to the $8 mark. Meanwhile, such predictions do not suggest that attaining $8 would grant DOGE 50% dominance over the crypto market. 

Last month, top expert Trader Tardigrade suggested that Dogecoin had formed a circular structure on its macro chart. Tardigrade claimed that DOGE also formed a similar structure in the 2017 and 2021 market cycles, which eventually pushed its price to greater heights during these periods. With the recent formation, the expert forecasted Dogecoin’s potential surge to $8. 

In the same month, pseudonymous market expert EWT referenced the Elliott Wave Theory to predict a future surge of $8.5 for Dogecoin. 

As reported in January, Tardigrade suggested that the $8 target would materialize for Dogecoin by 2028, three years from now. Meanwhile, Changelly experts believe DOGE would rise to the $8 target between 2035 and 2039. 

It bears mentioning that this article is a hypothetical assessment of Dogecoin’s price if it grabs half of the total crypto market cap. There is no guarantee that this will ever happen in DOGE’s lifetime. In perspective, a 50% market share would place Dogecoin even above Bitcoin, a highly speculative scenario.

74.4% of Binance Traders Hold Long Positions on Dogecoin, Here’s What It Means

0

Data shows most Binance traders with open Dogecoin positions are holding long, indicating strong bullish sentiment.

Dogecoin’s market activity this month has revealed a surge in price after President Trump paused tariffs on respective countries on April 9. After beginning the month with fluctuations, the meme-inspired crypto peaked on April 13 at approximately $0.168. 

However, since then, the price entered a consolidation phase and began retreating, correcting to $0.1541 by April 16. This price represents a 3.33% decline in the past 24 hours, yet a 7.43% increase over the last seven days.

Traders Maintain Bullish Bets 

In the midst of this correction, Coinglass data from April 16 has shown a significant preference among Binance traders for long positions on Dogecoin. Specifically, 74.4% of accounts had long, with only 25.6% holding short positions within a four-hour window.

Dogecoin Long/Short by Account | Coinglass
Binance DOGE Long|Short by Accounts | Coinglass

This long-to-short account ratio of 2.91 signals a substantial bullish bias. The sharp increase in long positions starting April 12 has further emphasized a shift in sentiment, as traders anticipate continued upward momentum despite the struggling price.

Supporting this outlook, the OI-weighted funding rate data has remained positive since April 7.

DOGE OI-Weighted Funding Rate | Coinglass

This indicates that long traders are paying a premium to maintain their positions, which reflects expectations of price increases. The persistence of a positive funding rate, even during recent consolidation, shows confidence among traders who are actively driving the market upward.

DOGE Owners Reinforce Long-Term Confidence

Meanwhile, data from IntoTheBlock proves that long-term holders have been dominant in the Dogecoin market, hence supporting the bullish narrative. According to the data, hodlers—addresses that have held DOGE for over a year—increased by 0.13%. 

Dogecoin Addresses by Time Held | IntoTheBlock

In contrast, cruisers, defined as holders between one month and one year, declined by 2.54%. However, traders who have held for less than a month surged by 109.96%, revealing renewed short-term interest.

Analyst Points to Defined Price Channel

Further positive insight comes from FuaCompany, a TradingView account that charted Dogecoin’s movement within a rising channel on a monthly timeframe. This analysis identified two key price behavior scenarios.

In the first, Dogecoin may rebound from the lower boundary of the channel and continue to form higher highs. Historically, the asset rebounded from $0.05 before rallying toward the upper boundary, showcasing the channel’s potential to support upward moves.

However, in the second scenario, the price could briefly fall below the channel’s lower bound, reaching levels near $0.08 before initiating recovery. Both scenarios, however, highlight a longer-term projection that suggests the price could eventually approach $0.70.

Gemini’s Tyler Winklevoss Confirms Launch of Free Algorithms for XRP Holders

0

Tyler Winklevoss, co-founder of Gemini, recently confirmed the launch of free algorithms tailored for the XRP holders. 

These algorithms, created by Arch Public, a crypto firm specializing in algorithmic automation, aimed to offer a more equitable investment environment, particularly for XRP and Bitcoin holders.

This acknowledgment followed a post from attorney John E. Deaton, who revealed his involvement with Arch Public. 

Deaton, an influential figure in the XRP space, shared that he had set up an account on Gemini to run algorithms targeting XRP and Bitcoin. He suggested that this new tool could help users generate a “cash yield” by increasing the amount of XRP in their accounts.

Meanwhile, his tweet generated mixed reactions. Some XRP community members expressed enthusiasm, while others voiced skepticism about the legitimacy of the initiative.

Community Response and Criticism

The response from the XRP community was far from unanimous. Several long-term followers of Winklevoss expressed doubt. One dismissed the algorithms as “garbage and a highly inaccurate indicator,” pointing out flaws in the tool’s effectiveness.

Another user criticized Winklevoss for promoting this XRP algorithm after previously criticizing Ethereum. 

Meanwhile, Cameron Winklevoss, Tyler’s twin brother and co-founder of Gemini, also expressed excitement about the release of “free algos.”

His tweet, however, was met with similar backlash, with some questioning whether Tyler Winklevoss had been hacked due to the nature of the announcement.

David Schwartz Warns the Community

Meanwhile, Ripple’s Chief Technology Officer, David Schwartz, also issued a cautionary message to the community about the XRP algorithm.

He raised concerns that the announcements appeared “wrong in several ways.” Schwartz advised the community to remain vigilant until there was confirmation that the posts were coming from uncompromised accounts.

However, Deaton countered the skepticism in a follow-up post. He emphasized his long-standing mission to democratize investing for ordinary people, especially in the face of exclusionary financial practices.

To further address growing concerns, Deaton announced plans to go live on X to provide clarification. Also, his legal firm, CryptoLaw, confirmed that there had been no security breach of Deaton’s account.

Shiba Inu Team Reveals The Hottest Token on Shibarium

0

The team behind the Shiba Inu ecosystem celebrates Roaring Kitty (ROAR) for winning the Best Loud Shibarium Community award. 

Lucie, Shiba Inu’s marketing lead, posted the celebratory message yesterday after ROAR won a recent poll, which required community members to share their opinions on which Shibarium-based meme coin they believe is the hottest. 

ROAR Emerges Victorious

Following Lucie’s inquiry, community members took to the comment section to mention the names of different Shibarium-based tokens. The most mentioned tokens include ROAR, DAMN, FEED, and HACHI. 

Six hours later, Lucie picked ROAR as the winner of the ‘Best Loud Shibarium Community’ award. Notably, the Shiba Inu marketing lead said it would produce a video dedicated to Roaring Kitty and share it on TikTok next week, on April 21, 2025.

The move is part of efforts to boost the project’s popularity, potentially attracting investors to the token. Further, Lucie encouraged community members to promote their favorite tokens in the comment sections of Shibarium Updates’ posts. 

According to Lucie, she and other team members will look for tokens with the most mentions and give them more exposure. This exposure will come in the form of creating a TikTok video dedicated to the tokens to enhance their visibility. 

In response, the official X handle of Roaring Kitty appreciated Lucie for creating the initiative and its community members for putting ROAR in the limelight. 

ROAR’s Price Plunges Over 5% Despite Recent Feat 

For context, Roaring Kitty is a community-driven token launched in September 2022. It initially went live on the Ethereum blockchain and has since expanded its presence to Shibarium, Shiba Inu’s Layer-2 scaling solution. 

ROAR’s core features include renouncing its contract and burning its liquidity pool tokens. At press time, it had a total supply of 1 billion tokens currently circulating. 

Despite emerging as the ‘Best Loud’ Shiba Inu Community token, ROAR has still underperformed in the past day. It has dropped 5.9% over the past 24 hours to $0.002153 per token. 

The drawdown coincides with a broader market downturn that has seen the total crypto market cap dip 2.46% to $2.63 trillion. 

Nonetheless, ROAR is still up 11.1% over the past week. It boasts a market cap of $2.17 million, making it the 4,071st token on CoinMarketCap. At press time, ROAR’s trading volume was up 6.07% over the past day to $71,590. 

So far, ROAR has captured the interest of top market experts. Some, like Altcoin Daily, highlight it among the top meme coins that deserve to be closely monitored. 

Here’s How High Shiba Inu Can Realistically Go Despite Its 589 Trillion Supply

0

Despite its current massive circulating supply, Shiba Inu still has the potential to surpass its previous all-time high under the right market conditions.

However, such an upsurge will likely not materialize soon due to the current market situation. For context, the broader market is facing intense bearish pressure due to macroeconomic factors like the ongoing tariff war. Consequently, the global crypto market cap is down 18.51% year-to-date to $2.6 trillion. 

Amid this market-wide drawdown, Shiba Inu has observed massive declines, down nearly 45% since the start of this year, 2025. However, with SHIB currently trading around the lower ends of the $0.00001 mark, specifically at $0.0000116, analysts are confident the asset can reach new heights upon recovery.

SHIB Witnessing Multiple Price Predictions

It bears mentioning that Shiba Inu’s all-time high price stands at $0.00008, attained during the 2021 bull run. Most investors believe SHIB could surpass this all-time high in the ongoing bull run. However, amid multiple projections, it has become increasingly difficult to fish out what is achievable and what is unfeasible.

For instance, last July, Forbes reported on a Shiba Inu price prediction targeting $0.0003 for the meme coin. Also, in April 2024, market commentator Armando Pantoja suggested that SHIB could hit $0.001 after the latest Bitcoin halving. 

However, critics believe some of these targets are not within reach. One of the major factors that contribute to Shiba Inu’s inability to claim some of these targets is its large circulating supply, which currently sits at 589 trillion tokens. Nonetheless, despite this large supply, SHIB can still realistically reach new heights in this bull run.

Realistic Shiba Inu Price Targets

Shiba Inu’s potential to claim any lofty target would depend on its market cap prospects. For context, the meme coin’s largest-ever valuation was around $44 billion when it attained $0.000088 in October. This indicates the asset has the potential to reclaim $44 billion in this cycle, essentially recovering the $0.000088 price.

Meanwhile, it bears mentioning that as the broader crypto market expands due to the influx of new capital, the effect extends to various assets. As a result, SHIB can potentially surpass the $44 billion market cap this cycle, possibly even hitting the $100 billion valuation mark.

Last November, pundit Oscar Ramos argued that Shiba Inu could hit this market cap. Now, with the current circulating supply of 589 trillion tokens, a $100 billion market cap would translate to a price of $0.000169 for SHIB. This indicates that the $0.00017 price is a realistic target for the asset in this bull run. 

Interestingly, Oscar Ramos, who believes a $100 billion market cap is realistic for Shiba Inu, previously predicted a rally to $0.00017 this year. This would mark a 1,365% increase from current levels. Also, in September 2024, Dexter, a well-known trader, tipped SHIB to claim $0.00015. This also represents a realistic target, being lower than $0.00017. 

Meanwhile, Shiba Inu’s potential to reach $0.00017 indicates that slightly higher targets like $0.0002 could materialize if demand remains high. Last November, analyst Charting Guy projected a run to $0.0002, just 17% higher than $0.00017. 

Unrealistic Shiba Inu Price Targets

However, much higher targets beyond this level might not be feasible for the meme coin. For instance, in May 2024, market watcher Big Mike suggested SHIB could hit $0.0005. This target, translating to a $295 billion market cap, is largely unfeasible in the current market cycle. Nonetheless, it could be within reach in years to come. 

Also, community figure SHIB Bezos presented five targets for Shiba Inu for this bull market, especially with Bitcoin reaching $280,000. These targets ranged from $0.0008 to $8, all of which might be too ambitious to materialize in this bull run due to current market realities and Shiba Inu’s circulating supply.

In addition, more ambitious targets like the projections for $0.001 and $0.01 are also out of reach for this cycle and possibly the next cycle. Nonetheless, Shiba Inu could have a chance at claiming these should a drastic reduction in its supply emerge.

Top Financial Analyst Says Higher XRP Price Could Help Prevent Next Financial Crisis

Financial educator and wealth mentor Linda Jones has suggested that a significantly higher XRP price could help in safeguarding global financial stability in the future.

Jones shared this perspective in the latest edition of her Be Wealthy and Smart podcast, where she described Ripple’s acquisition of brokerage firm Hidden Road as a “game-changer” for global finance.

High XRP Value Could Provide “Deep Pockets” in Future Crises

Speaking on the $1.25 billion deal, Jones remarked that if XRP’s price increases substantially, it could provide “very deep pockets” in the event of systemic financial problems. She noted that these challenges currently fall on the shoulders of taxpayers.

In other words, a higher XRP valuation could equip Ripple with the financial strength to act as a stabilizing force during a financial crisis. With this, they could potentially reduce the need for government bailouts.

Notably, Ripple remains the largest holder of XRP, with a reserve of 41.64 billion tokens. At XRP’s current price of $2 per coin, Ripple holds XRP assets valued at over $83 billion. 

In a hypothetical scenario where XRP rises to $100 per coin—as some in the community have predicted—Ripple’s holdings would be worth over a massive $4.1 trillion.

Essentially, this financial war chest, as Jones suggests, could enable Ripple to help mitigate financial crises without burdening U.S. taxpayers.

This bold proposition comes from systemic vulnerabilities in the financial sector, especially those exposed by the collapse of Archegos Capital Management in 2021.

Why the Hidden Road Acquisition Matters

During the podcast, Jones explained that the Hidden Road acquisition represents more than just a major development in the crypto scene. According to her, it marks a structural shift. 

In particular, Ripple’s move into prime brokerage services positions the company to offer tokenized securities solutions outside the traditional banking system.

“This provides prime brokerage services outside the banking system,” she said. “It eliminates banks as prime brokers.”

According to Jones, integrating Hidden Road’s infrastructure with the XRP Ledger enables end-to-end, near-instantaneous trade settlements. Notably, the current system often involves multi-day delays.

Furthermore, she emphasized that the new settlement system powered by XRPL could significantly reduce opportunities for fraud and leverage abuse, as seen in the Archegos scandal.

Lessons from Archegos

Referencing the Archegos collapse, Jones revisited how a lack of transparency, excessive leverage, and poor coordination among prime brokers led to over $10 billion in losses across major banks.

She cited an AI summary by Grok, which summarized the event. It highlighted major issues such as delayed margin calls, weak oversight, and fragmented risk management. For the uninitiated, Archegos defaulted on multiple margin calls from banks due to lack of liquidity, leading to its collapse amid massive losses and over-leveraged positions.

Jones believes Ripple’s acquisition of Hidden Road directly addresses many of these systemic flaws by introducing a more transparent, blockchain-verified financial infrastructure.

Ultimately, Jones compared the current financial system to those that caused the 2008 financial crisis and argued that Ripple’s model could offer a more sustainable alternative.

“There is a better way, and this acquisition paves the path for it,” she said.