Home Blog Page 814

Deaton Predicts Timeline for XRP To Flip Ethereum as XRP ETF Debuts with a Bang

The recent performance of the freshly launched XRP ETF in the U.S. has given industry leaders more reason to believe XRP could overtake Ethereum, even within this year.

John Deaton, a pro-crypto lawyer and former U.S. Senate candidate, recently shared this perspective in a tweet. Specifically, he argued that XRP could dethrone Ethereum to become the altcoin market leader by the end of this year.

Deaton expressed this conviction after the inaugural XRP ETF in the U.S. recorded an impressive first-day volume of $5.43 million. This substantial turnover came despite the widespread bearish sentiment in the market, with crashing prices in the spot market and liquidations in the derivative market.

XRP ETF’s Remarkable First Day Feat

Notably, the ETF is sponsored by asset manager Teucrium and is a 2x leveraged ETF tracking the performance of XRP. It saw its first trading day on Tuesday, April 8, and closed with a turnover of over $5 million. This came despite XRP’s price dipping again to $1.74 after a brief attempt at the $2 level earlier in the day.

The significance of the ETF’s trading volume becomes even more apparent when considering that it was around four times the value of Solana’s 2x ETF debut.

In his remark, Deaton noted that despite the crypto industry’s widespread negativity toward XRP, he has consistently maintained that XRP holds more appeal than many industry players are willing to acknowledge.

He further strengthened his argument by pointing to the 75,000 XRP holders who united to petition the court in the Ripple case, calling it “extraordinary.” He concluded by reiterating his prediction that XRP will surpass Ethereum and that this will happen by the end of the year.

XRP’s Potential to Flip Ethereum

Despite its position as the largest altcoin, Ethereum has been struggling with bearish sentiment. Since the start of the year, its value has dropped by 55%. In perspective, this means Ethereum has lost $224 billion in market cap since January, with the current value standing at $178 billion and a unit price of $1,479.

Meanwhile, XRP currently has a market cap of $106.51 billion. This reflects a dip of only 12.14% since the start of the year, with the coin trading at $1.82. At one point earlier this year, XRP had a market cap of $196 billion.

XRP’s resilience in the bearish market and its potential for an impressive move during a bull comeback have continued to fuel speculation that it could once again become the second-largest cryptocurrency after Bitcoin.

At the moment, XRP could overtake Ethereum should its price rebound to $3, especially if Ethereum fails to experience a comparable level of growth.

Solana Holds $100 Amid Whale Selloff: Can Bulls Push Toward $147?

Solana remains above $100 despite whale sell-off, with analysts spotting buy signals with a potential upside toward $147 if the $95 support holds.

As extreme fear looms over the altcoin market, Solana struggles to stay above the $100 level. With high volatility and multiple long-range candles, the price fluctuations in Solana are quite evident.

Currently, the SOL token trades at $107.17, marking an intraday gain of 1.76%. Will a rebound help Solana reclaim the $112 resistance level?

Solana Price Analysis

On the daily chart, Solana’s price trend follows an expanding falling-channel pattern. The price has recently taken a negative turn from the overhead resistance trend line within this pattern.

Solana Price Chart
Solana Price Chart

The downtrend reached a low of $95.16 on April 7. However, increased buy-the-dip activity below $100 has helped Solana stay above this key psychological level.

With several rejection candles at lower prices, Solana is maintaining a neutral stance slightly above $100. After the recent drop, the daily RSI is hovering near the oversold boundary.

Despite increased volatility, Solana’s price is fluctuating between the center pivot level at $115 and the S1 pivot level at $94.29.

Solana Whales on a Selling Spree

As Solana hovers at a critical juncture, whales are losing confidence. According to a recent tweet by LookOnChain, the crypto whale “4W1Ree” unstaked 159,028 SOL tokens worth $16.5 million to offload in the market.

Out of this, the whale sold 60,000 SOL tokens for $6.13 million at an average price of $102. Similarly, the whale “5cPair” dumped 89,734 SOL tokens worth nearly $9.7 million, with an average selling price of $108.

Additionally, OnChainLens disclosed that three wallets, potentially under a single entity, unstaked 168,498 SOL tokens worth $17.86 million. The sudden move follows nearly two months of dominance and results in a loss of $11.38 million.

Along with the whales, the platform Pump.Fun has accelerated Solana’s selling activity. Pump.Fun recently deposited 84,358 SOL tokens, worth $9.3 million, on Kraken.

Since the start of 2025, Pump.Fun has sent 1.722 million SOL tokens, valued at $310 million. Overall, the platform holds 3.245 million SOL tokens worth nearly $360 million.

Analysts Spotlight Reversal Chances in Solana

Despite the significant selling pressure from crypto whales and platforms, analysts are still optimistic. According to a recent tweet by Ted Pillows, Solana’s recovery will likely continue after bouncing from a multi-year support trendline.

Historically, the SOL price tested this trendline in Q3 2023, triggering a 1000% rally.

Furthermore, crypto analyst Ali Martinez reports a buy signal for Solana. According to Martinez, the TD sequential indicator signals a buying opportunity on Solana’s weekly chart.

The analyst emphasizes that Solana must stay above $95 and break the $121 mark to initiate a recovery.

Moreover, he suggested that Solana’s potential rally could target $147. However, if Solana fails to hold above $95, the next potential bearish target is $69.94.

Image

As SUI Falls 30%, Will Buyers Defending $2 Push It Back to $2.35

SUI has dropped 30% from recent highs but holds above key trendline support. ETF filings and broker integration are fueling hopes for a rebound toward the $2.35 mark.

In the increasingly turbulent crypto market, the declining SUI price trend undermines the recent falling wedge breakout. The SUI market price is down by 30% from its recent swing high of $2.77.

As SUI struggles to reclaim the $2 psychological level, will lower price rejections reignite the wedge breakout rally?

SUI Price Analysis

On the daily chart, the SUI price trend shows a bullish failure to sustain above the R2 pivot resistance level at $2.78, leading to a sudden plunge along with the broader market correction.

SUI Price Chart
SUI Price Chart

SUI broke below the $2 mark, with the recent downswing creating a 7-day low at $1.71. Currently, the SUI token is trading at $1.95.

With multiple rejection candles at lower prices, SUI is holding above the recently broken resistance line, which suggests a possible reversal on the daily chart.

However, increased price fluctuations are evident between the center pivot level at $2.11 and the S1 pivot level at $1.68.

Interactive Brokers Opens Doors for SUI as Canary Files for ETF

Despite the recent increase in volatility, institutions are signaling optimism for SUI. Recently, Canary Capital filed list SUI ETF on the Chicago Board Options Exchange.

Additionally, Interactive Brokers, a global brokerage giant, has expanded its support for SUI. The firm has added SUI tokens to its crypto lineup.

Interactive Brokers operates in over 160 countries, making SUI more accessible alongside stocks, options, and futures. This is expected to lead to increased adoption and global support.

SUI Price Targets

As SUI holds above the broken resistance trendline, the possibility of a bullish comeback remains strong. A post-retest reversal rally will likely target the R1 resistance pivot level, which aligns with the 61.80% Fibonacci level at $2.35.

On the other hand, the crucial support for SUI is at the 78.60% Fibonacci level, around $1.55.

Expert Explains Why XRP Price Fails to Rise with Recent Positive Events

0

Prominent market commentator Vincent Van Code has commented on the observation that XRP performance fails to align with recent positive developments.

Notably, the positive news includes the resolution of the SEC Ripple case, XRP’s potential inclusion in the U.S. digital asset stockpile, and favorable announcements from Ripple, such as the company’s acquisition of Hidden Road. 

Vincent suggests that despite these positive developments, XRP’s price has not increased as many expected. Instead, it plunged heavily, particularly on Monday, when XRP had a daily close below the $2 mark for the first time since December 2024. 

Explaning XRP Recent Underperformance 

According to Vincent, XRP’s recent underperformance is not due to the failure of the coin. He emphasized that several countries’ global financial markets suffer from a broader downturn. 

Vincent attributed the broader market downturn to President Donald Trump’s recent tariffs on foreign countries. 

He characterized the tariff as a power play to use economic sanctions to negotiate favorable terms. Nonetheless, the software engineer expects the tariff war to end quickly as it emerges. 

Vincent’s Strategy 

In the meantime, he revealed his recent trading strategy in anticipation of a favorable market condition with no tariff impact. 

The market commentator suggests that he buys digital assets like XRP when there is negative sentiment with sound fundamentals. This indicates that the expert often aims to take advantage of market overreactions to temporary factors like tariffs. 

Second, he focuses on analyzing weekly charts to enable him to make sound investment decisions. Conversely, he uses hourly charts for fun. 

Third, Vincent characterized XRP as the ‘Fight Club.’ This description portrays XRP as a resilient asset capable of surviving high volatility.  

Lastly, he suggested that factors such as regulation, enterprise, and strong partnerships would ultimately drive XRP’s adoption. 

Final Thoughts

Meanwhile, Vincent emphasized that nothing has changed with Ripple and XRP. Instead, he asserted that the coin and the company are 100-fold better than they were a year ago, during the peak of the SEC lawsuit. 

The expert noted that he would have been concerned if XRP was the only crypto asset that tanked. As a result, Vincent noted that he would not be swayed by this short-term volatility caused by the tariff war, which he believes will soon end. 

Interestingly, XRP is recovering from the recent market downturn. It is currently trading at $1.82, up 10.97% from its low of $1.64, registered on April 7. 

XRP at $1.71 and $1.55 Likely to End the Entire Corrective Wave—Here’s Why

0

XRP nears a pivotal support as market analyst CasiTrades tracks its Elliott Wave structure, revealing key levels that may complete corrective Wave 2 setup.

XRP has experienced heightened volatility in recent days, with a downward trend shaping market sentiment. As of April 9, XRP is trading at $1.82, reflecting a notable 3.2% loss in the last 24 hours. Over a seven-day period, the price declined by 12.8%, while the 14-day performance shows a sharper correction of 26.3%. 

Despite this short-term pressure, the token has gained 193.6% over the past year, prompting analysts to examine important technical levels that may signal either further losses or a strong reversal.

Golden Ratio Supports and Wave Structure Observed

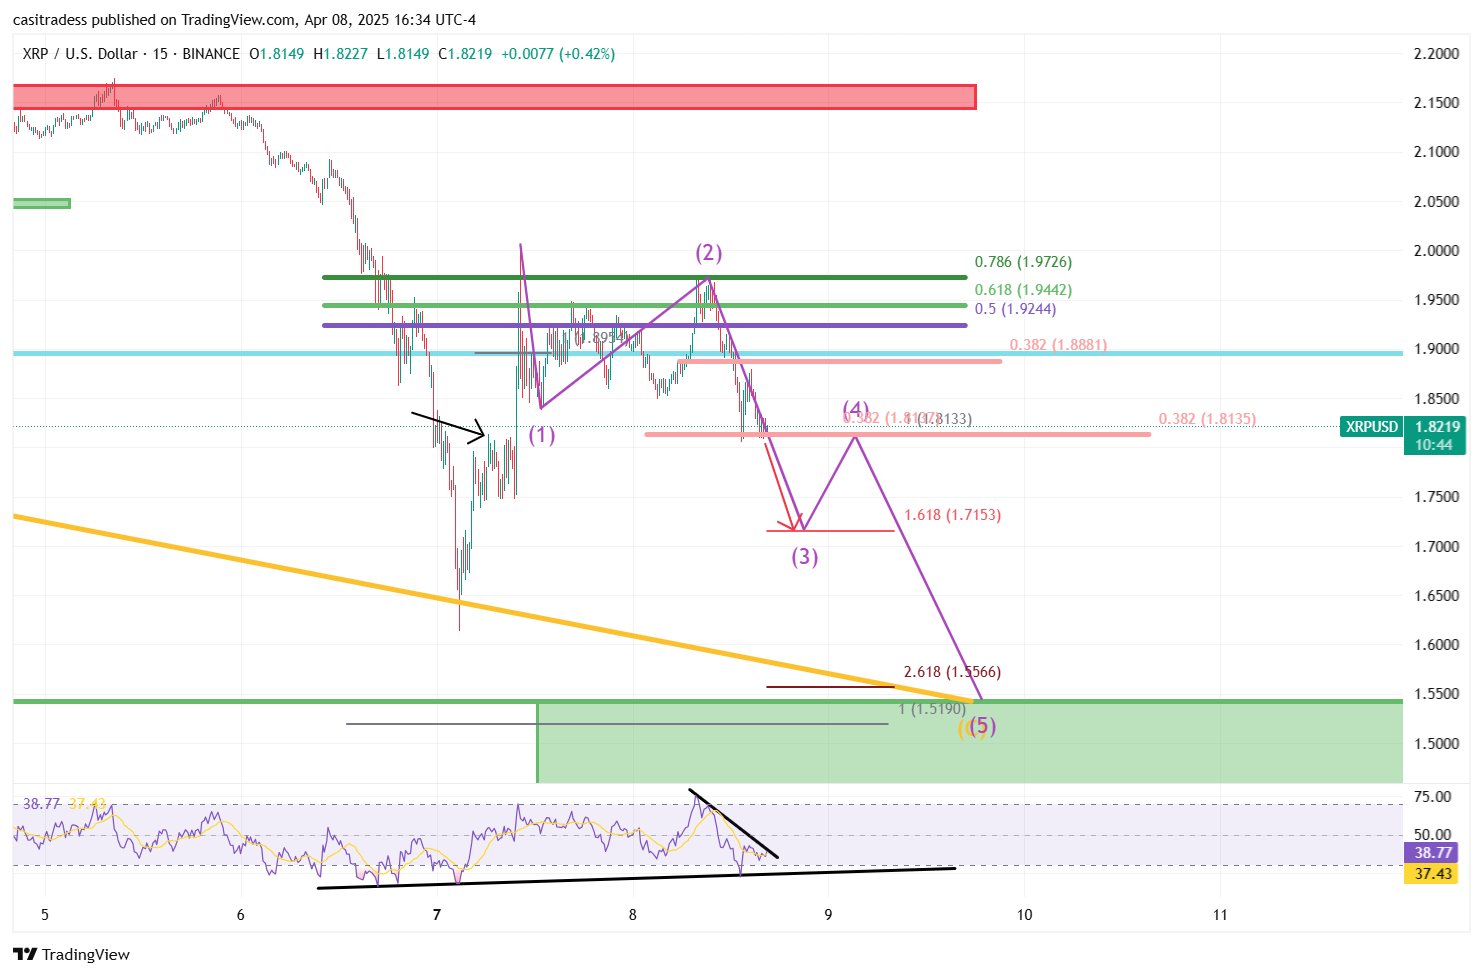
CasiTrades, a technical analyst on X, has been monitoring the recent wave down. According to her analysis, XRP has responded precisely to the subwave 2 target, bouncing off the 0.618 Fibonacci support near $1.55. 

This level marks a crucial area in the ongoing corrective Wave 2 structure. Following this rejection, the price may be entering subwave 3, which suggests further downside movement in the immediate term.

XRP 15m Chart CasiTrades
XRP 15m Chart | CasiTrades

Currently, $1.81 is a pivotal threshold. A drop below this level would indicate progression into the final leg of the correction. If the downward move continues, the analyst expects $1.71 to act as a short-term pause before potentially hitting the golden ratio zone at $1.55.

CasiTrades emphasized that completion of this corrective structure could set the stage for a significant upward breakout. The analyst is also tracking the Relative Strength Index (RSI) for possible bullish divergence as further confirmation of a turnaround.

Projection of $4.50 Minimum for XRP

Parallel to CasiTrades’ outlook, another analyst, Dr. Cat, maintains a longer-term target for XRP. The analyst projects a minimum price of $4.50, even under a scenario where Bitcoin’s current bull run fails to reach new highs.

Dr. Cat bases this target on the 1.618 Fibonacci extension from the previous drop. However, his analysis indicates that if XRP closes below $1.69 on a 2-day chart, the projection may need re-evaluation.

Despite recent losses, Dr. Cat estimates a 50% probability that the current dip marks the bottom. This assumption contributes to expectations of a broader rebound, supported by price behavior and technical indicators near support levels.

XRP Road to Potential Breakout

Further adding to the analysis, market expert EGRAG has outlined a sequence of resistance levels that could shape the next major move. The analyst highlights $2.24 as the first key level, matching the 21-day exponential moving average. A close above this mark may indicate early bullish momentum.

Additional levels to monitor include $2.30, $2.47, and $2.70—each corresponding to critical Fibonacci retracement points. Specifically, surpassing the $2.70 resistance may signal the beginning of a stronger upward rally, according to EGRAG’s roadmap.

Shiba Inu Team Says There are Some Things You’ll Hear Soon, and Others are So Big, They Will Take Time to Unfold

0

The Shiba Inu team has teased rolling out fresh opportunities soon and larger innovations in the future, calling for calm amid the market downside.

The crypto market has seen intense volatility amid growing macroeconomic headwinds. Bitcoin’s collapse to $76,000 has spilled to prominent assets like Ethereum and Shiba Inu. 

Notably, the doggy-themed, lighthearted meme coin, the second largest in the meme sector, has also suffered from the onslaught. Shiba Inu has retraced 9% in the past seven days, extending its year-to-date decline to 48%.

Nonetheless, the Shiba Inu ecosystem team sees this downside as temporary. In a recent X post, Lucie, a Shiba Inu marketer, encouraged enthusiasts to overlook the gloomy market conditions and focus on the impending rollouts that would change the ecosystem’s trajectory.

It’s a Different Story Behind the Scenes

Lucie disclosed that the dampened market mood has not impeded the team’s commitment to building. She reassured the Shib Army that the ecosystem leaders consistently seek ways to foster innovation, teasing an imminent deployment.

Lucie stressed that a new technology will soon hit the Shiba Inu ecosystem, a testament to the leadership team’s ploy to expand beyond hype to real utility. While the marketing lead did not explicitly mention what enthusiasts should expect, she noted that the innovation is close to release.

Meanwhile, she further fed the Shib Army’s curiosity, noting that bigger things were in the pipeline. The prominent marketer emphasized that there are other rollouts “so big they’ll take time to unfold.” Nonetheless, Lucie noted that momentum is building and urged proponents to ignore the trolls.

FUD Builds Nothing: Lucie

Furthermore, Lucie highlighted that fear, uncertainty, and doubt build nothing. According to her, the “lame dramas” and trolls also do not add anything to the ecosystem, calling on proponents to focus on what actually matters.

She urged the community to fix their gaze on advancing technology, decentralized finance, and the real progress the Shiba Inu ecosystem is achieving. The marketing lead insinuated that form is temporary, but building sound innovation would outlast periods of recession like this.

Moreover, Lucie noted that there are already fresh opportunities out there that proponents can leverage. For context, the Shiba Inu team recently launched Karma on Puppynet, a system that tracks user activity in the L2 network and rewards them accordingly.

In the meantime, SHIB trades at $0.00001103, down 2% in the past 24 hours. Recall that the Shiba Inu team recently agreed that an over 12x rally to $0.0001833 in the near term is plausible, also noting that $0.01 is not impossible for the prominent meme coin in the long term.

Argentina Lawmakers Approve Committee to Investigate LIBRA and Top Officials

0

Argentina’s lower house of Congress has passed multiple resolutions related to the LIBRA crypto scandal, advancing a formal inquiry into the controversial token. 

With mounting scrutiny surrounding President Javier Milei’s involvement, the Chamber of Deputies established a special investigative committee and summoned top executive branch officials.

These measures follow allegations linked to the collapse of the LIBRA meme coin and the legal actions taken against its creator, Haydone Davis.

Congress Approves Three Key Measures

The legislative body approved the creation of a special commission to investigate the scandal, with 128 votes in favor, 93 against, and 7 abstentions. 

In a separate vote, lawmakers agreed to summon high-ranking officials from the executive branch. This list includes Economy Minister Luis Caputo, Chief of Staff Guillermo Francos, Justice Minister Mariano Cúneo Libarona, and National Securities Commission (CNV) President Roberto Silva. The vote concluded with 131 in favor and 96 against.

Additionally, the Chamber passed a resolution requesting detailed information from the Executive Branch regarding the LIBRA token. This measure received 135 votes in favor, 84 against, and 7 abstentions. The resolutions emerged amid growing demand from legislators to determine whether the cryptocurrency’s downfall harmed Argentina’s financial interests.

Lawmakers Voice Differing Views

Furthermore, various members of parliament presented differing stances on the matter during the session. Pablo Juliano of the Democracy Forever bloc emphasized the need for legislative oversight. 

In contrast, Nicolás Mayoraz from President Milei’s La Libertad Avanza (LLA) party warned against overstepping judicial powers. He called the proposed commission an overreach.

Oscar Agost Carreño of Encuentro Federal and Karina Banfi from the UCR both stressed the legislature’s role in demanding political accountability. 

Banfi also pointed out that investigations are underway at both national and international levels. Meanwhile, Maximiliano Ferraro from the Civic Coalition emphasized the public’s right to transparency, as Germán Martínez of Union for the Homeland encouraged Congress to act decisively amid global political uncertainty.

However, LLA bloc leader Gabriel Bornoroni dismissed the opposition’s efforts, stating they aimed to disrupt government progress. He referred to the fiscal surplus achieved in 2024 and claimed inflation has consistently declined, attributing the backlash to the administration’s economic performance.

Legal Troubles Mounting LIBRA

The political developments follow legal proceedings targeting LIBRA token creator Haydone Davis. On March 13, Argentine lawyer Gregorio Dalbon submitted a formal request for Interpol to issue a Red Notice for Davis, whose company, Kelsier Ventures, launched LIBRA in February.

Argentine prosecutors identified Davis as the primary figure behind the token’s collapse, which triggered widespread financial losses. 

Following this, Burwick Law, a prominent crypto legal firm, filed a lawsuit against Kelsier Ventures and two associated platforms: Meteora and KIP Protocol. The case seeks disgorgement of profits and investor compensation for affected clients in the United States.

Ethereum Eyes $1,690 as On-Chain Data Signals Bottom Formation

Ethereum on-chain data and RSI suggest a possible trend reversal toward $1,690 despite a bearish streak and whale exits.

As the tariffs imposed by Donald Trump come into effect, the crypto market witnesses another spike in volatility. This caused Ethereum’s price to drop to a 24-hour low of $1,383. Currently, after a minor price rejection, Ethereum is trading at $1,461.

The increasing volatility has resulted in four consecutive bearish candles in Ethereum’s price trend, forming within a parallel channel. As the declining trend tests the crucial support trendline, will buyers manage to overturn the supply pressure for a sudden rebound?

Ethereum Price Analysis

Ethereum’s price trend continues within the falling channel pattern on the daily chart. Despite multiple lower-price rejection candles, Ethereum struggles to bounce off the local support trendline.

Ethereum Price Chart

Despite the four consecutive bearish candles, underlying bullish support helps Ethereum stay above the S1 pivot support level at $1,424. Buyers anticipate a further crash for Ethereum as fear grows in the market.

However, the daily RSI has entered the oversold region, hinting at a potential minor relief rally. As Ethereum stands at a crucial crossroads at the base of the falling channel pattern, crypto whales are struggling to maintain confidence in Ethereum.

Whales on Selling Spree

Specifically, Donald Trump’s World Liberty Financial (WLFI) is allegedly booking profits in Ethereum. According to a recent tweet by LookOnChain, WLFI Trust has begun offloading ETH at a potential loss.

Based on data from Arkham, a wallet linked to the WLFI Trust has cashed out 5,471 ETH, worth $8.01 million, at an average price of $1,465.

WLFI previously spent $210 million to acquire nearly 67,500 ETH tokens. The average purchase price was $3,259, and they are currently recording an unrealized loss of $125 million.

Furthermore, a crypto whale has dumped 500 ETH into the market after nearly two years of dormancy. After offloading $708,700 in ETH, the whale lost $166,000. The whale holds 1,725 ETH, worth $2.47M.

Historically, the whale withdrew 2,225 ETH, worth $3.34 million, from Bittrex between July 2022 and April 2023. Notably, the whale’s average purchase price of ETH was at $1,504.

Ethereum ETFs Maintain Outflowing Trend

Yesterday, the U.S. Ethereum Spot ETFs registered a total net outflow of $3.29 million, with Fidelity’s outflow accounting for the majority of the outflow. The other nine ETFs recorded zero flow. Ethereum ETFs have seen a net outflow over the past six weeks, indicating an offloading trend.

On-Chain Data Hints at Long-Term Bottom Formation

Despite the multiple bearish signals in the market, CryptoQuant suggests that Ethereum’s price is likely to see a comeback. According to the latest tweet from the on-chain platform, Ethereum’s price has dropped below its realized price. Historically, this negative crossover between Ethereum’s market price and realized price has often coincided with long-term bottom zones.

Ethereum Network Activity

Amid increasing volatility, the Ethereum ecosystem remains optimistic. According to GrowThePie, active addresses on the Ethereum network have increased by 0.94% over the past week.

This brings the total number of active addresses to 10.19 million. Additionally, Ethereum’s Layer 2 dominance at 4.35x marks a 5.45% increase from the previous week.

As of April 6, activity on a single Layer 2 stood at 77%, with nearly 17% on the Ethereum mainnet. The remaining 4% was registered across multiple Layer 2s, and the rest (2%) was on cross-layers.

Image

Meanwhile, futures contracts for Ethereum are seeing an increase in long positions. The long-to-short ratio chart shows that long positions now account for 54.09%, pushing the long-to-short ratio to 1.1782.

Furthermore, open interest at $17.46 billion has increased by 0.25%, indicating a gradual increase in trader activity. However, the funding rate remains at 0.0046%, showing a significant recovery from 0.0090%.

Ethereum Long/Short Ratio Chart

Ethereum Price Targets 

Based on current price action and rising bullish sentiment in the derivatives market, a potential reversal could challenge the center pivot level at $1,690. The oversold RSI supports the possibility of a bullish turnaround.

However, declining confidence among large crypto whales could pose a risk of a sudden supply surge. In this case, a potential breakdown in Ethereum’s price may test the S3 pivot support level near the $1,000 psychological mark.

XRP ETF Debut ‘Very Respectable’ Despite Bear Market: Bloomberg Senior ETF Analyst

The recently launched first XRP ETF in the U.S. market, introduced by asset manager Teucrium, achieved a remarkable turnover on its first trading day.

Specifically, Teucrium’s 2x XRP ETF, trading under the ticker XXRP, recorded an impressive $5.43 million turnover on its debut on April 8.

Bloomberg Senior ETF Analyst Eric Balchunas highlighted this achievement in a tweet. He described the feat as “very respectable,” especially considering the prevailing bearish sentiment in the market.

Notably, on Monday, XRP’s price dipped to $1.64, its lowest in five months. While the price rebounded to over $1.96 on Tuesday, it dropped again to $1.73 by the evening.

Despite the bearish conditions for XRP, Teucrium saw an opportunity and launched the 2x leveraged XRP ETF to capitalize on the market. Remarkably enough, the downturn did not deter its turnover, as the ETF’s trading volume surpassed that of a similar product for Solana.

Image

XRP 2x ETF Beats Solana’s 

According to Balchunas, XXRP’s $5.43 million turnover was roughly four times the volume of Solana’s 2x ETF on its first day. He also noted that XXRP’s turnover places it in the top 5% of new ETF launches.

However, despite the impressive start, the volume is still 200 times smaller than the debut volume of BlackRock’s Bitcoin ETF.

Meanwhile, the debut of the XRP 2x ETF has garnered admiration from the community, especially in light of the brutal market conditions, where 137,000 traders faced liquidation, with over $413 million in losses in the last 24 hours.

Market participants are now watching to see if the XRP ETF can sustain this impressive volume going forward.

On the other hand, some XRP enthusiasts have argued that while XXRP’s volume significantly lagged behind BlackRock’s IBIT, they believe that BlackRock’s Bitcoin ETF could face better competition from a potential IXRP ETF.

Community reaction
Community reaction on XRP 2x ETF

Notably, BlackRock has yet to express interest in launching an XRP ETF. This is despite a flurry of other asset managers, including Grayscale and Franklin Templeton, submitting applications for XRP ETFs.

Clarifications about XXRP

It is worth noting that Teucrium’s XXRP ETF does not invest directly in XRP, unlike spot ETFs, over 10 of which are currently under the SEC’s review.

Instead, XXRP delivers twice the daily performance of XRP, amplifying both its daily gains and losses for investors.

In a commentary, community figure Crypto Eri emphasized the risks of the ETF, particularly its volatility. Even with a flat XRP price, high volatility could lead to significant losses. For example, 25% volatility could result in a 6.1% loss, while 75% volatility could cause a 43% loss.

Michael Saylor’s Strategy Admits in SEC Filing It Could Sell Its Bitcoin: Here’s When and Why

0

A recent filing with the US SEC revealed that the self-acclaimed Bitcoin Treasury firm Strategy could break its HODL strategy and sell its BTC tokens.

Specifically, the Michael Saylor-chaired firm filed an 8-K form with the US Securities and Exchange Commission on April 7. Publicly traded companies usually submit this form to the regulator when disclosing significant events within the organization.

Strategy filed the Monday form with the US SEC to update investors on its business activities in the first quarter, which ended on March 31, 2025. The disclosure provided detailed information on the Bitcoin acquisitions and the status of Strategy’s indebtedness.

Detail of the Disclosure Raises Concerns

Nonetheless, a detail of the submission has caught the crypto community’s attention. For context, the filing stated that Strategy could be forced to sell its BTC to offset certain financial obligations in the face of adverse market conditions.

Excerpt from the Form 8-K

Remarkably, this brings to reality the possibility that Strategy might sell its stash of the pioneering cryptocurrency. Recall that executive chairman Saylor had earlier insisted that the company would never sell its Bitcoin but would continue to buy the top.

However, Strategy would not easily relinquish its keenly treasured Bitcoin stash. The clause for its probable dump would be if the asset’s price sustains its downside spiral and it fails to secure new liquidity from equity sales or debt instruments either promptly or at unfavorable terms.

Meanwhile, such sales would have severe implications for Strategy’s financial health. Its 528,185 BTC, currently worth $40.64 billion, has an unrealized profit of nearly $5 billion at Bitcoin’s current price of $76,812. Per the disclosure, the publicly traded firm may be required to sell below its average cost price of $67,485 or other unfavorable conditions, incurring substantial losses and hampering its chance at acquiring new funding.

Standard Disclosure Requirements?

Despite the skepticism that the disclosure, which recently came to light, stirred, a faction of the crypto community argued that it is standard practice for publicly traded companies, especially those leveraging debt instruments. They argued that this disclosure had always been on Strategy’s previous 8-K filings.

Indeed, Strategy had always added this clause to its previous filings with the US SEC. For context, its January 6 8-K form, disclosing its business activities for the fourth quarter of 2024, also mentioned this possibility.

Meanwhile, a probable Strategy sell will surely crash the crypto market sentiments. The business development firm adopted Bitcoin as its primary treasury reserve asset in 2020 and has incessantly piled into the flagship cryptocurrency. Per its Bitcoin strategy, it would continue to accumulate the asset, with Saylor disclosing at one point that the firm’s endgame is to become a Bitcoin bank.