Home Blog Page 857

Top Trader Says XRP Will Crash Hardest Among Majors, Opens Massive Short with $1M

Crashius Clay, a widely followed crypto trader, has suggested that XRP could experience the greatest price crash among the leading crypto assets.

Clay shared this perspective about XRP in a tweet on Tuesday. This view contrasts with other market commentators, such as Jake Gagain, who are predicting a new all-time high for XRP.

However, Clay believes that instead of reaching a new all-time high, XRP will likely dump to historic lows. This suggestion comes amid ongoing discussions in the crypto community that the bull cycle may be over and that the market could be entering a bear season.

Clay is leaning towards the bearish side and has opened massive short positions on both XRP and Bitcoin. In his tweet, he shared details of his shorts on these two assets. He added his expectation for XRP over the next two months, saying:

“I believe XRP will crash harder than any coin in the top 50 in the next 30-60 days.” 

$1M in XRP Short

Notably, his XRP and Bitcoin shorts are already proving to be a smart call. For Bitcoin, he entered with 30x isolated leverage on the Binance exchange, with an entry at $84,347. 

Since then, Bitcoin’s price has dropped to $82,657, securing him a profit of $29,948.80, representing a 61.22% ROI. However, this position risks liquidation should Bitcoin rebound to $86,634.60.

But the real standout in his trades has been the XRP short. Armed with 10x isolated leverage, Crashius bet against XRP at $2.3190. As the price dipped to $2.2679, his profits surged to $176,792.91.

Notably, this marked a 22.54% ROI under the 10x leverage. The higher absolute return compared to his Bitcoin trade reflects the sheer size of his XRP position. Specifically, the position is worth over $7.8 million, requiring $997,177.11 in margin.

This position risks liquidation if XRP’s price rebounds to $2.4987. At press time, XRP is trading at $2.31. Meanwhile, Clay remains convinced that further lows are on the table for XRP.

How Low Can XRP Get?

It’s worth noting that Clay is not the only market watcher with a bearish outlook for XRP. As The Crypto Basic reported earlier, some analysts believe XRP’s price could crash by 40% and drop back into the $1 range. This prediction is based on the observation of a head and shoulders pattern on XRP’s chart.

Meanwhile, optimistic commentators like Edo Farina believe a $1 XRP price would be a prime buyback opportunity. In his view, XRP could reach this low with a flash crash and rebound within minutes.

Dogecoin Whales “Betting on a Breakout” Amid 110M DOGE Buyback

0

Dogecoin (DOGE) whales are “betting on a breakout,” according to prominent crypto analyst Ali Martinez.

After falling over 70% in the past 3 months, it is safe to say that Dogecoin has been severely pummeled in the recent crypto market rout. Despite the beatdown, however, one class of investors appears to be betting on the meme coin to get back up soon.

Dogecoin Whales On a Buying Spree

Dogecoin whales are “betting on a breakout,” according to prominent crypto analyst Ali Martinez. Martinez disclosed this in an X post on Tuesday, March 18, highlighting fresh DOGE buys from these investors.

Specifically, these investors with holdings between 1 million DOGE and 10 million DOGE have added 110 million DOGE worth $18.5 million at current prices to their holdings in the past week, per Santiment Feed data. These purchases follow 1.4 billion DOGE ($224 million) and $1.7 billion (DOGE) buys made last week.

Dogecoin whales add 110M DOGE
Dogecoin whales add 110M DOGE. Source: Ali Martinez

Beyond suggesting Dogecoin whales are betting on a price rebound, the recent whale purchases are a bullish sign hinting at market accumulation.

Meanwhile, this whale buying is not the only positive Dogecoin on-chain signal at the moment.

A “Buzzing” Network

On Wednesday, March 19, Ali Martinez asserted that the Dogecoin network was “buzzing.” He said this, highlighting the recent spike in active network addresses.

This metric jumped over 76% from an average of 160,000 active addresses last week to 282,500 active addresses on Monday, March 17.

Dogecoin active addresses spike
Dogecoin active addresses spike. Source: Ali Martinez

A rise in active addresses is typically seen as bullish as it suggests growing network interest, which can translate to increased demand for the native asset.

Amid these positive on-chain signals, Martinez has suggested that a rebound could take the doggy-themed meme coin to a new all-time high at the $2 price point. The analyst made this call citing an ascending channel on the weekly candlestick chart.

In the meantime, however, DOGE continues to idle alongside the broader crypto market, trading at $0.1677, down a negligible 0.29% on the day. The muted price action is likely the result of traders sitting on the fence while they await the Federal Reserve’s interest rate decision, which is expected later today.

Here are XRP Millionaires Holding XRP Worth More Than $1M at Current XRP Price of $2.3

0

The number of XRP holders with balances worth at least $1 million has reduced over the past few weeks amid price struggles.

For context, the broader market’s bearish direction has dictated XRP’s price action since February 2025. The altcoin collapsed nearly 30% that month, with the downward pressure spilling into March. However, XRP’s resilience has triggered a 6.98% rebound so far this month. 

Despite this, the market is still in a delicate position amid the bearish pressure. On-chain data provided by the community-driven Rich-list resource shows that amid the price drop, the number of XRP millionaires has dropped. 

Notably, at the current price of $2.3, an investor would need to hold about 434,782 XRP to sit on $1 million. Nonetheless, when XRP changed hands at the $3 mark, market participants with 333,333 tokens had holdings worth $1 million. The 333,333 tokens are now valued at $766,666, pricing these investors out of the millionaire club.

XRP Millionaires at Current Price

According to on-chain data, investors holding between 500,000 XRP ($1.15 million) and 1 million XRP ($2.3 million), the lowest tier of millionaire addresses at current price, total 2,278. 

Further, investors with balances ranging from 1 million XRP ($1.15 million) to 5 million XRP ($11.5 million) now amount to 1,922. This category of wallets holds over 4.4 billion XRP, representing about 7.5% of the circulating XRP supply of 58.1 billion tokens.

Meanwhile, data indicates that there are only 208 whale addresses holding between 5 million XRP ($11.5 million) and 10 million XRP ($23 million), with these whales cumulatively controlling 1.397 billion XRP. 

XRP Rich List
XRP Rich List

However, more investors hold balances ranging from 10 million XRP ($23 million) to 20 million XRP ($46 million), amounting to 270 at press time. 

Those holding between 100 million tokens ($230 million) and 500 million XRP ($1.15 billion) total 56, while only 24 wallets hold between 500 million and 1 billion XRP, likely Ripple-affiliated wallets and exchanges. Further, 5 wallets hold 1 billion XRP and more.

Together, there are about 4,904 millionaire XRP addresses, representing only 0.077% of the total XRP wallets at 6.288 million. 

Persistent Accumulation Trend

Interestingly, while millionaire addresses have reduced in recent times, the ones who remain have continued to increase their balances in what seems like a “buy-the-dip” push.

According to data from Santiment, investors holding between 1 million and 100 million XRP have added to their holdings over the past month. Notably, those with 1 million to 10 million XRP have accumulated 200 million XRP since Feb. 17, now holding 5.61 billion tokens. Meanwhile, the ones with 10 million to 100 million XRP now hold 6.83 billion XRP, having amassed 290 million tokens since late February.

XRP Whale Accumulation Santiment
XRP Whale Accumulation | Santiment

Expert Shares 5 Key Indicators Suggesting Bitcoin Bull Cycle Is Still On

0

Amid mixed opinions, prominent market analyst Sam Price has identified key market macro signals that indicate that the bull cycle is still on.

In a tweet today, he insisted that several indicators suggest that Bitcoin is closer to the price bottom than it is to the top. As a result, he stated that those not considering leveraging the recent dip to stack the pioneering cryptocurrency are “just not using clear logic.”

Notably, the analysis comes on the back of growing curiosity among market participants if the Bitcoin 2024/2025 bull cycle peaked at $109,000. It also follows a bold assertion from CryptoQuant’s CEO, Ki Young Ju, that the bull market is over.

Analyst Highlights Bullish Indicators

Price highlighted the first metric as the Pi Cycle Indicator, a Phillip Swift-developed tool that has accurately predicted Bitcoin’s top historically. The indicator flashes a top when the 111-day moving average crosses the 350-day moving average x2 (350DMA x2).

An accompanying chart shows that these moving averages are still far from overlapping, with the analyst insisting that Bitcoin is closer to the bottom than its top.

Pi Bitcoin Top Indicator

Furthermore, Price stated that Bitcoin’s recent dip correlates with a forming macro higher-low price action, which precedes a strong rebound to higher highs. However, the professional trader noted that a close between $58,000 and $56,000 on the weekly timeframe would invalidate the macro trend.

Hidden Bullish Divergence Shows Uptrend Continuation

Furthermore, the analyst pointed out a hidden bullish divergence on the asset’s weekly timeframe, a strong signal of an uptrend continuation. For perspective, this metric is characterized by the formation of a higher low on the price chart and an oscillator trending in a lower low pattern.

A price chart shows that while Bitcoin formed a higher low with an over 23% correction from its January 20 high, the relative strength index (RSI) has formed a lower low. Moreover, a rebound looks most probable with an oversold Stochastic RSI and the premier asset’s trend close to the Golden Pocket at the 1.618 Fibonacci level.

Hidden Bullish Divergence

RSI and FGI Indicate Imminent Rebound

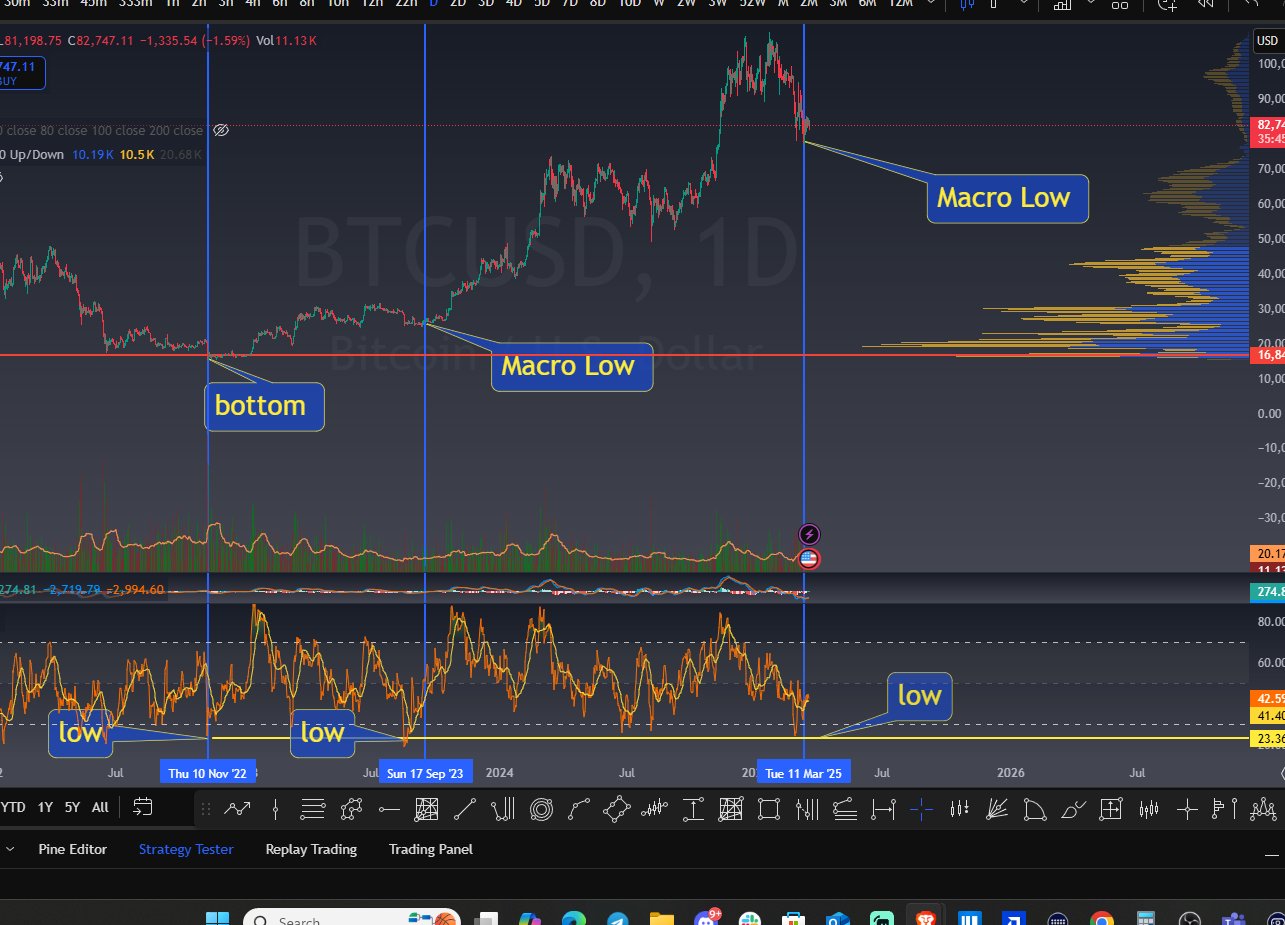
Meanwhile, Price identified another bullish indicator: the daily RSI. He shared that the metric hit 23 on March 11, a low last seen only twice in the previous years. Furthermore, each decline to such an oversold level has marked a macro bottom.

For instance, Bitcoin’s RSI dropped to 23 on November 10, 2022, when the asset corrected to a low of $15,854. The oscillator hit the number again on September 7, 2023, at around $25,639. Notably, each marked a price low for Bitcoin, which surged extensively to new highs.

Macro Lows Following RSI Drop to 23

Additionally, Price cited Bitcoin’s Fear and Greed Index (FGI) drop to 10 on February 27 as a sign of a price bottom. The analyst maintained that the indicator and others mentioned earlier were strong signals for investors to dollar-cost average (DCA) their Bitcoin positions.

In the meantime, Bitcoin trades at $83,548, rebounding slightly from yesterday’s flush. Notably, analyst Ali Martinez highlighted that the leading cryptocurrency must reclaim $93,700 to keep the bull season alive.

Binance BNB Faces Strong Supply at $640: Is Breakout Rally $672 To Possible?

Binance Coin’s price struggles to surpass the $640 supply zone. Will the growing BSC network fuel the next breakout rally to $672?

With growing volatility in the market, BNB price witnesses an intraday pullback of 1.72%. Currently, the BNB token trades at a market price of $617 and records a 7-day return of 11.39%. 

Despite the short-term recovery, the BNB token price trend warns of a steeper correction. Will this pullback result in a downfalling Binance Coin price to $570? Let’s find out.

Binance Coin Price Struggles at $640

The 4-hour price chart shows Binance Coin’s price showcases a quick V-shift reversal from the $531 level. This recovery run has surpassed the local resistance trendline for a breakout rally. 

Binance Coin Price
Binance Coin Price

However, the post-retest reversal run in Binance Coin fails to surpass the crucial supply zone at $640. The bullish struggle led to a short consolidation phase followed by a pullback. 

Currently, the pullback in Binance Coin is testing the 50% Fibonacci level at $670. The bullish failure has led to a bearish crossover in the MACD and signal lines. 

With the resurgence of negative histograms, the momentum indicator triggers a sell signal. However, the supertrend indicator maintains a bullish line at $601.9. 

As Binance Coin creates its third consecutive bearish candle, the lower price rejection reflects the 50% Fibonacci level absorbing the incoming supply. Still, given the growing volatility in the market, the coin’s price is likely to test the $600 psychological mark.

Binance Smart Chain Growth

Despite the growing fear of a pullback, the BNB Chain is witnessing significant growth. As per a recent tweet by Elja Boom, the founder of OKSE, the BNB season is getting closer. 

The Binance Smart Chain recently flipped Solana to rank number one in 24-hour Decentralized Exchange trading volume. Furthermore, the Total Locked Value (TVL) has increased by 7% weekly over the past seven days. 

Currently, the TVL of Binance Smart Chain stands at $5.334 billion. With the recovery in the DeFi space, PancakeSwap, built on BSC, has become the #1 DEX by revenue over the past 24 hours, as per the tweet’s timeframe.

Furthermore, bridging activity over Binance Smart Chain has significantly increased, primarily from Ethereum.

Binance Coin Price Target

As network growth is likely to fuel demand for Binance Coin, the market price could see significant upward momentum. However, the price action analysis suggests a breakout above the $640 supply zone is needed for bullish confirmation.

Beyond this, Fibonacci levels suggest price targets extending from $672 to $717. On the flip side, key support levels are at the 38.2% Fibonacci level around $595, and the 23.6% level at $570.

Cardano Eyes Range Breakout: Can Bulls Push ADA To $1?

Cardano is teasing a range breakout rally as social sentiment around ADA improves. Will this surge ADA’s price to $1?

With Bitcoin sustaining above the $83,000 mark, Cardano is waiting for a bullish comeback from a range-bound movement. Fluctuating in market cap, Cardano has been exchanging positions with Dogecoin for the 8th largest cryptocurrency in the market.

Currently, Cardano holds a valuation of $24.99 billion. Furthermore, the short-term consolidation is nearing a potential conclusion. Will this result in an ADA price rally above the $1 mark?

Cardano’s Reversal Eyes Range Breakout Rally

In the 4-hour price chart, Cardano has been maintaining a sideways trend since last week. The ADA trend momentum is coiling up, trapped within a range between $0.66 and $0.77. 

Cardano price chart
Cardano price chart

The Fibonacci levels further emphasize the significance of the range; the 38.2% and 50% retracement levels align with the $0.66 and $0.77 levels, respectively. Additionally, the Bollinger Bands are squeezing due to the consolidation range, reflecting intense compression of the trend momentum.

Currently, Cardano is facing resistance from the 20-day SMA, which acts as the midline of the Bollinger Bands. However, the short-term recovery hints at a potential bullish crossover in the MACD and signal lines.

Nevertheless, the moving averages are still in a negative trend, indicating weaker bullish strength.

Bullish Sentiments Spike Hits 4-month High 

Despite the consolidation over the 4-hour price chart, the social sentiment for Cardano has significantly improved. According to the latest tweet by Santiment, altcoins like Cardano are witnessing massive positive sentiment. 

Image

According to the on-chain platform, bullish comments have surged as the U.S. Securities and Exchange Commission (SEC) classified ADA’s use case as “smart contracts for government services.”

This has driven the Cardano community’s bullish sentiment to its highest level in the past four months. Currently, for every negative comment toward Cardano, the market is seeing 3.5 positive comments. This is the highest since the week of October 30 to November 6.

Cardano (ADA) Price Targets 

As social sentiment for Cardano improves, the likelihood of a range breakout also increases. However, this depends on whether the bullish sentiment turns into actual demand for the ADA token.

Based on Fibonacci levels, a breakout rally would likely challenge the 78.6% Fibonacci level, slightly above the $1 psychological mark. On the flip side, the critical support levels are at $0.66, followed by $0.53.

Shiba Inu Security Outfit Warns of Fake Shibaswap: Here’s How To Stay Safe

0

Scammers are looking to steal Shibaswap user assets, according to a warning from Shiba Inu-focused security outfit Susbarium.

As in any industry, scammers in the crypto space are always devising new schemes to rob users of their hard-earned money. In the latest instance, these scammers target users of the Shiba Inu-developed decentralized exchange Shibaswap.

Fake Shibaswap 

Scammers are looking to steal Shibaswap user assets, according to a warning from Shiba Inu-focused security outfit Susbarium, also known as “Shibarium Trustwatch.”

On Tuesday, March 18, Susbarium warned that these bad actors were launching fake Shibaswap websites to achieve their aims, urging users to be careful.

While the security outfit did not elaborate, these fake Shibaswap websites are likely linked to wallet drainers, which siphon assets once the user connects their wallet. At the time of writing, it is currently unclear if any user has lost money to the scheme.

Meanwhile, it is not the first time a security platform has warned of fake Shibaswap links. “Jack Fake-Killer,” an X account dedicated to exposing phishing links, first warned of such a scheme on January 13.

Beyond the Shibaswap scam, The Crypto Basic has called attention to numerous instances of fraudulent endeavors targeting Shiba Inu holders.

How Shiba Inu Holders Can Stay Safe from Shibaswap scam

The fake Shibaswap scam is a phishing link scam that relies on users’ failure to spot slight changes in website URLs. Below are some tips to stay safe, including tips from Susbarium.

  • Always double-check the Shibaswap URL before accessing it or connecting your wallet. Notably, the only official ShibaSwap site is “https://shibaswap.com.”
  • Bookmark the official Shibaswap website for easy and quick access.
  • Be wary of using Shibaswap links shared in forums.
  • Use tools like Scam Advisor and Scam Sniffer to double-check URLs when unsure.
  • Never share your wallet seed phrases.

Top Analyst Shares Level XRP Must Hold to Avoid a Steep Decline to $1.60

0

XRP may decline steeply to levels last seen in November 2024 if it fails to sustain current levels and corrects below the psychological $2 price mark.

The cryptocurrency market has continued to grapple uncertainty as the FOMC meeting draws closer, with XRP joining the trend. For perspective, the digital asset surged nearly 2% on Monday, only to relinquish all its gains the following day.

While these unclear price actions continue, an analytical insight has identified the levels XRP needs to hold to sustain bullish traction. Prominent market watcher Ali Martinez has highlighted the only key support in the asset’s path to a 29% decline to $1.60.

No Significant Support Below $2

Martinez noted in a tweet today that XRP could be preparing for a substantial price development. He insinuated that the direction could be downward and warned of a free fall to $1.60 if the $2 support failed to cushion further retracement.

Meanwhile, the analyst based this disposition on the lack of pronounced support below the psychological $2 mark. An accompanying chart shows an air gap below $2, with the next crucial demand wall at $1.63.

XRP URPD ATH-Partitioned Chart/Ali Martinez

Martinez highlighted the possible support area using the UTXO Realized Price Distribution (URPD) ATH-Partitioned indicator. For the uninitiated, this metric tracks the number of XRP tokens users moved at a particular price, providing insight into the average cost of existing unspent transaction outputs (UTXOs).

This divides XRP’s price ranges into equal partitions between $0 and its all-time high, highlighting the amount of asset acquired at a particular price. This way, zones with higher and lower demands are identified.

At $2.38, market participants moved 2.39 billion XRP, serving as a substantial support area for the asset. However, below $2, the URPD dropped significantly, suggesting little or no significant support around the region until $1.63, where users moved 1.13 billion XRP.

Notably, this analysis aligns with Martinez’s earlier assertion that a drop below $2 could spur a capitulation to $1.27, citing a forming head and shoulder price pattern.

Analyst Says $1.60 Too Steep

Meanwhile, CryptoLax has insisted that XRP to $1.60 is “quite steep.” He highlighted that the token could face resistance as it trends towards a supply zone in the 4-hour timeframe.

However, his commentary suggested that a rejection from the zone would push XRP to $2 in the worst-case scenario. An accompanying chart shows that the analyst expects the asset to hold the support trendline, which has served as a buffer to the asset’s recent downtrends.

XRP Analysis/CryptoLax

In the meantime, XRP trades at $2.2992, up less than 1% in the past 24 hours.

Shiba Inu Reaches 1.5M Holders Milestone as Shibarium Completes 10M Blocks

0

Unpalatable crypto market conditions have not stopped the Shiba Inu (SHIB) ecosystem from recording major milestones.

For one, Shiba Inu has now crossed a major on-chain holder milestone.

1.5M Shiba Inu Holders

This week, Shiba Inu crossed 1.5 million holders, as highlighted by the project’s marketing lead, LUCIE. Specifically, the popular meme coin hit this milestone on Monday, March 18. Meanwhile, the Shiba Inu ecosystem has welcomed 843 more holders to the tally as of the time of writing on Wednesday, March 19.

Overview of Shiba Inu metrics showing holders count
Overview of Shiba Inu metrics showing holders count. Source: Etherscan

The milestone highlights the significant growth and continued interest in the token, which is typically seen as bullish. Meanwhile, recent feats are not limited to the SHIB token.

Shibarium Reaches 10M Blocks 

While SHIB has surpassed 1.5 million holders, Shibarium, the meme coin’s Ethereum Layer 2 network, has surpassed 10 million blocks. At the time of writing, the network has recorded 10,010,974 blocks.

This is a testament to the network’s longevity and reliability, which could make it more attractive to new users. Already, the network has seen an explosion in total addresses in recent weeks, with the tally now sitting near 175 million.

Shiba Inu Shibarium metric

This growth is important as the network plays a key role in burning SHIB tokens, a contributing price control mechanism, as investors hope that a diminishing supply matched with solid demand will send the meme coin soaring. Recently, The Crypto Basic reported that Shibarium had helped burn a total of 713 million SHIB.

The recent SHIB and Shibarium milestones are even more significant when considering the ongoing downturn in the crypto market.

For context, SHIB has tanked as much as 68% in the past four months, falling from a high of $0.00003343 in December 2024 to trade as low as $0.00001082 in March 2025.

At the same time, there is still concern that the meme coin has underperformed the competition. Specifically, SHIB only soared about 98% following the U.S. election, while Dogecoin surged over 200%.

Meanwhile, the latest statistics offer investors a glimmer of hope for SHIB investors.

Ethereum Eyes $2,100: Can FOMC News Spark a Bullish Rally?

Ethereum price trend targets $2,100 with a range breakout as the market recovers before the FOMC meeting results. 

With less than 12 hours left for the Federal rate cut decisions to go live, the crypto market is witnessing a minor recovery. Bitcoin is above $83,000, and Ethereum is gradually inching closer to the $2,000 mark. 

While the broader market expects the Fed to keep rates unchanged, growing anticipation is driving the short-term recovery. Will this short-term recovery lead to a breakout in Ethereum, pushing it past the $2,100 mark?

Ethereum Price Eyes Range Breakout Rally

In the 4-hour price chart, the Ethereum price trend reveals a breakout of a short-term resistance line. This hints at the conclusion of a lower-high trend formation. 

Ethereum Price Chart

Moreover, the breakout rally is now targeting a range breakout. The consolidation range in Ethereum extends from $1,850 to $1,950.

Currently, Ethereum’s recovery run has created three consecutive bullish candles, which increases the chances of a breakout rally. 

With the bullish sentiments gradually improving, the MACD and signal lines approach the positive territory.  Furthermore, as the bullish histograms resurface, the momentum indicator triggers a buy signal for Ethereum.

Justin Sun Adds $100M ETH to Staking

Amid the short-term recovery, a key figure in the industry is growing bullish on Ethereum.

According to Arkham Intelligence, Justin Sun, the founder of the Tron ecosystem, has staked $100 million in Ethereum. This move seeks to generate $3 million in ETH per year.


Ethereum ETFs Hit 10 Consecutive Days of Outflow

Despite the short-term recovery and the confidence of key figures, inflows into Ethereum ETFs continue to decline. On March 18, Ethereum ETFs experienced an outflow of $52.82 million, marking their 10th consecutive day of outflows.

Ethereum ETFs
Ethereum ETFs

Leading these outflows, BlackRock recorded $40.17 million in outflows, followed by Grayscale with $9.33 million and Fidelity with $3.32 million.

The remaining six Ethereum ETFs maintained a net-zero flow. The total volume traded on March 18 was recorded at $235.78 million, with total net assets standing at $6.56 billion.

Ethereum Price Targets

Based on the price action analysis, the breakout of Ethereum, amid the growing anticipation of Fed rate cuts, will likely fuel the next rally. Ethereum’s price could retest the overhead resistance near $2,076, followed by the 200 EMA at $2,260.

On the flip side, a potential retest of the broken resistance trendline is possible near the $1,900 mark.