Home Blog Page 903

XRP 2W TD Sequential Has Been Accurate Since 2022: Here’s What It’s Saying Now 

0

The XRP TD Sequential indicator on the 2-week timeframe has been accurate for three years, and data suggests it now sends bearish signals.

XRP has had a turbulent month in February after posting remarkable gains from November 2024 to January 2025. Notably, within this period, the asset enjoyed an impressive 336% increase, reclaiming the psychologically important levels at $1, $2 and $3 along the way.

However, with a 26.67% drop this month, February 2025, XRP has relinquished some of the recent gains. The asset has so far forfeited the $3 price mark, but the bulls are now mounting a potent defense, effectively looking to hedge against a crash below $2. 

TD Sequential Points to More Downside

Some analysts have insisted that there is no cause for concern as long as XRP holds $2. Nonetheless, the latest analysis from market watcher Ali Martinez suggests that the XRP correction might not yet be over. 

Taking to X, the market commentator called attention to the TD Sequential indicator, a reliable analytical tool. For the uninitiated, The TD Sequential is a technical indicator that detects potential trend reversals by analyzing price bar sequences to signal overbought or oversold conditions.

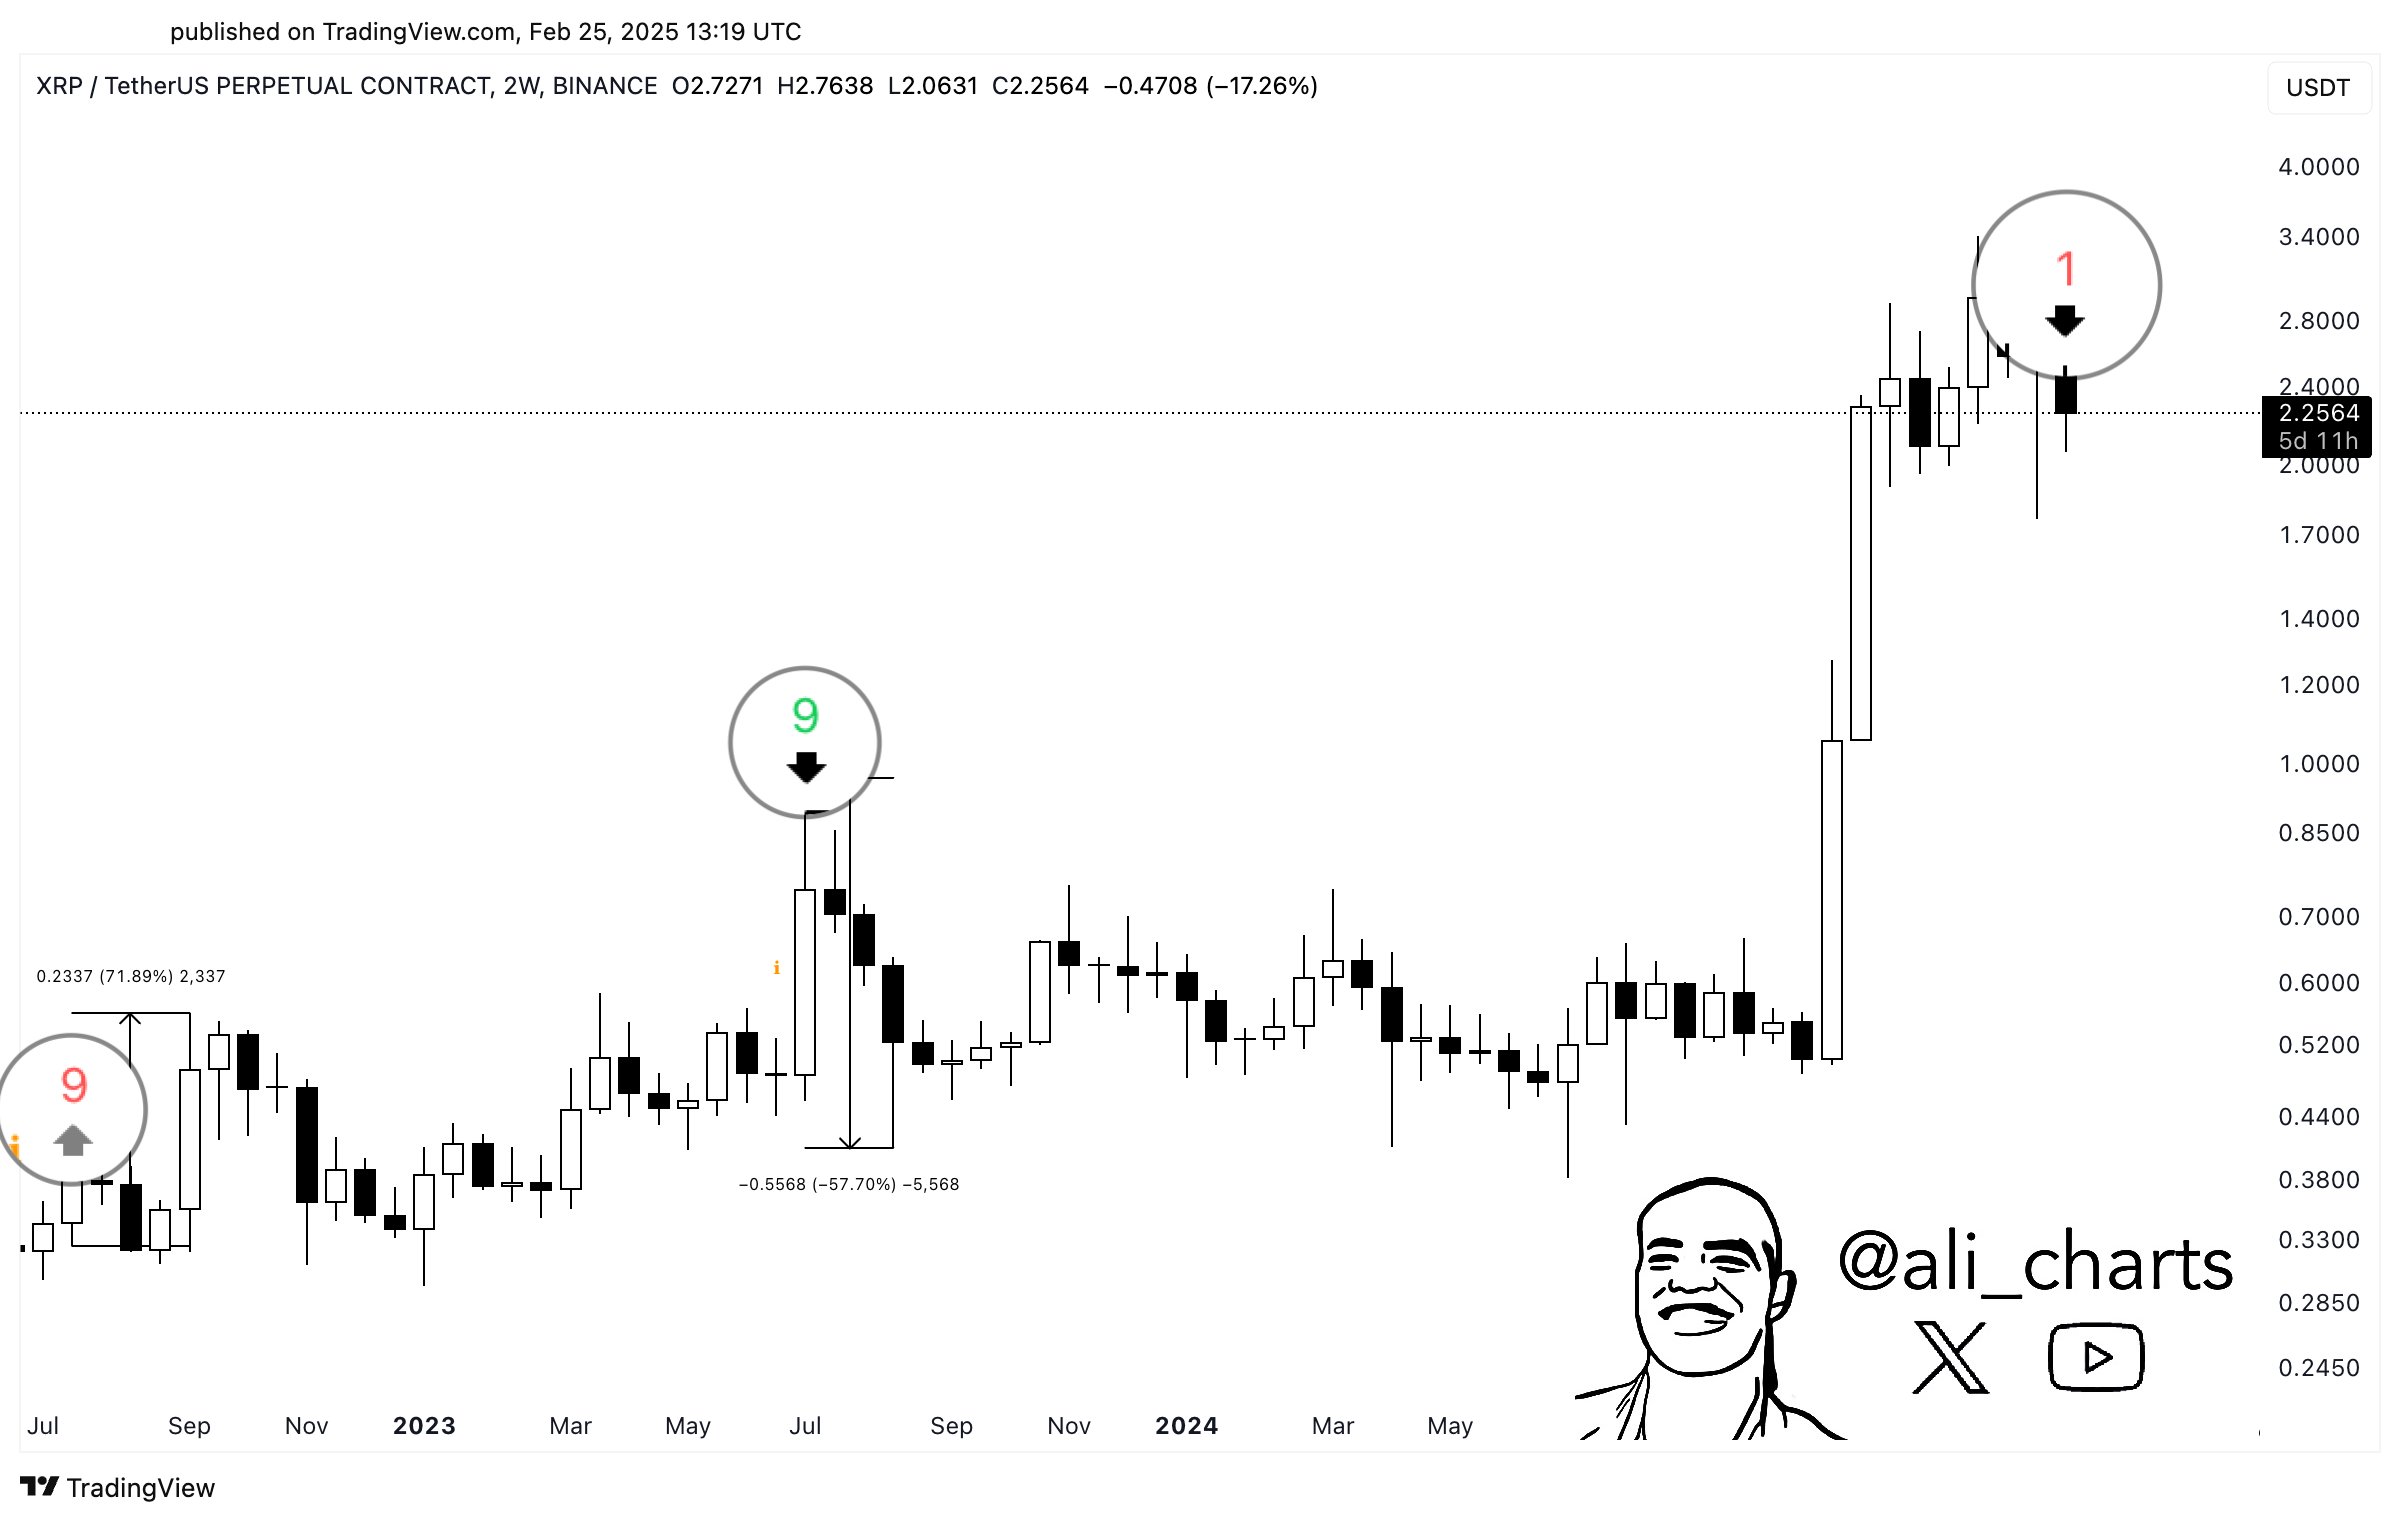
According to Ali Martinez, this indicator has been accurate for XRP in the 2-week timeframe since 2022. Particularly, in mid-2022, after the market downtrend from the Terra implosion, the TD Sequential flashed a buy signal for XRP. Shortly after this signal, XRP surged to a peak of $0.5582 in September 2022, marking a 71.89% increase.

Meanwhile, in July 2023, after XRP’s run to $0.93 on the back of the summary judgment in the Ripple v. SEC case, the indicator flashed a sell signal. In response, XRP collapsed in the weeks that followed, dropping 57% to a low of $0.43 by August 2023.
XRP 2W TD Sequential Ali Charts
XRP 2W TD Sequential | Ali Charts

Now, the TD Sequential has again displayed a sell signal. The use of 1 indicates the start of a new bearish Setup phase. This suggests that the downtrend may continue, as the indicator has begun counting a new sequence of qualifying price bars in the same direction.

XRP Long-Term Outlook Still Bullish

As a result, XRP investors might not see a relief just yet, especially if Bitcoin continues to consolidate or drop to new lows this year. Earlier today, The Crypto Basic confirmed that whales had already begun offloading some of their holdings. For context, over the past five days, some whales have dumped $851 million worth of tokens. 

Also, Martinez noted in a previous analysis that XRP would need to hold above the $2.27 support for a chance at recovering $3 in the short term. The asset has given up this support so far. Despite the impending short-term drop signaled by the TD Sequential indicator, Martinez believes XRP could hit higher levels in the long term. 

Last month, he suggested that XRP may be on the verge of surging to a $15 mark, representing a 584% increase from current levels. He cited a breakout from a 7-year symmetrical triangle. Despite currently trading for $2.22 with a 0.78% 24-hour drop, XRP is still respecting the breakout.

Expert Says XRP is Holding Up Better Than 90% of Altcoins

0

XRP has shown remarkable resilience compared to its rivals in the market, avoiding a new bottom after yesterday’s bloodbath.

The crypto market experienced one of its most volatile days on Tuesday, with XRP, Bitcoin, and other major markets crashing significantly.

XRP Held Up Better Than Bitcoin

On Tuesday, XRP revisited lows of $2.07, a fresh low for the week, following a 14% intraday drop. However, this was not XRP’s most significant dip in February.

Particularly, during the February 3 downturn, XRP’s price dipped as low as $1.70. Nonetheless, in the most recent crash, the asset has shown impressive resilience.

For context, during the Tuesday market-wide crash, Bitcoin’s price fell below $86K, marking its lowest point since November 2024.

Notably, XRP displayed more resilience than Bitcoin during the market bloodbath, avoiding new lower lows and deviating from Bitcoin’s major drawdown.

Market watchers have taken note of this impressive performance from XRP.

In a tweet, Dom, a widely followed XRP analyst, emphasized that XRP still looks strong from its current position. According to him, XRP’s market only experienced a “fakeout” below the critical $2.25 level.

What Will Determine XRP’s Rebound?

Meanwhile, Dom pointed out that XRP must close the daily candle above this key level and not fall below it.

He also mentioned that he plans to share more insights soon but will first observe how Bitcoin reacts in the next few days. According to Dom, Bitcoin’s $85K region has been his downside “target” for weeks.

Dom also argued that a price below $85K would open up a different story for Bitcoin and the broader market.

Despite the cautious sentiment, Dom expressed optimism, stating that XRP is holding up better than 90% of altcoins and that its chart isn’t broken.

Another analyst, Charting Guy, expressed a similar sentiment in a separate commentary. He noted that XRP continues to hold above the bull market support band without falling below.

Image
Chart showing XRP holding strong by Charting Guy

XRP is Holding Up Better Than 90% of Altcoins

Further data from Coincodex confirms that XRP is holding up much better than the majority of altcoins in the top rankings. Specifically, it shows that XRP outperformed 93% of the top 100 most prominent crypto assets.

XRP outperfoming majors
XRP outperforming majors | Coincodex

Moreover, while XRP avoided creating a lower low on Tuesday, altcoins like Solana (SOL) and Dogecoin (DOGE) hit bottom points not seen since 2024.

Now, XRP is already rebounding, posting an impressive 7.5% gain as it trades at $2.31. This has reduced its weekly loss to just 9.4%.

Meanwhile, Solana, despite a 5% gain today, is still nursing a staggering weekly loss of 17% and a monthly drop of 38%. Similar figures can be observed with Dogecoin as well.

Dogecoin Network Activity Tanks by 95%, Is Demand Fading?

0

Analyst Ali Martinez observes a massive 95% drop in the active addresses of Dogecoin, signaling a sharp decline in network activity.

Dogecoin’s price experienced a notable decline recently, with investors incurring significant losses. At the time of this writing, DOGE is trading at $0.213, marking a 5.17% increase in the past 24 hours. Despite this short-term gain, the asset remains 15.72% lower over the last seven days, reflecting ongoing volatility.

Declining Network Activity Raises Concerns

While Dogecoin attempts to recover, a decrease in network activity has been observed. Analyst Ali Martinez highlighted this trend, noting a significant drop in active addresses over the past three months. 

On November 21, 2024, the network recorded 1,292,770 new active addresses, with activity peaking above 2.4 million addresses. However, this surge was short-lived.

Between December 2024 and February 2025, the number of active addresses fell by approximately 95%. By February 23, 2025, only 30,815 new addresses were recorded, confirming a substantial decline in Dogecoin’s network engagement.

The price movement reflected this pattern, dropping from $0.4868 to $0.196. The correlation between reduced network activity and price depreciation indicates weakened demand.

Shifts in Dogecoin Ownership Structure

A separate analysis examined the distribution of DOGE holders over different time frames. The study categorized holders into three groups: long-term investors (1+ year), mid-term holders (1-12 months), and short-term traders (<1 month).

Recent data revealed a 2.67% decline in the percentage of long-term holders, signaling reduced accumulation over time. Additionally, mid-term holders experienced an 11.81% decline, indicating that a significant portion of investors exited the market.

Conversely, the percentage of short-term traders surged by 107.45%, showing increased speculative activity. These shifts suggest that Dogecoin’s investor base is transitioning toward short-term trading rather than long-term holding.

Dogecoin Balance by Time Held

Potential Rebound For Dogecoin Price

Despite recent setbacks, an analyst suggests that Dogecoin’s correction phase might be nearing completion. Market analyst CryptoELITES predicted an imminent rebound, setting ambitious targets for DOGE.

His analysis identified a cup-and-handle pattern from Dogecoin’s 2024 peak and recent lows. Following a price pullback and consolidation, the asset could be retesting the neckline before a potential bullish continuation.

CryptoELITES outlined three price targets, anticipating a 255% rally to $0.75, slightly surpassing its 2021 all-time high. Meanwhile, he further projected continued upward momentum, pushing DOGE to $1.5 and ultimately reaching $5, representing a 2,270% surge.

If You Hold 50M, 100M, or 1B Shiba Inu, Here are Your Returns if SHIB Hits $0.0001

0

The potential returns for Shiba Inu holders with 50M, 100M, and 1B SHIB token investments could reach sixfold if the coin hits $0.0001.

Shiba Inu remains one of the most widely held crypto assets, with over 1.49 million holders. Although Shiba Inu’s price has been unimpressive in recent weeks, many continue to have high hopes for the coin.

In the last 90 days, Shiba Inu’s value has tanked by 43%, but proponents still hope that the coin could drop another leading zero this year. This lingering bullish perspective relies on how quickly Shiba Inu’s price has historically moved up when the bulls take control of the market.

With these hopes flying high, The Crypto Basic analyzes how those holding 50 million SHIB tokens up to 1 billion tokens could benefit if Shiba Inu drops another leading zero.

Returns of 50M, 100M, and 1B Shiba Inu if SHIB Hits $0.0001

At press time, Shiba Inu is trading for $0.00001445. At this price, 50 million SHIB tokens are worth $722.5. However, if Shiba Inu cancels a zero and trades in the $0.0001 range, this holding would see its value increase to $5,000.

In this speculative scenario, the return on this investment would be $4,277.5, reflecting a 592% upside.

Notably, a similar percentage appreciation applies to those with significantly higher exposure to Shiba Inu. Specifically, for holders with 100 million SHIB tokens, the portfolio would be worth $10,000 when the unit price hits $0.0001. Meanwhile, as of today, acquiring 100 million Shiba Inu tokens costs $1,445.

As for the Shiba Inu “billionaires” holding 1 billion SHIB tokens or more, they stand to see their portfolio expand by 6X as well. In particular, 1 billion SHIB tokens would be worth $100,000 if Shiba Inu’s unit price reaches $0.0001. For context, acquiring this portfolio requires a more substantial initial investment of $14,450.

Essentially, Shiba Inu holders stand to net significant profits from their holdings should the token eliminate another zero, as seen in 2024. While this prospect is promising, the question remains: Can SHIB actually reach $0.0001, and if so, when could it happen?

Timeline for SHIB to Reach $0.0001

Market commentators in the crypto community are nearly unanimous that Shiba Inu could hit $0.0001 this season. Optimism about this outlook was high in the first quarter of 2024 when the asset staged a 4X surge in less than two weeks.

However, in recent times, Shiba Inu has posted a consistent downtrend, weakening the prospect of a run to $0.0001.

Meanwhile, Telegaon analysts argue that it could take two years for Shiba Inu to reach $0.0001. Remarkably, analysts at Changelly also agree with this 2027 timeline.

Shiba Inu reaching $00001 by Changelly

Bitcoin to $75K? Why It Doesn’t Matter According to Raoul Pal

0

Bitcoin could fall to $75,000 in the short term, according to crypto pundit Raoul Pal. Still, he believes this potential drop does not matter.

Pal expressed this view in what appears to be a teaser for a coming Real Vision episode featuring Julien Bittel, Head of Macro Research at Global Macro Investor. 

“People see this chart; they worry about the fact that it shows that Bitcoin comes down to $75,000, but what we proved is, last time around this happened, Bitcoin went down quickly and then recovered. And so, it didn’t matter,” Pal stressed in the clip.

While the “last time around” Pal is referring to is unclear, the analyst certainly believes that Bitcoin is replicating its 2017 run, during which it surged nearly 20x from about $1,000 to above the $19,000 price point.

Raoul argues that the same fundamental catalysts that drove that run are still at play here. These catalysts are dollar weakness and China stimulus.

The sentiments come as President Donald Trump has often lamented the impact of what he believes to be an overly strong dollar on U.S. manufacturing, a view likely shared by his treasury secretary pick, Scott Bessent.

And indeed, in China, the government is pursuing several stimulus packages to bolster economic growth. In the most recent example of this, the country is reportedly set to inject at least $55 billion into the banking system.

Pal contends that these factors will free up more liquidity, some of which will flow into the crypto market, which will send Bitcoin flying and eventually altcoins as well.

Nevertheless, at the time of writing, Bitcoin is trading just over the $88,400 price point, marginally recovering from its drop to three-month lows at $86,000 over the past 24 hours amid heightened inflation and trade war fears.

Can Avalanche (AVAX) Charge Toward $32 Amid Whale Activity Spike?

Will Avalanche (AVAX) price bounce back from $20 for a trendline breakout rally towards the $32.80 mark?

Avalanche is one of the fastest-recovering altcoins in the crypto market after the recent crash. The AVAX price marks an intraday surge of 1.92%, maintaining dominance near the $20 psychological support.

With growing buying interest, AVAX now aims to challenge the local resistance trendline. Will this bullish momentum lead to a breakout rally, or is another downturn ahead?

AVAX Price Trend: Signs of a Reversal?

In the daily chart, AVAX price action reveals a strong correction phase following a failed attempt to sustain higher levels. The recent downtrend has led to a bearish crossover between the 100-day and 200-day EMAs, increasing the risk of an extended bearish cycle.

Avalanche Price Chart

Currently, the AVAX token trades at $22.33, hinting at a potential Morning Star pattern. This bullish pattern formed after a lower price rejection from $20.30 yesterday, suggesting strong support at this level.

Further strengthening the bullish outlook, the daily RSI line exhibits a bullish divergence, indicating a potential trend reversal in the AVAX market. If buyers sustain the momentum, AVAX could soon challenge the overhead resistance trendline.

Whale Accumulation: A Positive Signal for Avalanche?

Fueling hopes for a bullish comeback, Avalanche’s network has experienced a resurgence in whale transactions. According to IntoTheBlock, large transactions on the Avalanche network are resurging after a prolonged decline.

Over the last three months, whale transaction count dropped significantly, from 1.52K transactions per day to just 210. However, this trend has reversed, with whale transactions surging back to 490 on February 25.

This renewed whale activity suggests growing confidence in AVAX, which could drive a strong price recovery soon.

Key Price Levels: Aiming for a Breakout or Facing Rejection?

AVAX is positioned for a potential trend reversal with rising whale interest and increasing demand. According to Fibonacci retracement levels, a breakout above the resistance could propel AVAX toward the 38.2% retracement level at $32.80.

This key resistance zone aligns with the 200-day EMA at $32.48, making it a crucial hurdle for the bulls. On the flip side, AVAX remains vulnerable to further downside risks.

If the price fails to hold above $20, a bearish breakdown could drag AVAX down to $17.28, its previous major support level.

Solana on Edge: Will $130 Support Hold, or Is a Bigger Crash Ahead?

Solana struggles below $140 as bearish momentum grows. Can Solana bulls hold the $130 support, or will the SOL price slide toward $65?

With the total crypto market cap falling to $2.87 trillion, altcoins are struggling to find crucial support. Amid the declining market conditions, Solana is trading under $140.

Currently, the SOL token trades at $139, with an intraday pullback of 3.05%. Will the bearish trend in Solana reach the $125 support level? Let’s find out.

Fear Spikes Among Solana Investors

As the decline continues, Solana investors have entered a state of fear. According to a recent tweet by crypto analyst Ali Martinez, the net unrealized profit and loss (NUPL) indicator by Santiment reveals that Solana is in the “Fear” zone and approaching “Capitulation.”

Furthermore, Solana’s transfer volume has plummeted from $1.99 billion in November 2024 to just $14.57 million today. This reveals a massive decline over the past three months, increasing the possibility of a bearish continuation.

Solana Price Analysis: A Bearish Outlook

In the daily chart, the SOL price trend reveals a massive crash after failing to surpass the $260 supply zone. The pullback has dropped Solana’s market price by nearly 47% from its $280 peak.

Solana Price Chart
Solana Price Chart

Furthermore, the bearish crossover in the 50-day and 100-day EMA lines increases the possibility of a death cross between the 50-day and 200-day EMAs. With the ongoing bearish trend, the daily RSI line has plunged into the oversold territory, reflecting increased selling momentum.

Derivatives Market: Optimism Despite the Drop

Despite the downfall in Solana prices, the short-term struggle near $140 has fueled minor optimism in the derivatives market. The long-to-short ratio in Solana derivatives has equalized, reflecting an equal number of bullish and bearish players in the market.

Solana Derivatives
Solana Derivatives

Furthermore, the Solana volume-weighted funding rate has turned positive, reaching 0.0033%, indicating traders’ willingness to pay a premium for long positions. Over the past 24 hours, liquidations have also nearly equalized, with long positions accounting for $13.59 million, while short liquidations have risen to $12.95 million.

Overall, the Solana derivatives market has witnessed a minor drop in open interest by 1.54%, bringing it down to $4.35 billion.

Crucial Support Level at $130

Analyst Ali Martinez highlights a right-angled ascending broadening formation on Solana’s 3-day chart. Currently, the price within this formation is approaching crucial support near $130.

If bulls fail to defend the $130 level, the downtrend may continue toward $65, according to Martinez.

Ethereum at $2,500: Can a Rally to $2,900 Happen?

Ethereum is facing resistance near $2,500 after a 25% plunge. Can whale accumulations and rising staking interest fuel a comeback?

As Bitcoin stabilizes near the $88,000 mark after a massive crash, Ethereum has bounced back above $2,400. Currently, ETH trades at a market value of $2,478, with a short-term recovery of nearly 5%.

As the bullish turnaround retests a broken range, is Ethereum bound for a post-retest reversal, or will it surpass $2,500?

Ethereum Price Marks Crucial 4-Hour Range Breakdown

In the 4-hour price chart, the Ethereum price trend showcases a bearish breakdown of a consolidation range. The sideways consolidation ranged between $2,529 and $2,883.

Ethereum Price Chart

Upon the breakdown, Ethereum tested a 24-hour low at $2,319. However, after a massive plunge, bearish exhaustion led to Ethereum’s short-term relief rally.

With a short-term bullish recovery, Ethereum is now retesting the broken consolidation range. However, the possibility of a new evening star pattern near the support-turned-resistance level warns of a bearish turnaround.

Furthermore, the Ethereum price failed to sustain above the $2,500 psychological zone, facing a higher price rejection from $2,530. Hence, the short-term price analysis hints at a potential bearish turnaround.

A Battle at $2,500

Meanwhile, the bullish comeback has resulted in a declining trend in bearish histograms. If Ethereum’s recovery continues, the Chaikin Money Flow Index, which has finally turned positive after days of consolidation, supports the possibility of a bullish reversal.

Hence, the technical indicators give a bullish viewpoint contrary to the threat of an evening star pattern.

The Worst February Ever

Amid the highly volatile conditions, the Ethereum price trend has marked its worst February since 2017. Till 2024, Ethereum had recorded only one bearish February in 2018, with a decline of 24%.

Ethereum Historical Performance

However, the recent plunge has marked a nearly 25% downfall in February 2025. This marks Ethereum’s second and possibly worst February ever if it fails to bounce back. 

Whale Feast: Ethereum on Discount?

However, the chances of a bullish comeback for Ethereum are gradually increasing. As per a recent tweet by Crypto Jack, Ethereum balance by holder value has seen a significant surge. The balance range of 10,000 to 100,000 ETH has seen a notable increase, crossing the 17 million ETH mark. 

This highlights a massive buying spree among whales to acquire Ethereum at discounted prices.

Staking Surge: A $5 Billion Confidence Boost

The total Ethereum staked over the Aave network has seen a significant surge. Over the past year, the Ethereum staking pool on Aave has surged from 500,000 ETH to more than 2,000,000 ETH.

This amounts to more than $5 billion in staked Ethereum. With investors staking Ethereum for rewards and agreeing to a brief lock-in period, this signals increased confidence in the largest altcoin.

Final Verdict

As per the price action analysis, a bullish rebound above the lower band of the broken consolidation zone at $2,530 will likely reinstate a new bullish trend. This will increase the likelihood of Ethereum rebounding to the $2,900 level.

Conversely, if Ethereum fails to hold above $2,360, a bearish breakdown could push prices back to the previous swing low of $2,150.

Crypto Sectors Underperforming Bitcoin This Year, Delphi Digital Reveals as Risk-Off Sentiment Grows

0

According to Delphi Digital data, all crypto sectors have grossly underperformed Bitcoin this year.

In Q4 2024, the excitement in the crypto markets was palpable as the industry anticipated market effects from the presidency of Donald Trump, who had waxed pro-crypto on the campaign trail. However, things have taken a sharp turn with the turn of the new year.

Specifically, investor sentiment has soured amid inflation and trade war concerns. In the latest instance highlighting this, data from a crypto research firm has revealed gross underperformance across all crypto sectors year-to-date (YTD).

Investors Fleeing Speculative Crypto Sectors?

According to Delphi Digital data, shared on Tuesday, February 25, all crypto sectors have grossly underperformed Bitcoin this year.

While Bitcoin is down only a mild 5% YTD, Delphi Digital data suggests that most crypto sectors are seeing over 50% losses. AI framework projects are posting over 84% average losses, AI Agents are averaging over 70% in losses, memecoins nearly 52%, gaming the same, and modular frameworks over 47%.

Along with recent price action that has seen Bitcoin fail to establish a clear price trajectory while a number of altcoins take steep losses, the Delphi Digital data suggests investors are on the fence about Bitcoin while actively cutting exposure to more speculative assets amid uncertain market conditions.

Unsurprisingly, the data has sparked a mix of reactions from crypto community members. As one analyst highlighted, the recent market uncertainty will likely offer insight into the enduring strength of these crypto sectors as investment narratives.

Wen Crypto Market Rebound?

Several crypto analysts have attributed the recent crypto market rout to a lack of near-term catalysts. For instance, in a recent note to investors, JPMorgan analysts highlighted that while pro-crypto initiatives from the present U.S. administration were likely to boost the market, they would not kick in till the second half of the year.

As such, in the short term, analysts cautioned that the crypto markets continued to face downside risk, citing weakening demand and profit-taking from institutions.

Indeed, Bitcoin kicked off this week by falling to three-month lows, as exchange-traded funds saw their largest outflow day on record.

Here’s the Level Shiba Inu Must Hold For a 20% Rebound to $0.00001718

0

Shiba Inu hovers around a critical zone, and analysis suggests its price action around this level will determine whether it will rebound or see lower prices.

Shiba Inu surprisingly recorded a daily gain yesterday. While Bitcoin and most altcoins capitulated, the doggy-themed meme coin played contrarian, with a solid 3.3% price appreciation.

Nevertheless, Shiba Inu is down considerably in higher timeframes, correcting 8% and 25% in the past week and month, respectively. Meanwhile, SHIB’s show of strength yesterday has seen it hold a crucial price zone, which will determine its next course of action in the near term.

Shiba Inu At Major Crossroad

TradingView analyst Paul Endeo highlighted why Shiba Inu has been on the downside despite a bullish ecosystem. In his Tuesday commentary, he cited a potential head and shoulder pattern and bearish network conditions as reasons for the asset’s price decline.

The adverse conditions include dwindling institutional interest, weak network growth, and a lack of profitability among Shiba Inu holders. Notably, a recent the Crypto Basic report shows that on-chain activity for Shibarium has dropped drastically amid a lackadaisical price action.

Meanwhile, Endeo stressed the importance of Shiba Inu’s current level in determining its next short-term direction. The market watcher noted that, depending on its reaction to this zone, the second-largest meme coin by market cap would either rebound over 20% or nuke 11% to new lows.

Shiba Inu Analysis per Paul Endeo

Currently trading at $0.00001426, Shiba Inu trends around the support level at $0.0000147. The commentator asserted that the prominent meme coin needs to hold this level for a quick price rebound.

If SHIB holds the support, Endeo predicts it would recover 20% to this month’s price high of $0.00001718. However, a converse situation will push the token further downward, with an 11% southward trend to $0.00001261 on the cards.

Shiba Inu Analysis

Meanwhile, on-chain analysis shows an interesting development in the Shiba Inu ecosystem. Data from IntoTheBlock shows a spike in large transactions on the network, an indication of renewed whale interest.

In the past 24 hours, users made 101 transactions exceeding $100,000, a signal of growing whale interest in the ecosystem. Notably, this figure increased substantially from 44 seven days ago.

Nonetheless, other indicators have flashed bearish momentum. Net network growth, the “in the money” metric, and market user concentration have also indicated pessimism around the ecosystem.

Shiba Inu ITB
Shiba Inu ITB

SHIB trades at $0.000014226 with a relative strength index (RSI) of 44.91.