Home Blog Page 918

Here are XRP Price Levels to Watch as ETF Hopes Stir Excitement

0

EGRAG CRYPTO highlights key levels for the XRP community to watch as price surges on ETF hopes.

The XRP community has had several reasons to be excited in the past few months, and the good times may be set to roll.

Over the past 24 hours, the U.S. Securities and Exchange Commission has further stoked hopes of a near XRP exchange-traded fund approval, leading the asset to outperform the broader crypto market. Amid the rally, one analyst has highlighted key price levels that market participants should watch.

A Looming Bullish Breakout?

At the time of writing, XRP is trading at the $2.7 price point, representing a 6% gain in the past 24 hours, the most of any other crypto asset in the top ten by market capitalization. This follows the SEC’s move to call for public comments on XRP ETF applications from Canary Capital, CoinShares, and WisdomTree on Wednesday, February 19.

Commenting on the price action, highly followed crypto analyst “EGRAG CRYPTO” highlighted that the asset is bouncing off the bottom of an ascending triangle pattern on the 12-hour candle chart to likely target the top of the resistance zone around the $2.83 price point.

XRP bounces off bottom of ascending triangle
XRP bounces off bottom of ascending triangle. Source: EGRAG CRYPTO

The analyst, however, noted that the key level to watch was the $2.90 to $3.10 range, highlighting strong price resistance in this zone over the past few weeks and substantial upside room above.

“A Bullish signal will occur when XRP closes above $2.90-$3.10 with confirmation, turning it into strong support for a Bullish continuation and a major milestone from a structural perspective,” he wrote.

Specifically, EGRAG CRYPTO anticipates that a strong break above the $3.10 price level could send the asset back to multi-year highs of $3.4 reached in early January 2025, albeit with a potential pit stop at $3.2240.

One factor besides ETF speculation that could bolster XRP’s price is a positive resolution of the long-running case between the SEC and Ripple.

Many are growing increasingly hopeful of a resolution in this long-running legal battle that has clouded the asset’s prospects amid the SEC’s seeming pro-crypto leanings under the President Donald Trump administration.

Beyond the U.S., XRP may also receive a boost from Brazil, where the first XRP spot ETF has just been approved.

PEPE Nears Critical Support: Will Bulls Hold $0.0000092?

As meme coins gradually regain strength, is PEPE preparing to bounce back above $0.000010 and recover to $0.000013?

As the altcoin market recovers overnight, meme coins are gradually gaining momentum. The frog-themed meme coin, PEPE, has risen by 1.67% over the past 24 hours.

Although it is still trading below the $0.000010 psychological level, the short-term recovery suggests a potential comeback for PEPE.

PEPE Price Analysis Reveals a Critical Crossroads

On the daily chart, PEPE’s price action shows a significant reversal, reflecting strong bearish pressure. After breaking down from a falling wedge pattern, PEPE’s price has formed a triangle pattern.

PEPE Price Chart
PEPE Price Chart

In conjunction with the wedge breakdown, this creates a bearish pennant on the daily chart. PEPE has seen a short-term intraday recovery of 1.46%, currently trading at $0.0000094816.

The intraday recovery suggests the formation of a potential morning star pattern, which could test the overhead trendline near the $0.000010 psychological level.

However, the increasing bearish pressure has led to multiple sell signals. A bearish crossover between the 50-day and 200-day EMA lines has resulted in a death cross, which is typically seen as a signal for continued bearish momentum.

Additionally, the pennant formation on the daily chart is a continuation pattern, further increasing the chances of a breakdown. Since the start of 2025, PEPE has experienced a 52% decline.

Analyst Insight Reveals Crucial Support Levels

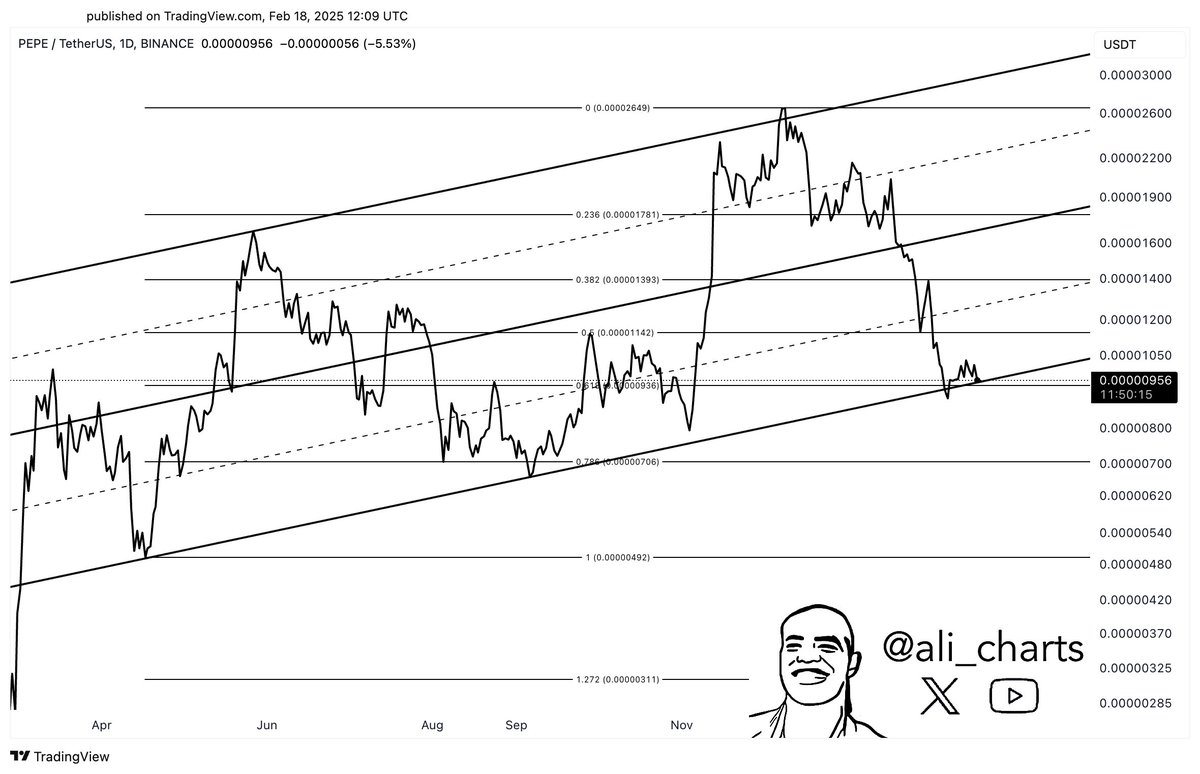
In a recent X post, Ali Martinez highlighted the importance of the $0.0000092 support level. He noted that a rising channel pattern is forming on the daily chart and predicted a sharp decline to $0.0000031 if PEPE closes below $0.0000092.

This critical support level aligns closely with the 67.80% Fibonacci level on his chart. However, the bearish target might be too aggressive, as two key support levels exist at $0.00000706 and $0.00000492.

Image

PEPE Price Targets

Based on Fibonacci levels, a potential recovery to test the local resistance trendline could trigger a breakout rally. If such a scenario plays out, PEPE could test the 50-day EMA line near the 50% Fibonacci level at $0.0000132674.

On the flip side, a bearish breakdown could push PEPE to test the $0.0000066378 support level.

SUI Price Recovery: Will a Double-Bottom Reversal Hit $5.35?

Amid the potential for a new altcoin season, SUI is now aiming for a breakout rally to reach $5.35 and possibly a new all-time high.

As Bitcoin breaks above the $97,000 mark, altcoins are experiencing a bullish run. The total crypto market cap, excluding Bitcoin, has reached $1.22 trillion, with a 24-hour surge of 1.79%.

Among the top-performing altcoins, SUI is regaining momentum. With a potential double-bottom reversal forming, the SUI price trend is signaling a bullish recovery. Will this recovery result in a new all-time high? Let’s explore.

SUI Price Reversal Nears $3.60 Neckline

In the daily chart, the SUI price trend witnessed a bullish failure to cross the $5.35 resistance in early 2025. This resulted in a quick downfall, testing the $3 psychological mark. 

SUI Price Chart
SUI Price Chart

The pullback phase accounted for a downfall of nearly 45%. However, strong bullish dominance at the $3 psychological mark, supported by the 50% Fibonacci level, helped absorb the incoming supply. 

The SUI price trend currently hints at a potential double-bottom reversal from this critical level. The double-bottom pattern is generally considered extremely bullish after a pullback phase. The neckline of the bullish pattern lies at $3.60. 

Currently, SUI trades at a market value of $3.29, with an intraday recovery of 2.36%. This is a bullish extension of the 5.19% jump yesterday.

With its two consecutive bullish patterns, the SUI price trend is hinting at a V-shaped reversal to complete the double-bottom pattern. Meanwhile, SUI is facing opposition from the 20-day SMA line, acting as the midline of the Bollinger bands.

Rising Social Dominance Supports Bullish Path

According to a recent post by LunarCrush Analytics, SUI’s social dominance has significantly recovered. The project’s social activity across all platforms is at its highest level in the past four months.

With the recent surge, SUI now accounts for 1.8% of all social activity in the crypto space, reflecting growing interest and hype around the project.

Will the TVL Rise Again?

On the DeFi side, the total value locked (TVL) of the SUI network remains at $1.455 billion. This marks a significant decline since the beginning of 2025. 

SUI TVL
SUI TVL

On January 1, the TVL was at $1.641 billion but has now dropped by 11.32% to $1.455 billion. Despite this, the daily volumes remain healthy at $185.83 million, with a stablecoin market cap of $478.96 million.

Given the solid liquidity across the network, the TVL is expected to recover. If it surpasses the 2025 high of $2.065 billion, the bull run in the SUI price trend could likely restart.

SUI Price Targets

Supporting the bullish outlook, the lower Bollinger Band has seen a significant uptick. However, the upper Bollinger Band continues its downward trend.

Still, the shift in momentum has triggered a positive crossover in the MACD and signal lines. With the rise of bullish histograms, the momentum indicator now supports breakout prospects.

According to the Fibonacci levels, the neckline is likely above the 68.9% level at $3.46. As such, the double-bottom reversal could challenge the 78.6% Fibonacci level at $4.19.

In an optimistic scenario, the Fibonacci levels suggest price targets ranging from $5.35 to $7.29 as the broader market recovers. On the downside, the $3 psychological mark is supported by the next horizontal level at $2.64.

Here’s Dogecoin Price if DOGE Reaches Tesla Market Cap

0

Dogecoin price would need to expand by 30-fold for it to reach the trillion-dollar market cap of electric car giant Tesla. 

Dogecoin continues to maintain its reign as one of the most prominent crypto assets, and eyes have been on it to see how it could perform in this market cycle. Market participants have speculated on various outcomes, including the possibility of Dogecoin attaining the valuation of Tesla.

This discussion holds weight amid ongoing endorsements from Elon Musk, including the fact that certain merchandise from the Tesla Shop is purchasable with DOGE.

Accordingly, this article explores the potential market valuation of Dogecoin in the hypothetical scenario where it attains Tesla’s market cap.

Dogecoin Price at Tesla Market Cap

Currently, Tesla has a market cap of $1.159 trillion with a stock price of $360.56, according to Companiesmarketcap.com. This valuation places the electric car company in the 11th position in the global ranking of the most valuable holdings.

Meanwhile, Dogecoin’s market cap sits at $37.51 billion, ranking as the eighth most valuable crypto asset. For Dogecoin to reach Tesla’s market cap, its valuation would need to expand by 30 times. 

Specifically, Dogecoin’s market cap would need to increase by 2,990% from its current position to reach Tesla’s $1.159 trillion. Notably, Dogecoin’s unit price is currently $0.25332. Accordingly, a 30X growth would mean a trading price of $7.823 per DOGE.

For context, those holding 15,000 DOGE tokens worth $3,798 today would see their investments expand to $117,352. While this prospect is enticing, the question remains whether Dogecoin could realistically reach a $1 trillion market cap and how long that could take.

Timeline for DOGE to Reach Tesla’s Market Cap

According to trader Alan in the crypto community, Dogecoin may reach $8 by the next market cycle in 2028. Market commentators at the Telegaon prediction platform agree with this timeline.

Specifically, they suggested a minimum price of $5.72 for Dogecoin by 2028, an average of $7.89, and a maximum of $9.12 by then.

With a supply of 148.12 billion tokens, a price of $9.12 would imply a market cap of $1.35 trillion, which exceeds Tesla’s current valuation. 

However, by the 2028 timeline, it is plausible that Tesla’s market cap may have expanded further.

Meanwhile, the crypto exchange Changelly analysis suggests that Dogecoin could still be trading below $1 by 2028.

Bitcoin Nears Channel Breakout: Can BTC Hit $100K Soon?

Bitcoin has made a V-shaped recovery and is now testing the $97,000 mark. Will BTC break the $100,000 resistance soon?

With the Crypto Fear and Greed Index recovering to 40, the overall crypto market shows a slight improvement. The total crypto market cap has risen to $3.15 trillion, and Bitcoin is back above the $97,000 level.

After a quick V-shaped recovery, Bitcoin is gearing up for a potential breakout rally. Will this rally push Bitcoin to the $100,000 mark? Let’s find out.

Bitcoin Price Analysis Hints Channel Breakout Rally

The BTC price trend shows a quick V-shaped reversal from the local support trendline after breaching the 23.60% Fibonacci level priced at $94,633.

Bitcoin Price Chart
Bitcoin Price Chart

With this bounce, Bitcoin is now challenging the 38.20% Fibonacci level near the $97,000 mark. Currently, Bitcoin is trading at $97,101, marking an intraday recovery of 0.46%, following a 1.01% rise yesterday.

With a new positive cycle forming within the channel, the uptrend is aiming to challenge the overhead resistance trendline. A potential breakout could lead Bitcoin to test the supply zone near the 50% Fibonacci level at $98,949.

ETF Outflows Raise Concerns Over BTC Price Rally

Despite the significant recovery in the broader market, institutional support for Bitcoin has yet to resurface. U.S. Bitcoin spot ETFs saw daily outflows of $71.07 million.

With four ETFs offloading their holdings in the market, the remaining ETFs saw net-zero outflows. Fidelity was the biggest seller on February 19, with $48.39 million in outflows. Valkyrie, ARK, 21Shares, and VanEck followed suit, offloading $9.27 million, $8.65 million, and $4.77 million, respectively.

This marks the second consecutive day of net outflows in U.S. Bitcoin spot ETFs. Since February 6, the Bitcoin ETFs have seen positive inflows only twice.

Can Bitcoin Break Above $100K?

Technical indicators provide some optimism for a potential bull run. The MACD and signal lines have crossed positively, with a surge in bullish histograms indicating a buying opportunity according to the momentum indicator.

Additionally, the recovery has caused the upper Bollinger Band to rise, signaling a possible shift in trend momentum. These technical factors support the likelihood of a breakout rally.

According to the Fibonacci levels on the 4-hour price chart, the breakout rally could target the 61.8% Fibonacci level at $100,878. On the downside, the crucial support level remains at $94,633.

Bitcoin to $181,294? Here’s Why a Looming RSI Breakout Suggests So

0

Bitcoin may be up for a bullish surge past its current all-time high to a new peak price if it breaks from its weekly RSI resistance.

The pioneering cryptocurrency has rebounded considerably in the past 24 hours, reclaiming $97,000 for the first time in three days. The much-needed bounce follows growing speculations that China will lift its years-long ban on Bitcoin and cryptocurrency.

Yifan He, the CEO of Chinese firm Red Date Technology, told CNBC yesterday that the chances that China will unban digital assets have exceeded 50%. Notably, pressure from Hong Kong’s flourishing crypto market fuels the rumored reassessment.

Meanwhile, amid the growing market momentum, an analyst has highlighted a catalyst for further upside. In a Feb. 19 post, notable market watcher Kevin Svenson predicted a Bitcoin price surge, citing historical reactions to a relative strength index (RSI) breakout.

Bitcoin Retesting Weekly RSI Resistance

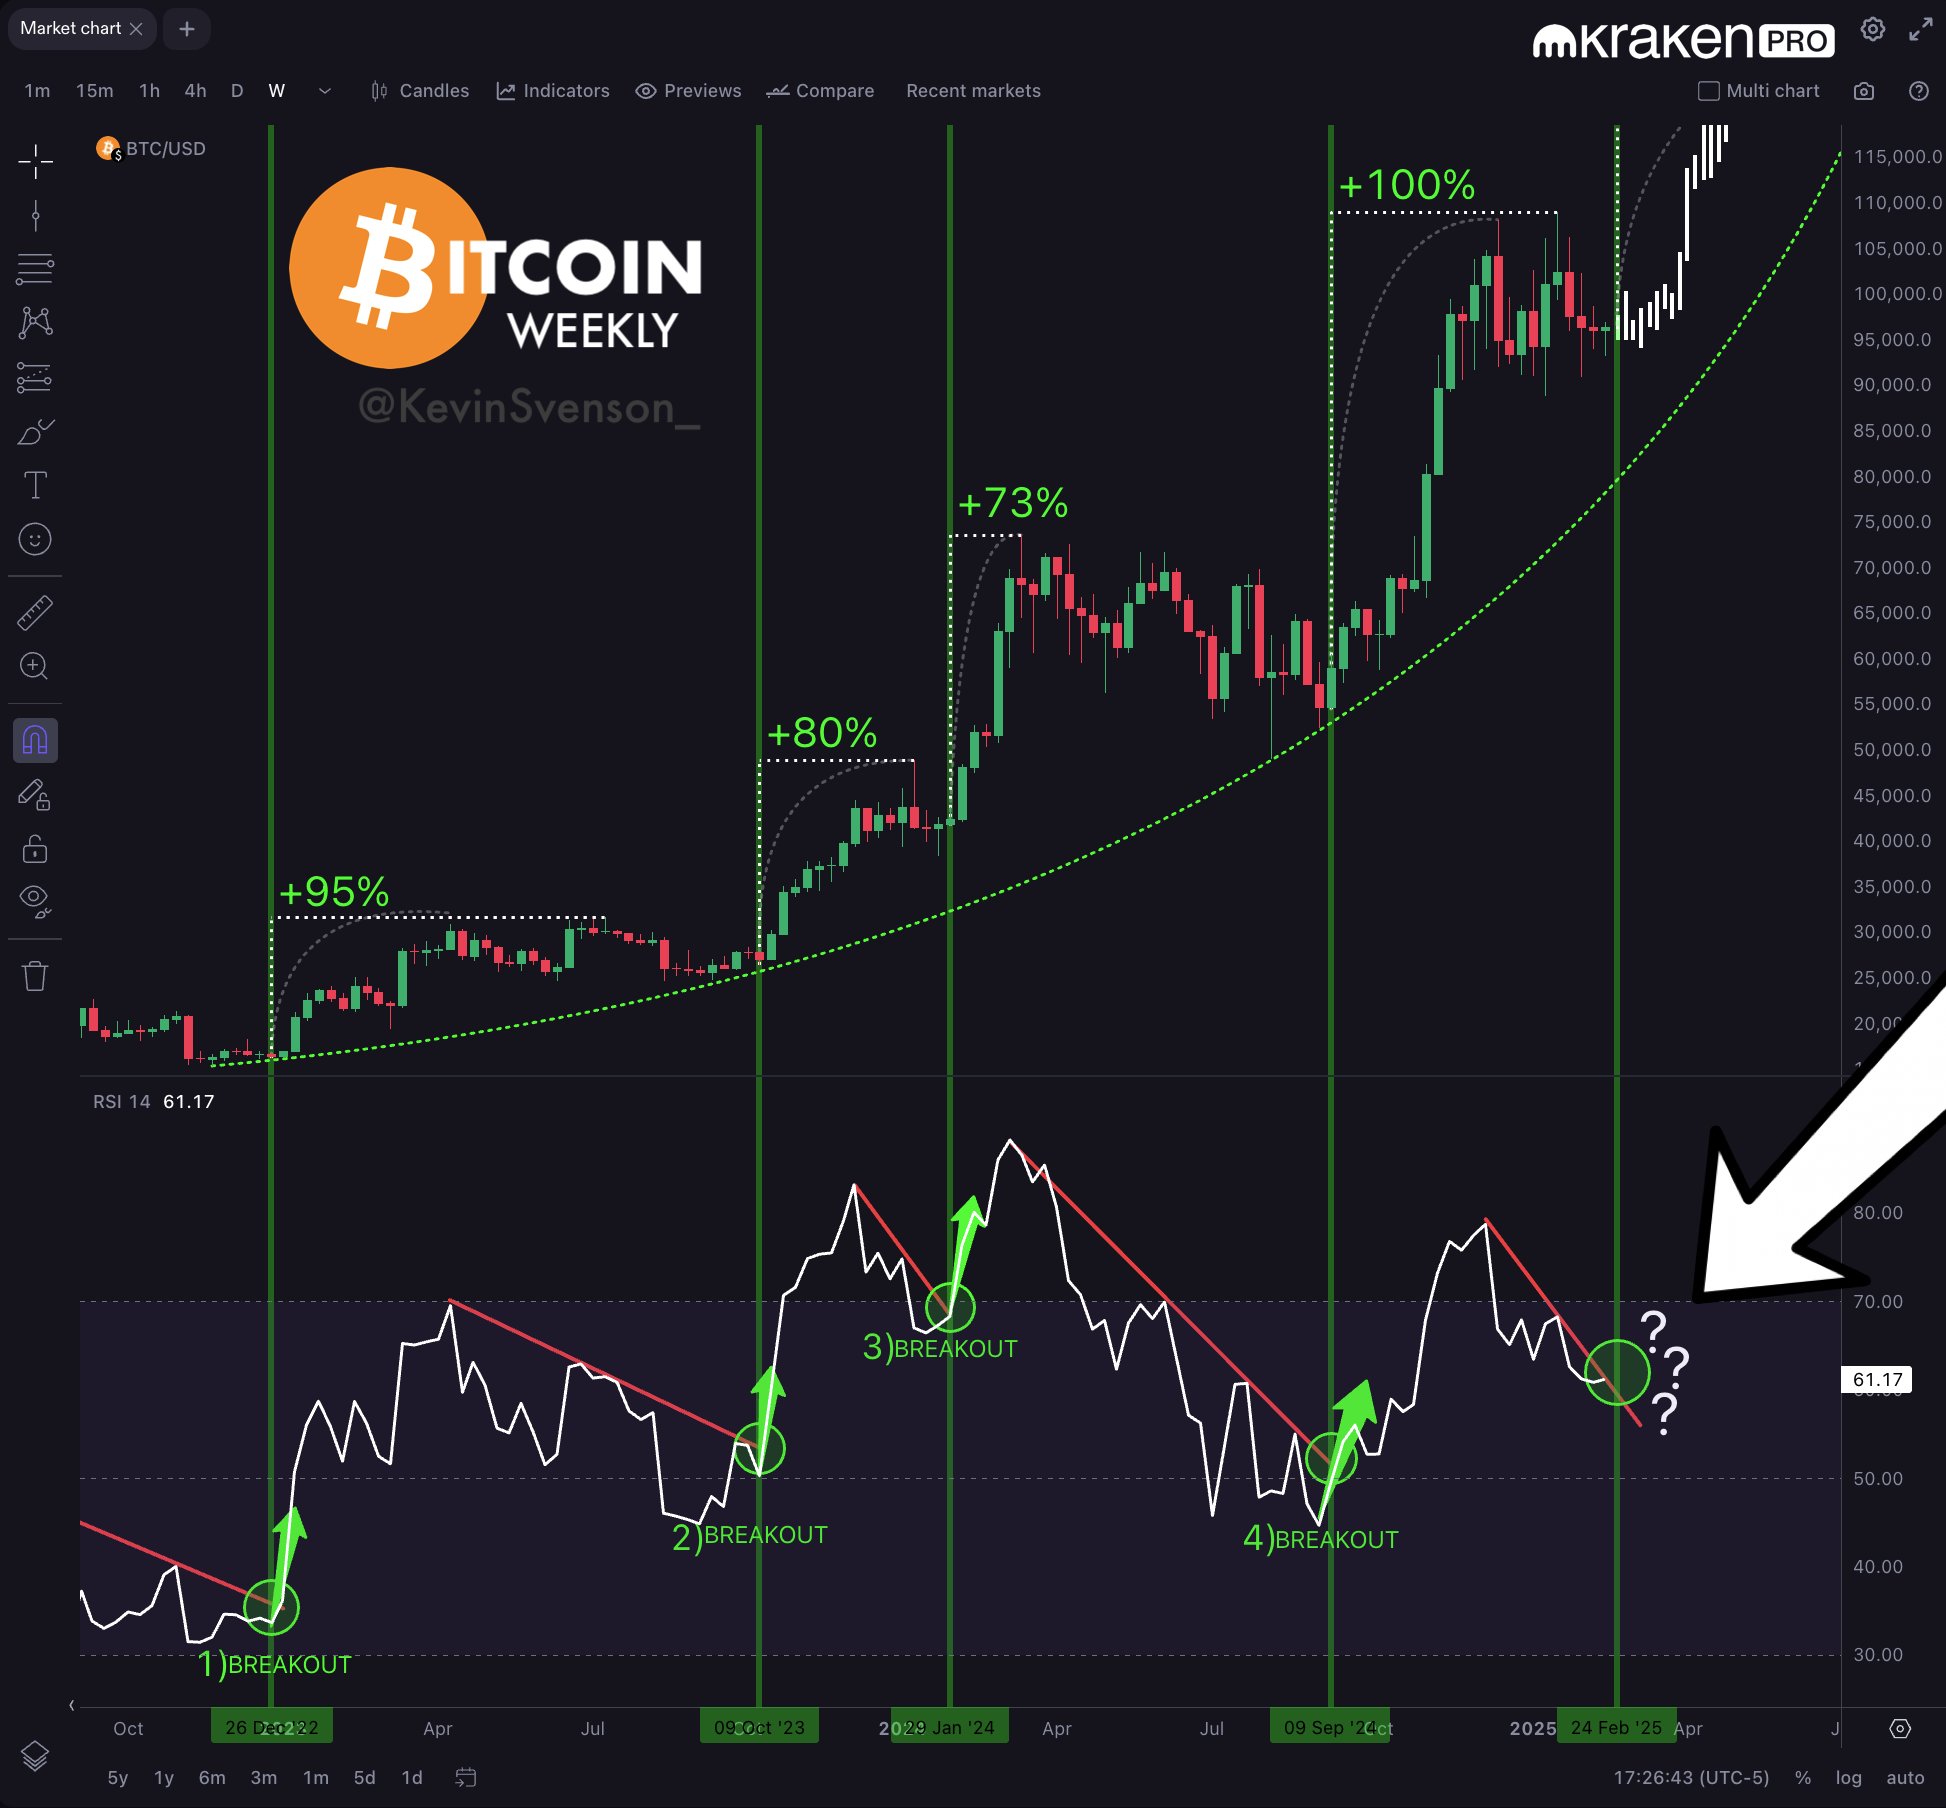
Svenson highlighted an emerging trend following Bitcoin’s recent rebound. His Wednesday commentary highlights that Bitcoin’s RSI is retesting its weekly resistance. For perspective, an RSI indicator measures the magnitude of an asset’s price swing, showing overbought and oversold regions.

The analyst stressed the importance of this trend, stating that a successful breakout from the resistance reinstates Bitcoin’s long-term bullishness. He highlighted that Bitcoin’s RSI is retesting the supply trendline, and a successful breakout would push the premier asset to unprecedented highs.

The accompanying chart further explains the premise of this bullish suggestion. Bitcoin’s price has historically surged extensively when its RSI breaks on the weekly timeframe.

Bitcoin Price Action After RSI Breakout/ Svenson

For context, Bitcoin rallied 95% after a December 2022 RSI breakout on the higher timeframe, posting another 80% uptrend with a similar trend in October 2023. Furthermore, the crypto firstborn again reacted bullishly to the resistance breach in January and September last year, surging 73% and 100%, respectively.

Meanwhile, the average upsurge with the last four RSI breakouts accounts for 87% of Bitcoin’s price. Suppose the resistance level breaks and the asset posts its average price rally, Bitcoin would surpass its current all-time high to $181,294.

Price Analysis

Analysis shows that Bitcoin’s RSI is at 61.70, signaling bullish momentum and room for more upside, as it still trends below the overbought territory. Nonetheless, the indicator is not the sole precursor for a Bitcoin price upsurge.

On-chain analysis shows a growing bullish sentiment among market participants, especially on exchanges. Data shows that the bid-ask volume imbalance has flipped bullish at 0.86% as trading activities increasingly tend towards a Bitcoin surge rather than pushing to lower prices.

BItcoin Analysis
BItcoin Analysis

However, trading volumes have reduced in the past 24 hours, down 23% to $28.83 billion. Other indicators, such as large transaction volumes and concentration, remain neutral, sending mixed signals.

In the meantime, Bitcoin trades at $97,180, up 1.27% in the past 24 hours.

How Lightning Strengthens Bitcoin Investment Thesis According to Fidelity

0

Fidelity tips the Lightning Network to extend the Bitcoin investment thesis beyond simply being a store of value.

In recent years, the prevailing investment thesis for Bitcoin has been its potential to become a store of value like gold, thanks to its limited supply. However, according to trillion-dollar asset manager Fidelity, the investment thesis for the asset has the potential to go beyond just being a store of value with the Lightning Network.

The Lightning Network is a peer-to-peer network that runs atop the Bitcoin chain. It allows users to conduct transactions off-chain using self-created payment channels. Through this model, users can typically escape the long wait time and high fees associated with the Layer-1 chain.

In a report released on Wednesday, February 19, Fidelity asserted that adoption of the Lightning Network could enhance Bitcoin’s long-term value proposition and investment potential, and solidify its place in the global financial system with use cases like automated payments, instantaneous interbank settlement and even real-world asset tokenization.

However, the Lightning Network is not a new technology. It has been around since 2018. Despite its promise, issues with creating payment channels and transaction failures have long posed hurdles to adoption.

But Fidelity argues that these issues are set to become things of the past.

“Lightning is steadily improving in efficiency and growth while also expanding its use cases beyond simple one-to-one payments. Its network capacity and transaction volume have continued to increase as Lightning continues to scale,” the asset manager wrote.

Indeed, Fidelity notes that the Lightning Network is moving from having numerous small, less efficient channels to having fewer better-capitalized channels, improving the odds of transaction success. Specifically, the asset manager noted that the average channel per node has dropped 30%, while the average capacity per node has grown 118%.

Lightning Network capital efficiency growth
Lightning Network capital efficiency growth. Source: Fidelity

At the same time, the known total capacity of the Lightning Network, excluding private channels, has grown 384% since 2020 to stand at about 5,358.50 BTC as of January 2025, worth nearly $520 million at the time of writing.

Total Lightning Network Capacity
Total Lightning Network Capacity. Source: Fidelity

Meanwhile, users now appear to be gravitating toward node service providers to enjoy better channel management for more efficient costs and reliable experiences.

Amid all these, Fidelity suggests that the Lightning Network may already be on a path to increased adoption. 

“More businesses integrated the Lightning Network in 2024 than years past-a trend we expect to continue throughout 2025,” the asset manager wrote, citing integration from firms like Coinbase.

Platforms like Nostr and Podcast 2.0 are also leveraging the network for payments. The asset manager expects institutions to jump in as the network’s efficiency improves due to the appeal of leveraging the security of the Bitcoin network.

Trump’s World Liberty Buys 547,990 SEI as Price Soars 11%

0

Donald Trump’s family crypto project, World Liberty Financial, splashes $125,000 to acquire 547,990 Sei (SEI) tokens. 

Data from the blockchain analytics platform Arkham Intelligence shows that the transaction occurred yesterday at 23:24 (UTC). A multi-sig wallet associated with the World Liberty project purchased the 547,990 SEI tokens through the decentralized trading platform CoW Protocol. 

Notably, the 547,990 SEI tokens were acquired at an average price of $0.228, bringing the aggregate price to around $125,000 USDC. 

SEI Price Spikes 11% Amid Trump Family Interest  

As expected, the transaction led to a major spike in SEI, with the token rising 11% from the initial purchase price to a daily peak of $0.2502. 

The price has retraced slightly to $0.2483 in the hours leading up to press time. Nonetheless, SEI is still up significantly over the past 24 hours and 6.73% in the past seven days. 

It ranks as the 71st biggest cryptocurrency on CoinMarketCap, with its valuation currently at $1.16 billion. 

SEI price chart CoinMarketCap

World Liberty Withdraws $10M USDC From Coinbase to Buy WLFI 

Meanwhile, World’s Liberty’s acquisition of SEI comes hours after the project withdrew $10 million from Coinbase. Following the withdrawal, the project splashed the entire $10 million on its native token, WLFI. The transaction saw World Liberty acquire 200 million WLFI tokens. 

Leading blockchain analytics platform Onchain Lens called the public’s attention to the transaction. 

WLFI Crypto Acquisition 

World Liberty’s latest purchase of SEI and WLFI is part of the project’s crypto acquisition spree. As previously reported, World Liberty invested over $240 million in multiple crypto assets within 12 days, spanning January 19 – 31, 2025. 

This includes a $112.8 million investment in Wrapped Bitcoin (wBTC), Ethereum (ETH), and Tron (TRX), among others, on January 20. At the time, Trump’s eldest son, Donald Trump Jr., disclosed that the investment was part of efforts to celebrate his inauguration as the 47th President of the United States.

Currently, a blockchain wallet linked to World Liberty holds $57.12 million worth of crypto assets. This reflects a slight 0.3% drop over the past day.

Shiba Inu Has Added 840K Addresses Over the Past Year

0

The Shiba Inu ecosystem continues to grow, having added about 840,000 addresses over the past year alone. 

Notably, the recent growth feat comes amid a year of mixed performance from the meme coin, with 2024 bringing it closer to its all-time high than previous years. For context, SHIB managed to reach a peak of $0.000045 in March 2024, with just a 96.5% extra increase to reclaim the 2021 all-time high of $0.00008845. 

Shiba Inu eventually lost this position, and despite the market-wide uptrend in Q4 2024, the asset failed to recover the yearly peak. Now, SHIB has dropped below the $0.00002 psychological territory, now battling the bears at the $0.000015 region.

Shiba Inu Added 840K Over the Past Year

Despite the price struggles throughout 2024 following the drop from $0.000045, on-chain data shows that Shiba Inu continued to witness address growth. According to data from IntoTheBlock, Shiba Inu had a total of 3.8 million addresses on Feb. 19, 2024, after welcoming 600,000 addresses from 2023.

Shiba Inu Addresses Feb 2024
Shiba Inu Addresses Feb 2024 | IntoTheBlock

Interestingly, the latest data indicates that the meme coin now boasts a whopping 4.64 million addresses as of Feb. 19, 2025. This indicates an addition of about 840,000 addresses over the past year. Notably, this increase surpasses what the network observed from 2023 to 2024 by up to 200,000.

Shiba Inu Addresses Feb 2025
Shiba Inu Addresses Feb 2025 | IntoTheBlock

Nonetheless, it is important to note that most of this uptick in total addresses came from an increase in addresses holding zero balance. For context, this tier of addresses surged from 2.5 million to 3.26 million over the past year. Meanwhile, those with balances increased from 1.29 million to 1.39 million within the same timeframe.

SHIB Addresses with Balance Rise by 100K

This indicates that accounts with balances only rose by 100,000. Despite the less substantial increase compared to those without balances, this 100,000-address increase within a year still represents an impressive feat for the Shiba Inu ecosystem.

Meanwhile, further data indicates that all tiers of Shiba Inu holders based on time held have witnessed a rise over the past year.

Particularly, Hodlers, those holding for over a year, increased from 1.03 million to 1.06 million. In addition, Cruisers, those holding for 1 and 12 months, rose from 280,100 to 327,770. Traders, representing those that have held for less than a month, increased from 25,720 to 44,280. 

Shiba Inu Addresses by Time Held ITB
Shiba Inu Addresses by Time Held | IntoTheBlock

This confirms that Shiba Inu’s address growth metrics have been particularly uniform, indicating widespread confidence. This confidence prevails despite the drop from $0.000045 in March 2024, as the meme coin craze at the time died down. Currently, Shiba Inu changes hands at $0.00001542, trading flat today.

Canary Capital Launches Trust for Ripple Cross-Chain Partner Axelar

0

Institutional traction to Axelar, the Ripple cross-chain partner, has escalated following the launch of the Canary AXL Trust.

Asset manager Canary Capital announced the launch of the Canary AXL Trust, an institution-grade fund tracking the performance of the Axelar native token AXL. The investment product will bridge the gap between traditional finance and digital innovation, simplifying exposure to the crypto asset.

Notably, the Axelar Trust is the first Canary investment product offering indirect exposure to the asset based on the blockchain interoperability category. This signals Axelar’s growing traction and the sector’s emergence into the limelight.

Meanwhile, Canary tapped Coinbase as the custodian for the Axelar Trust. The leading US-based exchange would safely store investors’ funds and facilitate transactional settlements for the trust.

Axelar’s Growing Adoption Attracts Institutions

The Wednesday launch follows the growing adoption of the Axelar interoperability solution. The cross-chain bridge provider offers interaction with over 80 unique chains in the cryptocurrency space.

Axelar’s technology gained mass adoption in the crypto space last year. Following strategic partnerships with high caliber blockchains, the solution fosters web3 connectivity between ecosystems like the XRP Ledger (XRPL), Sui, Stellar, TON, Bitcoin, and Hedera.

Meanwhile, the surging traction saw Axelar hit a total value locked (TVL) of $1 billion earlier this year. The blockchain also attracted institutional partnerships, including Deutsche Bank, Microsoft, and JP Morgan.

Ripple’s Partnership with Axelar for XRPL Interoperability

One of Axelar’s remarkable feats was its partnership with Ripple to provide interoperability services for the XRPL Ledger. Last year, the blockchain solution forged a collaboration with the payment giant to act as a bridge between the XRPL and the XRPL Ethereum Virtual Machine (EVM) sidechain.

Ripple is building the XRPL EVM sidechain in collaboration with Peersyst, leveraging the evmOS to ensure compatibility with other chains and complete customizability on the Cosmos SDK. Notably, introducing the sidechain will enhance XRPL’s opportunities in DeFi.

Meanwhile, Axelar is reportedly working with Ripple on the RLUSD interoperability with other chains. The launch of the stablecoin expanded the utility of the XRP Ledger, and the partnership aims to allow the stablecoin to function seamlessly in different chains.