Home Blog Page 946

Dogecoin Price to $3.69? This Chart Pattern Suggests So

0

A prominent trader has suggested that doggy-themed crypto Dogecoin could be set to quadruple its all-time high.

In an X post on Sunday, February 9, highly followed crypto trader “Trader Tardigrade” suggested that Dogecoin could be gearing up for a rally to the $3.69 price point.

While it is a modest target compared to recent $20 calls, it is still 4 times DOGE’s all-time high of about $0.74 and nearly 14 times its current price of about $0.25.

The analyst based their projections on an ascending channel pattern formed by the memecoin’s price action since 2014 on the monthly candle chart. Per the chart, the asset appears to be on its way to revisiting the top of this channel, which Trader Tardigrade anticipates will align with the $3.69 level.

Ascending channel on DOGEUSD monthly candle chart
Ascending channel on DOGEUSD monthly candle chart. Source: Trader Tardigrade

Unsurprisingly, amid current market uncertainty, not many community members appear to be as optimistic as Trader Tardigrade, with some asserting they will be content with just revisiting previous all-time highs at $0.74.

Despite this pessimism, DOGE is not without catalysts.

Elon Musk and ETFs

For one, the memecoin may be set to get increased visibility thanks to its long-running support from the world’s richest man and Tesla CEO, Elon Musk.

Recently, the billionaire has been appointed as head of the Department of Government Efficiency, a non-governmental agency tasked with informing government spending cuts, which he has cheekily named D.O.G.E. Clearing any doubts as to the link between this name and the memecoin, the D.O.G.E. website launched sporting the logo of the crypto.

Beyond Musk’s antics, DOGE may soon see fresh demand from institutions as several fund managers have thrown their hats in the ring to launch exchange-traded funds based on the asset. These asset managers include REX Advisers and Osprey Funds, Bitwise, and Grayscale.

Analysts have suggested that the proposed fund from REX Advisers and Osprey Funds could go live as soon as April 2025, barring a rejection from the Securities and Exchange Commission.


Japan Set to Lift Ban on Bitcoin and Crypto ETFs

0

Amid a broader global embrace of Bitcoin, the Japanese market regulator is looking to lift a ban on ETFs tracking crypto assets.

According to a report from local outlet Nikkei, the Japanese Financial Services Agency has moved to withdraw the existing regulatory hurdles for specific investment products on digital assets. The financial watchdog also plans to treat cryptocurrencies similarly to other financial vehicles, such as securities.

The FSA Changes Stance on Bitcoin

After earlier skepticism, Japan’s FSA seems to be warming up to cryptocurrencies. The mulled proposal would see the agency implement regulations on the virtual asset sector similar to those in other traditional markets. 

Some of the teased implementations include tax reduction and prompting virtual asset firms to provide additional information to protect market investors. According to the Nikkei report, the FSA plans to cut the current tax rate of up to 55% to as low as 20%.

Furthermore, the top regulatory body will revoke a ban on crypto exchange-traded funds (ETFs). The investment vehicle already existing in the United States and Hong Kong will promote the adoption of Bitcoin among traditional institutions in Japan.

Meanwhile, the Japanese regulators have taken considerable steps to foster this new adoption curve. Currently, the FSA is conducting a closed-door study session with market experts to examine if the existing regulatory guidelines in Japan are sufficient.

Accordingly, the regulator will announce the direction of a system reform policy in the next four months. The agency will also promote the legal amendment at the ordinary session of the Diet in the National People’s Congress in 2026.

Stringent Regulatory Compliance Despite Easing Stance

Despite Japan’s easing stance on digital, the FSA remains cautious of the risks involved in exposure to the sector. As a result, the top Japanese regulatory body is keen to ensure compliance among virtual asset providers.

A few months after warning exchanges like Bybit, KuCoin, Bitget, and other exchanges of unlicensed operations, the FSA has clamped down on the platforms. Last week, the regulatory watchdog asked Google and Apple to delist these unregistered exchanges from their application store.

Although the Japanese government stated earlier that it would not follow America’s lead in considering a national Bitcoin stockpile, the Asian country may change its disposition as the tides continue to turn.

Bitcoin Whales Move 14,000 BTC Worth $1.3B After 7-10 Years of Inactivity

0

A large amount of long-dormant Bitcoin has just moved for the first time in years, triggering speculation about a potential market impact.

CryptoQuant analyst Dan disclosed this in a commentary today, citing the Bitcoin Spent Output Age Bands metric. Data confirms that the whales transferred around 14,000 BTC, worth over $1.3 billion, after remaining inactive for 7 to 10 years.  

This kind of movement often triggers reactions from market participants. However, Dan stressed that the fact that whales did not immediately deposit the coins on exchanges suggests they do not mean to immediately sell them off. 

He pointed out that historically, when large amounts of old Bitcoin move, the event does not always result in a price drop. However, since these coins were acquired at a much lower price, the holders may be considering their options by either selling at a massive profit or repositioning their holdings.  

One possibility is that these coins belong to early adopters or long-term investors who are now making strategic adjustments. Another scenario is that they are part of internal wallet reorganizations by an institution or large entity, especially as they have yet to move to exchanges.

Bitcoin Sees Largest Exchange Outflows Since 2022  

At the same time, Bitcoin has seen one of its largest exchange outflows in recent years. Analyst Papi revealed on CryptoQuant that over the last week, more BTC left exchanges than at any point since 2022. This resulted in a 3% drop in Bitcoin’s available supply on trading platforms.  

Bitcoin Exchange Netflow CryptoQuant
Bitcoin Exchange Netflow | CryptoQuant

The last time such large withdrawals occurred was shortly after the FTX implosion. Typically, when Bitcoin exits exchanges in large amounts, it signals accumulation rather than selling. 

Some analysts suggest that big investors, including institutions, are taking advantage of price dips to increase their holdings. Caueconomy, another analyst, highlighted this trend, noting that more than 47,000 BTC had left exchanges, but this could reflect internal movements by trading platforms.

He suggested that the massive exchange outflows could also suggest that major whales are pulling Bitcoin into long-term storage. However, Caueconomy stressed that the market would only feel the possible “supply shock” would in the long term.

MicroStrategy Continues Its Bitcoin Buying Spree  

Adding to the institutional accumulation trend, MicroStrategy has again expanded its Bitcoin holdings. The company recently acquired 7,633 BTC for $742.4 million, bringing its total holdings to 478,740 BTC. Over time, MicroStrategy has spent $31.1 billion on its Bitcoin strategy.

This development shows that despite market uncertainty, institutional demand for Bitcoin remains strong. The firm’s recent purchase follows a halt on its weekly Bitcoin buys last week.

Bitcoin Holds Above $97K Amid Market Uncertainty

Despite these major movements, Bitcoin’s price has remained relatively stable. Currently, BTC is trading at $97,470 after gaining 1% on the day. However, broader market uncertainty, including potential economic impacts from proposed U.S. tariffs on steel and aluminum, continues to influence sentiment.  

Notably, analysts have identified key levels to watch. Rekt Capital highlighted that Bitcoin’s series of higher lows is still intact. He stressed that for Bitcoin to maintain its bullish structure, it must stay above $96,500 and reclaim $97,900.  

Meanwhile, Carl Moon pointed out a falling wedge pattern forming on the 4-hour chart. If Bitcoin breaks out of this pattern, the next target could be $106,500. For context, this structure has been developing since Bitcoin’s drop from its recent high of $106,000.  

Bitcoin Falling Wedge Carl Moon
Bitcoin Falling Wedge | Carl Moon

Shiba Inu Faces Potential 30% Capitulation: Here’s the Target

0

Analysis indicates a potential Shiba Inu rebound to new highs may delay amid a possible 30% capitulation to a crucial monthly support.

Market watcher MadWhale has asserted in a TradingView analysis that Shiba Inu’s bearish momentum remains. The pseudonymous analyst stated that while the doggy-themed meme coin has seen some upsides after a steep drop on February 3, it still trades within a descending channel.

For context, Shiba Inu recently rebounded strongly from a multi-month low of $0.00001160 a week ago amid a macroeconomic headwind. The second-largest meme coin by market cap rebounded 37% from the price level to close at $0.00001680 and has trended around the region.

Another 30% Downside?

MadWhale, who lauded the accuracy of his previous predictions, stated that Shiba Inu is still in a bearish phase. As a result, he speculated that the token might see lower prices, specifically towards its higher timeframe support area.

The analyst suggested the prominent meme coin will correct at least 30% from its current valuation to the support at $0.00001123. Meanwhile, he stated that the downtrend may extend beyond the support to lower prices depending on the broader market condition.

Nonetheless, MadWhale speculated two likely scenarios for the downtrend. An accompanying chart shows that Shiba Inu could either resume the uptrend from the current market position or trend to higher prices before the correction.

Shiba Inus Potential 30 Drop

In the case where Shiba Inu temporarily appreciates, his chart shows it could surge to the tip of the ascending channel before another round of capitulation. Notably, the channel’s tip lies around $0.00001930, marking a 20% upsurge from the current market price.

Analysts’ View on Shiba Inu’s Next Course After Downtrend

Meanwhile, despite the current bearish phase, analysts’ long-term view on Shiba Inu remains bullish. This confidence stems from the asset’s historical ability to rebound from market downsides and bullish momentum around its ecosystem.

For instance, top Bitcoin analyst Crypto ELITES recently shared that Shiba Inu’s technical outlook remains bullish. Citing a classical cup-and-handle pattern, he predicted a 2,860% breakout to $0.0004729.

Another analysis suggests that Shiba Inu would target a substantial uptick to $0.00004170 after completing the downside. Meanwhile, a separate analysis predicted more upside, with an upward trajectory of over 543% to $0.0001397 in view.

In the meantime, SHIB trades at $0.00001604, up 2% in the past 24 hours.

Litecoin Bounces Back from $100: Will It Reach $150?

Litecoin jumps to $116 after strong support at $100. Will the recovery rally in LTC price continue to hit $150?

With top cryptocurrencies like Bitcoin and Ethereum standing on the verge of a potential recovery, Litecoin is taking a decisive bullish step. As Litecoin holders reveal strong support near the $100 psychological mark, the uptrend in LTC price has registered a massive spike in momentum.

With an intraday rise of 8.34%, Litecoin is forming a U-shaped reversal. Will this reversal rally in Litecoin reach the $150 psychological mark? Let’s find out.

Litecoin Analysis Supports Bullish Reversal at Play

In the daily chart, the LTC price trend creates four consecutive bullish candles. The bullish streak comes after strong support formed near the $100 psychological mark.

Litecoin Price Chart

This marks a quick reversal rally in Litecoin, driving the market price to $116.40. The recovery rally in Litecoin has regained nearly half of the lost value during the recent market dip. During the market crash, LTC price dropped from $130 to the $100 psychological mark.

Now, the MACD indicator is on the verge of giving a positive crossover. Furthermore, the bounce-off in Litecoin from the lower Bollinger band has crossed the 20-day SMA line, hinting at a potential rise to the upper Bollinger band at $129.

Analyst Insights: LTC Breaks Out of Ascending Triangle

Adding to the bullish support for Litecoin, crypto analyst Carl Moon has pointed out that LTC has broken out of an ascending triangle pattern. The projected target for this breakout rally is expected to reach $128.

Now at $116, Litecoin’s bull run will likely hit the projected price target.

Litecoin Breakout
Litecoin Breakout

On-Chain Data Hints Upside Potential To $177

According to IntoTheBlock data, Litecoin’s uptrend has reached the “at-money” zone between $109.69 and $126. As the uptrend targets the $130 mark, the next immediate supply zone extends from $126 to $177.

GIOM Indicator
GIOM Indicator

This supply zone holds 5.7 million LTC, indicating significant resistance. However, the “at-money” zone and the immediate support zone from $97 to $126 account for 18.47 million LTC.

With a large amount of Litecoin approaching profitability, the uptrend will likely gain momentum. Based on the options indicator, Litecoin’s immediate price target remains $126, followed by an optimistic target of $177.

On the downside, crucial support is located at $109, with additional support near $97, close to the $100 threshold.

Ethereum Holds $2,600: Can Bulls Push ETH to $4,000?

With Ethereum recent decline finding bullish support at $2,600, is a reversal rally toward $3,000 in ETH prices possible this week?

As bulls are preparing to lift off Bitcoin price from its critical support level of $95,000, Ethereum is holding its ground at $2,600. With multiple lower price rejection candles over the weekend, the breakdown rally in Ethereum is finding minor bullish support.

While the lower price rejection hints at a potential comeback for Ethereum, strong overhead bearish signals indicate significant resistance. Amid these dynamics, could an altcoin season push Ethereum’s price back to the $4,000 mark? Let’s explore.

Ethereum Price Analysis: Can Bulls Reclaim Momentum?

On the daily chart, Ethereum’s price continues to decline after its breakout rally. This drop accounts for a 21% decrease in Ethereum’s market value over the past 10 days, reducing its price from $3,331 to $2,635.

Ethereum Price Chart

Despite this sharp decline, bullish support is helping Ethereum hold above the $2,600 mark. With lower price rejections in its daily candles, Ethereum’s price trend hints at a possible comeback.

Supporting the possibility of a bullish rally, the MACD and signal lines are narrowing the bearish gap. This hints at a potential crossover as the intensity of bearish histograms declines.

Thus, the momentum indicator points to a possible bullish reversal for Ethereum. However, the up-and-down volume shows a constant struggle between bulls and bears.

Ethereum ETF Inflows and Institutional Demand

Amid price declines, Ethereum ETFs registered inflows of $420.2 million between February 3 and February 7. On February 7, U.S. spot Ethereum ETFs recorded a net-zero inflow.

However, daily inflows have been strong, with six consecutive days of positive inflows into Ethereum ETFs. Despite Ethereum’s declining market price, the rising institutional support indicates a likely upward bounce in ETH prices.

This assumption is based on the expectation that the market price will align with the rising demand.

Ethereum Whale Holdings: A Major Sell-Off?

Alongside institutional support, the balance of Ethereum held by large investors has shifted significantly. According to IntoTheBlock, since February, the balance of Ethereum held has dropped from $455.79 billion to $371.91 billion.

Ethereum Balance by Holding

Among these changes, Ethereum holdings of over $10 million dropped from $366.43 billion to $296.26 billion—a 19.14% decrease in just nine days.

Additionally, investors holding between $1 million and $10 million worth of Ethereum have reduced their holdings from $34.27 billion to $28.21 billion. This shift in top investor holdings adds to the bearish pressure on Ethereum’s price.

Ethereum Price Targets 

With technical signals showing opposing trends, price action analysis remains straightforward. Given the lower price rejections in the last three intraday candles, a bounceback in Ethereum’s price is likely.

The immediate price target for Ethereum is $2,746, followed by $3,957. On the downside, crucial support remains near the $2,400 psychological level, with further support at $2,118 following the recent market pullback.

Ethereum Shorts Reach Historical High: Here’s Why This Could be Beneficial for Prices

0

Leveraged short position contracts for Ethereum have reached insane levels, sparking the possibility that the asset may rebound to release the saturation.

Since the start of the year, Ethereum has been one of the worst-performing high-caliber cryptocurrencies. For context, the second-largest crypto asset by market cap has corrected a staggering 20% year-to-date, compared to BNB’s 14% downside and XRP’s 18% uptick.

Ethereum failed to sustain the intense upward price action seen when it rebounded 35% in one day on Monday amid macroeconomic factors. The asset closed the week with an 8% correction, posting its second consecutive weekly negative trend.

Meanwhile, Ethereum’s general underperformance has drawn heightened bearish sentiment around the asset. Most recently, the altcoin king recorded a rare history barely seen in a bull market condition.

Ethereum Shorts Hits New Highs on CME

Based on the cyclical phase, the crypto market is still on a bull run. However, Ethereum shorts have surpassed the bear market highs on the Chicago Mercantile Exchange (CME).

Altcoin Daily shared today that bear calls for Ethereum have reached a new all-time high. An accompanying chart shows these peak shorts are on the CFTC CME Ether cash-settled leveraged contract.

The long-to-short coefficient on the Ethereum contract has reached an unprecedented level, with the chart showing a factor of -11,341. Notably, this bearish sentiment has grown intense since late 2024, before the latest new high.

Ethereum Shorts on CME

Interestingly, this trader disposition has come despite recent bullish calls. Most notably, Eric Trump, Donald Trump’s second son, nudged investors to start buying Ethereum at this point, insinuating it is a perfect entry.

Short Squeeze Incoming?

Meanwhile, the intense selling pressure on Ethereum has raised speculations of a short squeeze. Market observers believe that the second-largest cryptocurrency by market cap will pull a strong bounce in the direction opposite the predominant leveraged bets.

Assets have a history of putting in such a contrarian play, especially when they are heavily shorted. This pump is to release saturation and cut out overleveraged traders before its next directional trend.

In the meantime, Ethereum has shown signs of life with a strong start to the week. The asset rebounded 4% from an intraday low of $2,561 to trade at its current price of $2,658.

Moreover, Ethereum has held a significant support at $2,600, a level prominent analyst Ali Martinez identified as the bottom of its multi-year ascending triangle. He noted that the altcoin king could rebound to $3,000 or even $4,000 if it sustainably holds the crucial region.

Is Bitcoin Primed to Hit $107k This Week as Bulls Regain Strength Near the $95k Mark?

Bitcoin shows bullish momentum as it breaks key resistance, with price targets potentially reaching $107k this week.

Bitcoin is starting the week on a bullish note with an intraday rise of 0.70%. With the intraday rise, Bitcoin is making a bullish candle after creating four consecutive daily Doji candles.

With the recovery gaining momentum, a short-term breakout in the BTC price trend hints at a potential comeback this week. Will this recovery result in a Bitcoin price surge beyond $100,000? Let’s find out.

Bitcoin Bullish Reversal at $95k Breaks Key Resistance

In the 4-hour price chart, Bitcoin reveals a strong reversal from the $95,000 mark. The bullish comeback is strengthening as Bitcoin breaks past the local resistance trend line. Furthermore, the uptrend exceeds the 38.20% Fibonacci level.

Bitcoin Price Chart
Bitcoin Price Chart

Currently, Bitcoin is available at a market price of $97,399. With three consecutive bullish candles and significant lower price projections, Bitcoin is marking a double-bottom reversal. Furthermore, the trendline breakout marks a key bullish event for Bitcoin.

The recovery run in Bitcoin is gradually gaining strength as the TSI average lines are recovering within the negative territory. Furthermore, as the TSI lines approach the zero line in a positive alignment, the indicator supports the chances of a bullish trend.

Key Buying Opportunity

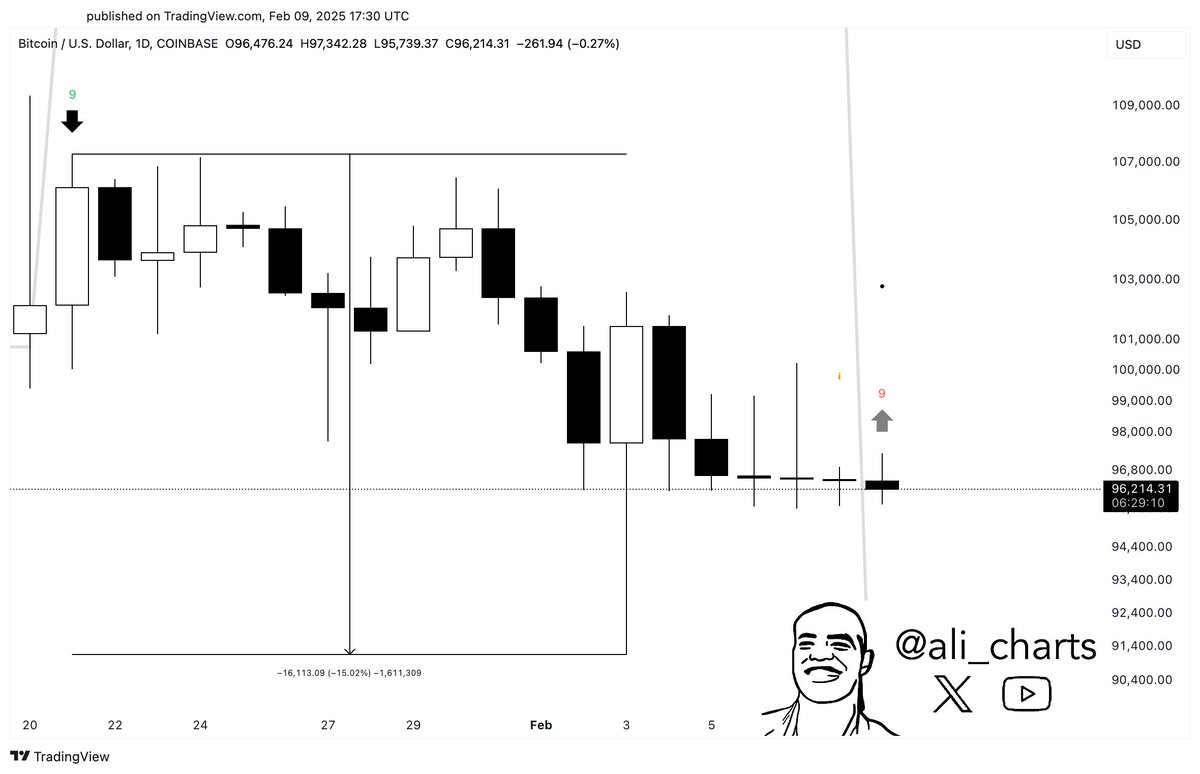
Supporting the chances of a bullish comeback, Ali Martinez has highlighted a buying opportunity in Bitcoin. In his recent X post, the analyst pointed out that the TD Sequential Indicator, perfectly timed on the Bitcoin daily chart, is now flashing a buy signal.

This hints at a potential bottom in BTC prices and increases the chances of a reversal rally.

Image

Derivatives Market: Bullish Speculations Rise

In the derivatives market, bullish speculations have increased significantly. Bitcoin’s open interest over the past 24 hours has risen by 0.77% to $59.11 billion.

BTC Open Interest
BTC Open Interest

More significantly, the funding rate has seen a notable increase. From a bottom of 0.003%, funding rates have now climbed to 0.0081%. This reflects the willingness of buyers to hold on to long positions in Bitcoin.

Additionally, Bitcoin’s long-to-short ratio has grown substantially over the past 24 hours. Currently, the Bitcoin long-to-short ratio stands at 0.9992, with long positions at 49.98% and short positions at 50.02%.

Despite the nearly equal distribution of long and short positions, the positive funding rates and increasing open interest indicate a generally bullish sentiment in the derivatives market.

BTC Price Targets Extend to $107K This Week

As the likelihood of a bullish recovery grows, Fibonacci levels indicate a key resistance at the 61.80% level, corresponding to $100,557, just above the psychological $100,000 mark. If the uptrend continues, Bitcoin could test the $107,000 supply zone this week.

On the other hand, support at the 23.6% Fibonacci level, around $94,595, is expected to hold Bitcoin’s price above this level in the event of a pullback.

Brazil B3 Stock Exchange to Expand Offerings with Bitcoin Options, Ethereum and Solana Future Contracts

0

Leading Brazilian stock exchange B3 plans to increase its offerings by introducing three new crypto-related products for Bitcoin, Ethereum, and Solana. 

Local news outlet Valor Investe reports that B3 plans to introduce Bitcoin options and futures contracts for two major crypto assets, Ethereum and Solana. Speaking to local media over the weekend, B3’s CFO Andre Milanez confirmed these derivative products could launch at the end of this year. 

If this happens, B3 will expand its crypto offerings beyond Bitcoin. Specifically, it will expose retail and institutional investors to Ethereum and Solana through future contracts tied to these tokens. 

Successful Launch of Bitcoin Futures on B3  

The upcoming listing follows the successful launch of Bitcoin futures contracts on B3 in April 2024. Since its debut, the futures contracts have gained widespread adoption, attracting an average volume of R$5 billion ($860 million) monthly. 

This massive surge reflects a growing interest in crypto-related products among Brazilian retail and institutional investors. Based on this, B3 plans to launch Bitcoin options as well as future contracts for Ethereum and Solana this year. 

B3’s Crypto-Related Listings 

B3 ranks as one of the major stock exchanges in Brazil. The trading platform, which was created following a 2017 merger between CETIP and BM&FBOVESPA, offers a variety of financial instruments, ranging from equities and bonds to crypto. 

Last year, the world’s largest asset manager, BlackRock, rolled out its spot-based Ethereum exchange-traded fund (ETF) on B3. The product, dubbed ETHA39, offers retail and institutional investors indirect exposure to Ethereum’s price movements. 

As reported earlier, shares of the ETF started trading between R$40 and R$50, with the issuer waiving the 0.25% management fee for the first year. This move came after BlackRock launched its spot Bitcoin ETF on B3 under IBIT39. 

In other news, Brazil’s financial regulator, Comissão de Valores Mobiliários (CVM), approved the launch of two Solana ETFs. 

Meanwhile, Brazilians have shown significant interest in crypto in recent times. This is reflected in the surge in trading volume on crypto exchanges. According to data from biscoint.io, crypto exchanges in Brazil, including Binance and Bybit, recorded a total volume of $1.13 billion in January 2025. 

Shiba Inu to $1, Analyst Provides a Realistic View on This Bold Target

0

A notable market analyst has presented a realistic view on Shiba Inu potential to claim the dollar mark.

Notably, Shiba Inu (SHIB) continues to consolidate around the $0.000016 price level as bearish sentiments dominate the market. The meme coin had collapsed to a yearly low of $0.00001160 on Feb. 3 amid a broader market correction but immediately recovered above $0.000016.

Despite the consolidation and the bearish pressure within the market and SHIB’s inability to reclaim the 2024 peak of $0.000045 in recent times, many investors remain hopeful that the token will claim $1 in the future. Top exchange CoinW fueled this optimism in a projection last month.

Shiba Inu to $1

However, a recent analysis from Trade City Pro challenges this expectation. The analyst outlined why such a price target is unrealistic, pointing to market cap assessments and overall market trends.  

One of the biggest reasons the analyst dismisses the $1 price prediction is Shiba Inu’s massive token supply, currently at 589 trillion. Market capitalization, which is a product of the circulating supply and the current price, is an important metric when determining an asset’s potential.  

If SHIB claims $1, its market cap will skyrocket to $589 trillion. To put this into perspective, the total market cap of gold is only $19 trillion and the entire crypto market cap now sits around $3 trillion. Given these numbers, the analyst asserts that such a valuation is impossible. 

A report from The Motley Fool also suggests a $1 price is impossible for SHIB. Nonetheless, it is important to note that most commentators and community figures who believe in the Shiba Inu to $1 prediction do not actually expect the meme coin to reach this valuation anytime soon. 

Shiba Inu Weekly Chart Analysis  

Meanwhile, Trade City Pro highlighted Shiba Inu’s current price action to present an outlook for its potential movements in the coming weeks. Looking at SHIB’s historical price movement, the analyst noted that the token spent 620 days inside a weekly range, with resistance at $0.00001171.

After breaking out, it climbed to $0.00003279 last year before facing rejection. The analyst suggested that SHIB later retraced to the $0.00001296 support and attempted to rise again in December 2024 amid a broader market uptrend, but resistance held strong.  

Shiba Inu Potential Weekly Double Top
Shiba Inu Potential Weekly Double Top | Trade City Pro

This price action created an equal high, which suggests a potential double-top pattern on the weekly chart. A double top is a bearish formation that indicates a trend reversal. However, the analyst pointed out that volumes are declining during the correction, indicating a positive sign.

He noted that the market will only confirm the double top structure if SHIB breaks below the $0.00001296 support. If this happens, the price could drop further, with a target of $0.0000067. SHIB recently collapsed to $0.00001160 on Feb. 3, but immediately recovered, now trading at $0.00001603.

The Analyst’s Trading Strategy  

Notably, when it comes to investing in SHIB, the analyst revealed that he would never buy the token, regardless of potential profits. Instead, he says he prefers low-market-cap altcoins when speculating.  

For those looking to sell, he advises that they exit the market if SHIB drops below $0.00001296, at least temporarily. If the market sentiment shifts and a bullish trend emerges, traders can consider re-entering.