In the latest instance, a leading crypto research firm has highlighted that the products feature in yet another key list showcasing the growth of the premier crypto asset.
Bitcoin in the Top 100
Ecoinometrics has highlighted yet another significant Bitcoin ETF feat.
In an X post on Thursday, February 6, the platform disclosed that three Bitcoin ETFs now rank among the top 100 ETFs by assets under management. The three ETFs include BlackRock’s IBIT, Fidelity’s FBTC, and Grayscale’s GBTC. Per the data, IBIT ranks 31st with about $56.5 billion, FBTC ranks 89th with $20.4 billion, and GBTC ranks 94th with $19.5 billion.
Commenting on the milestone, the firm asserted:
“Bitcoin is not a fringe asset anymore.”
Bitcoin ETFs in the top 100. Source: Ecoinometrics
Indeed, the asset has come a long way from its niche libertarian roots to becoming a $2 trillion asset that is highly in demand on Wall Street even as the U.S. government at various levels mulls holding a strategic reserve of it.
Further highlighting Bitcoin’s growth, Ecoinometrics noted that BlackRock’s IBIT was not far behind SPDR Gold Shares (GLD), the largest gold ETF. GLD ranks 18th with about $73 billion in AUM.
Interestingly, in mid-December, the cumulative AUM of all U.S. Bitcoin ETFs, including derivatives and leveraged products, surpassed the total AUM of U.S. gold ETFs.
The feat is significant as core Bitcoin proponents argue that the asset will one day surpass gold as a store of value.
Asset manager VanEck has predicted that Solana will surge 162% from the current market price by the end of 2025, citing its smart contract platform expansion.
The prominent Bitcoin and Ethereum exchange-traded funds (ETFs) issuer has recently reviewed its earlier Solana predictions upwards. In a January 6 post, VanEck added $20 to its earlier Solana outlook this year, predicting an over twofold surge to $520.
New Solana Target Hinges on SCP Expansion
VanEck tweeted that it collated its year-end Solana price outlook using the performance of the smart contract platform (SCP) market. The sector categorizes crypto networks with smart contract features, including high-caliber names like Ethereum, Cardano and BNB.
The asset manager predicted the SCP would grow considerably this year, citing surging traction. Using regression analysis, it noted that the sector’s market cap would increase 43% from its current valuation of $770 billion to $1.1 trillion by the end of 2025.
Meanwhile, VanEck noted that the SCP’s trounce of its 2021 peak valuation of $989 billion to $1.1 trillion would stem from its strong correlation with the US M2 money supply. The tweet highlighted that the M2 fiscal supply would maintain its 3.2% annualized growth rate to hit $22.3 trillion by the end of the year, dragging the SCP with it.
Solana to Capture More SCP Market Shares
Moreover, the prominent asset manager asserted that Solana would increase its market dominance in the SCP market. Currently standing at 15%, VanEck expects the “Ethereum killer” to expand its market share to 22% by the end of the year.
As a result, a 22% share of the proposed $1.1 trillion will culminate in a market cap of $250 billion. Furthermore, a valuation of $250 billion will ensure Solana’s price gets to $520 per coin at a sustained circulating supply of 487 million.
Notably, VanEck suggested that the upsurge in Solana SCP dominance will result from the network’s growing developer dominance, DEX volume revenue, and active users.
Meanwhile, VanEck’s corrected prediction still fails to match Bitwise’s outlook for the fifth-largest cryptocurrency by market cap. For context, the latter speculated that the high-caliber cryptocurrency will hit $750 in the same timeframe as VanEck.
At the time of writing, Solana trades at $198.20, up almost 5% in the past 24 hours.
Billionaire investor and crypto enthusiast Mike Novogratz has admitted that he was wrong about XRP.
Speaking on a podcast, Novogratz highlighted how the token’s vibrant community defied his earlier skepticism. He noted that he never thought XRP could be the best-performing token following Trump’s election. However, XRP defied expectations, particularly in the last quarter of 2024.
Novogratz Praising XRP Narrative
Novogratz emphasized the strength of the passionate community behind the token, the “XRP Army,” which he initially underestimated. Despite his doubts surrounding the longevity of the asset, Novogratz now recognizes its community’s significant role in the crypto space.
Initially, he was skeptical about XRP’s viability due to Ripple’s 40% ownership stake, but this concern has since waned.
Moreover, Novogratz commended Ripple’s CEO, Brad Garlinghouse, and the company’s evolution into a significant settlement institution. “Ripple is now an institution,” Novogratz remarked, acknowledging the company’s role in shaping the financial space.
The Role of Community in Crypto Valuation
Praising the XRP Army, he compared their passion to that of Bitcoin supporters, noting that both represent ways for people to store value.
Furthermore, Novogratz explained that one of the most significant lessons he’s learned over time is that community is now an integral part of how cryptocurrencies are valued.
Citing Tesla as an example, he noted that the electric car company’s high valuation is partly due to the strong community of supporters who believe in its mission.
Novogratz highlighted that this trend also played out with XRP and Bitcoin. He added that it extends across the entire crypto space, with communities rallying behind their tokens as symbols of shared values and beliefs.
He also discussed the influence of younger generations, who increasingly favor memes and micro-investing. This transition in how people view and value assets reshapes the investment scene, with crypto at the forefront.
In conclusion, Novogratz’s shift in perspective highlights the significance of community and narrative in the crypto market. XRP is a prime example of how these factors can defy traditional investment logic.
Analysts continue to maintain significantly ambitious price targets for Dogecoin.
In just a few weeks, the crypto market has gone from euphoria to uncertainty to hope and back to uncertainty as anticipated market effects from a pro-crypto U.S. administration wrestle with macroeconomic headwinds.
Throughout these fluctuations, however, one constant has remained: significantly ambitious price targets for the doggy-themed meme coin Dogecoin (DOGE). Are these projections grounded in reality?
Dogecoin to $20?
On Thursday, February 6, widely followed crypto trader Javon Marks suggested that DOGE could surpass the $20 price point in the current market cycle.
For those interested in doing the maths, this represents a 7,900% increase from the current price of $0.25.
It is not the first time Marks has made this call. The analyst has called attention to this ambitious target as a possibility since at least December 28, citing varying potential catalysts.
Meanwhile, Marks is not alone. Other highly followed analysts like Ali Martinez and Ðima James Potts have also expressed similar views.
What’s driving these predictions?
Historical Price Action
In all instances, these analysts cite the memecoin’s historical price action in previous bull market cycles as the reason for their convictions.
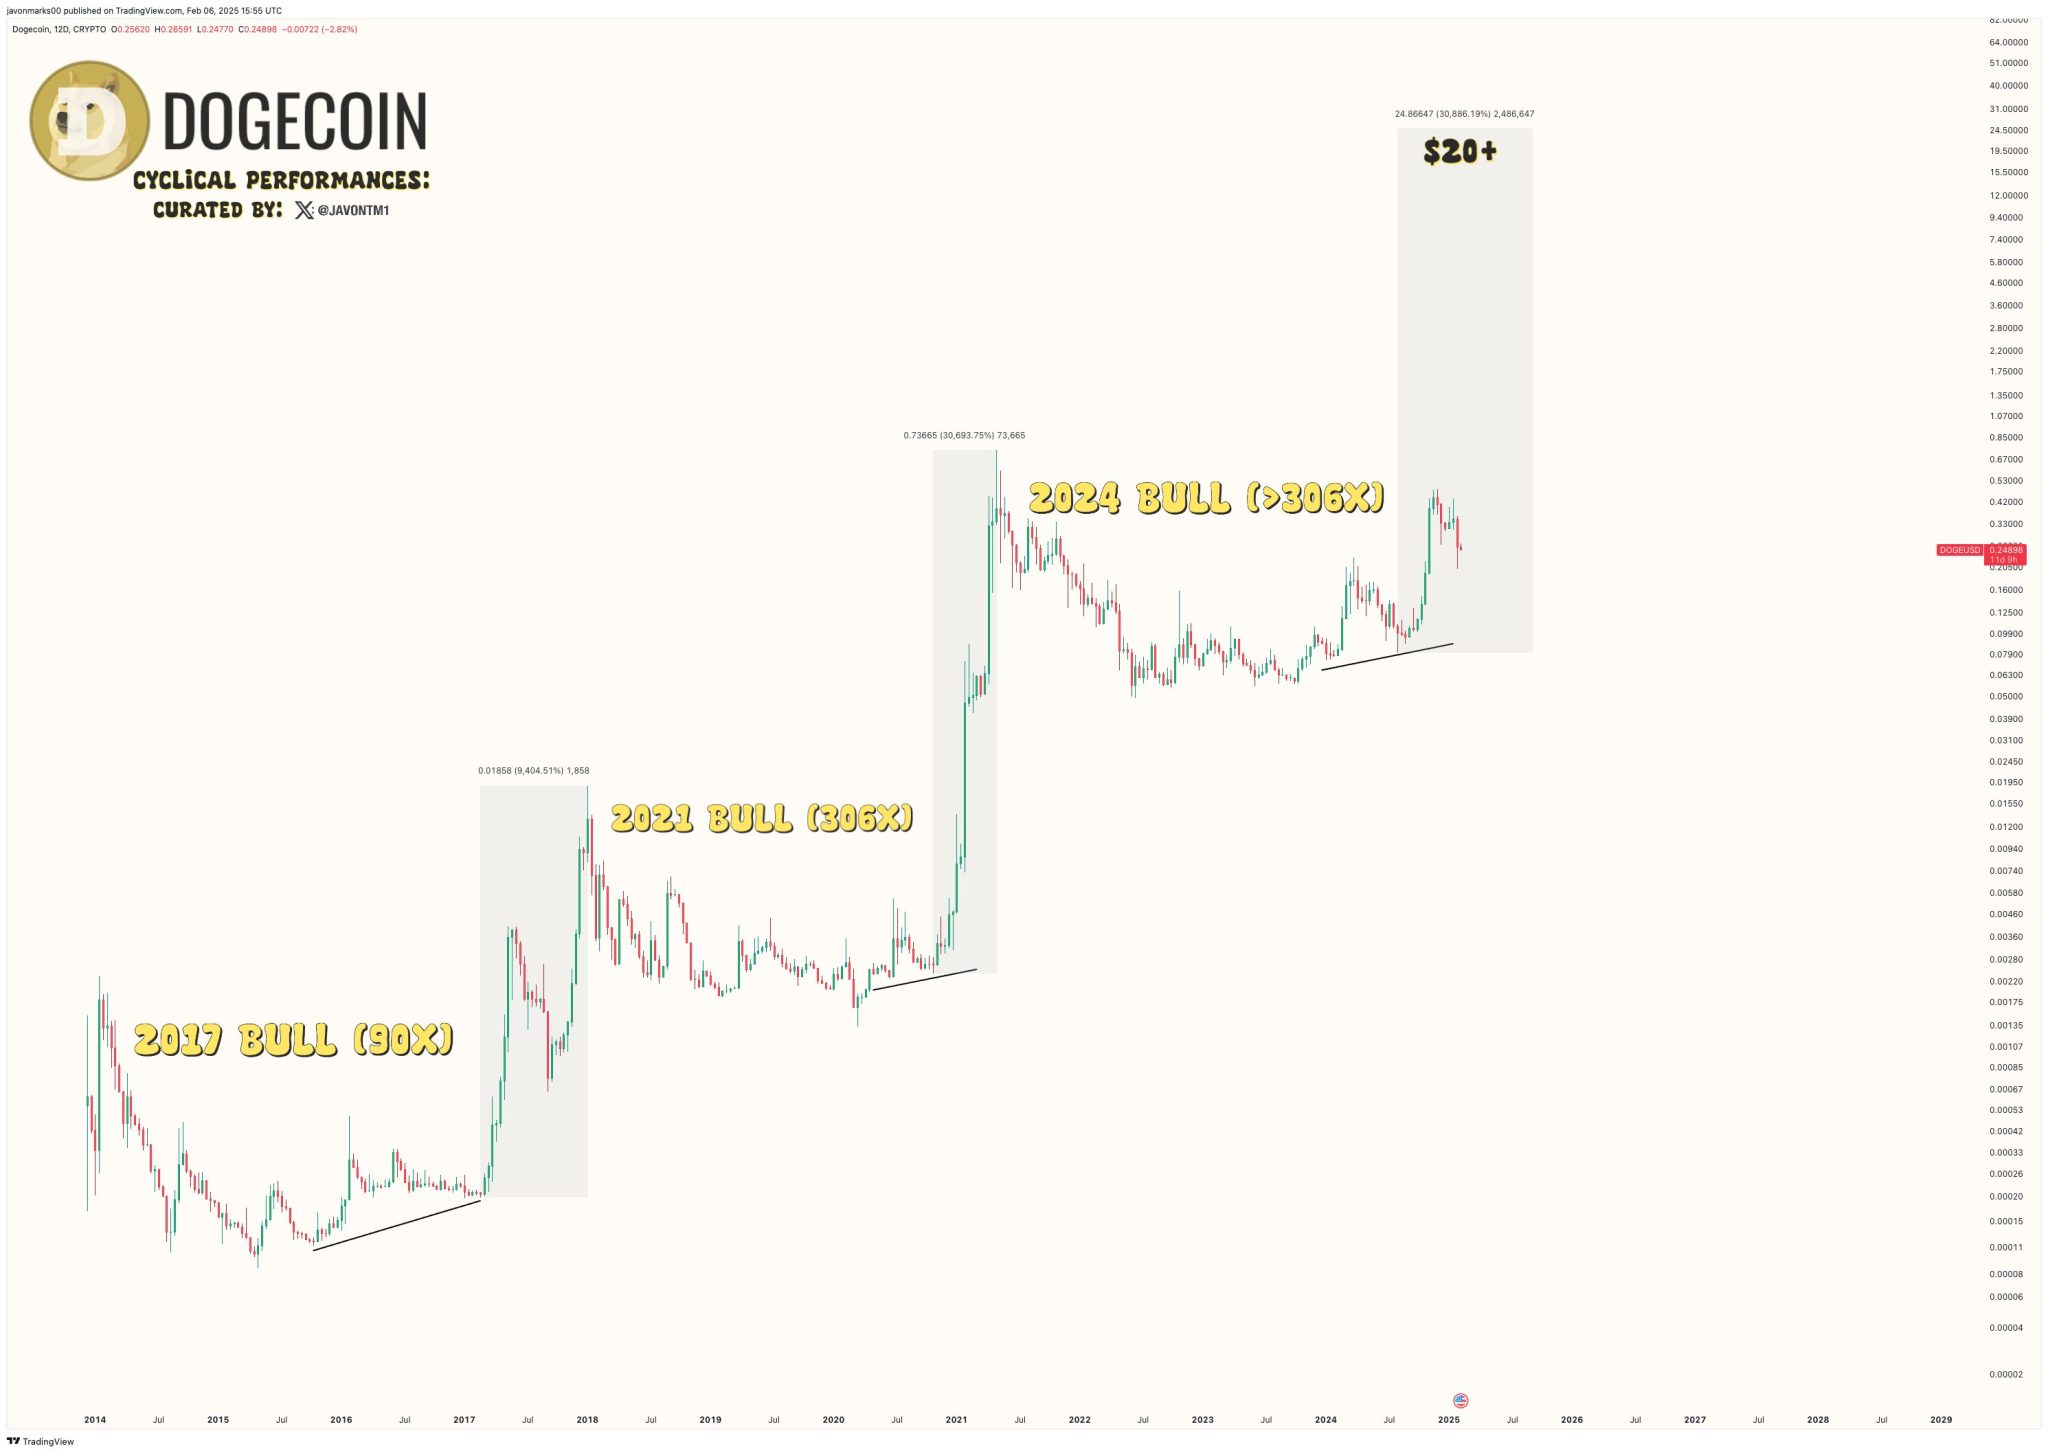
Dogecoins historical bull market performance. Source: Javon Marks
Javon Marks specifically notes that DOGE surged 90x from its lows to hit highs of $0.018 in 2017 and 306x reach $0.74 in 2021. Notably, a continuation of this trend leads to the $20 target.
Other factors that have been cited in support of these astronomical targets include the support the asset receives from the world’s richest man, Tesla CEO Elon Musk.
The billionaire has recently been appointed leader of a non-governmental agency primarily aimed at cutting government spending, cheekily named Department of Government Efficiency (D.O.G.E.), seemingly tying the fortunes of memecoin to the controversial agency.
Wishful Thinking?
Still, as several crypto market participants have highlighted, this $20 price target for DOGE presents one major problem.
Assuming DOGE maintains its current circulating supply of 147.3 billion coins, it would need a $3 trillion market cap to hit the $20 price point—that’s more than Bitcoin’s $1.9 trillion market cap and more than 80 times the memecoin’s current market cap of about $37 billion.
What’s more? Assuming the crypto market sticks to its four-year cycle, DOGE will need to achieve this feat in only a few months.
While the crypto market is no stranger to inexplicable and explosive growth, I mean this is an asset based on a meme with a $37 billion market cap; $3 trillion does seem like a steep figure.
But if there is anything the crypto market has proven, it’s never say never.
Solana breaking under $200 reveals the growing influence of bears over the price trend. Will this result in a quick downfall to $175 or is a bull run signal hiding in plain sight?
As Bitcoin broke under the $97,000 support, Solana lost its critical psychological mark at $200. Amid the growing uncertainty in the crypto market, the pullback in Solana warns of a deeper correction.
However, the underlying technicals hint at a potential comeback if the broader market stabilizes. Should you consider purchasing Solana at discounted prices in hopes of a breakout rally?
Solana Reveals A Falling Channel Pattern in Play
In the 4-hour price trend, SOL price action reveals a falling channel pattern. Within this bearish structure, Solana has dipped from its swing high of $295 to the current market price of $193.53. This marks a 35% price drop over the past three weeks.
Furthermore, the recent bearish candle breached the 23.60% Fibonacci level, breaking the bullish dominance at the $200 psychological level.
Solana Price Chart
Despite the bearish trend, the 4-hour RSI line reveals a bullish divergence. This significant bullish divergence hints at a potential positive rally within the channel pattern.
Along with RSI, the MACD indicator shows the signal line and the MACD line on the verge of a positive crossover. Thus, the technical indicators maintain an optimistic outlook on the upcoming Solana price trend.
Solana ETF Speculation: 84% Approval Chance in 2025
Adding to the underlying optimism for Solana, PolyMarket users anticipate a Solana ETF approval in 2025. Recent data shows PolyMarket users expect an 84% chance of Solana ETF approval this year.
Solana ETF Approval Chances
A potential approval would likely drive liquidity into the market, boosting Solana’s market price. Hence, any positive development regarding a Solana ETF could create bullish ripples in the SOL price trend.
PumpFun’s Supply Surge: A Bearish Risk for SOL?
Despite growing bullish signals, constant supply surges from PumpFun fuel bearish pressure within the channel pattern.
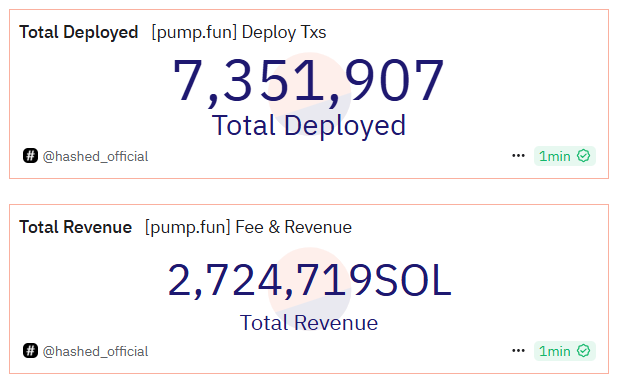
According to a recent X post from OnchainLens, PumpFun has deposited 114,285 SOL tokens to Kraken, worth nearly $27 million. Since the beginning of 2025, PumpFun has transferred a total of 1,021,162 SOL tokens worth $208.32 million.
In total, PumpFun’s complete holdings amount to 2.72 million SOL tokens, valued at approximately $525.81 million.
If PumpFun decides to cash out its entire position, it could result in a massive supply dump, negatively impacting Solana’s price momentum.
Solana Price Targets
As Solana looks to reclaim the 23.6% Fibonacci level at $196.48, the bullish signals from technical indicators suggest a potential recovery above $200. With this momentum, SOL will likely challenge the overhead trendline near the 38.2% Fibonacci level at $211.
If the broader market recovers, a breakout rally in Solana could target the 78.6% Fibonacci level above the $250 psychological mark. On the other hand, a bearish continuation could push SOL down to the crucial $175 support level.
Prominent asset manager Fidelity sold the most Bitcoin yesterday as US exchange-traded funds (ETFs) recorded their first outflow in three days.
The Fidelity Wise Origin Bitcoin Fund (FBTC), the second-largest Bitcoin spot ETF, sold a large volume of BTC yesterday. According to data from Sosovalue, the product dumped 1,075 BTC ($103 million), its second outflow in three days.
Notably, the significant asset liquidation on Thursday was the largest among other ETFs on the same day. This followed Bitcoin’s continued sideways trend, with the pioneering cryptocurrency retracing almost 3% from its daily high yesterday.
Fidelity Leads Outflow
The FBTC’s $103.25 million worth of Bitcoin sales accounted for 73.6% of the entire liquidation among US issuers yesterday. Notably, the investment vehicles sold a cumulative $140.30 million in BTC amid investor sell-offs.
Meanwhile, the other 26.4% came from the Grayscale Bitcoin Trust (GBTC), which sold 440 BTC ($42.21 million) on February 6. With the liquidation, GBTC has now recorded a cumulative net outflow of $21.91 billion.
Nonetheless, other ETFs, including the BlackRock iShares Bitcoin Trust (IBIT) and the ARK 21Shares Bitcoin Trust (ARKB), neither sold nor bought Bitcoin. The Grayscale Bitcoin Mini Trust (BTC) was the only product with a net inflow, buying Bitcoin worth $5.15 million.
The sell-offs on January 5 brought the cumulative net inflow for the over-one-year-old Bitcoin spot ETF market to $40.53 billion. Furthermore, the issuers hold a net asset of $113.51 billion, almost 6% of Bitcoin’s market cap.
Whales Accumulate Bitcoin Regardless
Despite the dip, whales remain keen on stacking Bitcoin. The growing optimism of a preposterous price appreciation in the near term has spurred these accruals.
Aside from US spot ETFs, large holders of the pioneering cryptocurrency have bought the dip. For context, whale accumulation addresses saw an inflow of over 30,000 BTC earlier in the week amid growing sentiments of an imminent price rebound.
Furthermore, since February, the number of addresses holding 100 BTC and above has increased by 135 as institutions increase their exposure to the premier asset. Analysis suggests such accruals suggest a positive disposition on Bitcoin’s long-term outlook.
At press time, Bitcoin trades at $97,410, with a slight 24-hour difference.
The Czech Republic has enacted a law exempting Bitcoin holdings of over three years from capital gains tax.
This comes after Petr Pavel, the President of the Czech Republic, signed a landmark cryptocurrency legislation into law yesterday. The newly signed legislation provides the country with much-needed regulatory clarity on crypto assets.
Bitcoin Holdings Over Three Years Are Now Tax-Exempt
One major aspect of the newly signed law is the exclusion of Bitcoin holdings of over three years from capital gain tax. As previously reported, the country’s parliament unanimously passed this tax exemption bill in December 2024.
Notably, this legislation is also applicable to crypto assets acquired before 2025 if investors sell them under specified conditions in subsequent tax years.
Crypto transactions worth around 100,000 CZK ($4,100) are tax-exempt. Henceforth, crypto traders are not required to report these transactions.
Czech Top Crypto Organization Reacts
Reacting to the development, the Czech Cryptocurrency Association (also referred to as CKMA) disclosed that it played a significant role in preparing the legislation. According to the association, the newly signed legislation, which seemed unthinkable in the past, earned the support of all policymakers.
It mentioned a critical part of the law, noting that crypto companies can access traditional financial services upon obtaining the necessary approval.
The legislation is part of Czech’s efforts to align itself with Europe’s Markets in Crypto-Assets (MiCA) framework.
Last year, the European Securities and Markets (ESMA) provided the final guidance on MiCA laws for EU countries, with the regulation fully implemented on December 30.
The MiCA regulatory framework aims to regulate the crypto markets across EU member states. It focuses on maintaining financial stability and protecting investors in the region.
Czech Central Bank Considers Adopting Bitcoin as a Reserve Asset
The Czech Republic’s tax reform legislation is crucial, given the country’s strong interest in the emerging asset class. Last week, Czech National Bank (CNB) Governor Aleš Michl disclosed that the apex bank is considering allocating a portion of its reserve to Bitcoin (BTC).
According to him, the bank sees Bitcoin as a potential reserve asset because of its zero correlation with bonds. He added that the premier asset could enhance the appeal of a large portfolio.
Michl’s proposal got some pushback, with Czech Finance Minister Zbynek Stanjura expressing concern about Bitcoin’s high volatility issues. The Finance Minister noted that the country should not adopt Bitcoin as a reserve asset, given its high volatility.
Meanwhile, Michl also acknowledged Bitcoin’s volatility issues in his proposal. Yet, he emphasized that the bank’s board will carefully evaluate whether to adopt BTC as a reserve asset.
Holding steady at $0.21, Tron is aiming for a quick turnaround rally to break free from the bearish channel. Could this propel TRX to $0.30?
With Bitcoin hovering around $97,000, the 10th-largest cryptocurrency, TRON, has posted a minor recovery of 0.39% over the past 24 hours. While it struggles to bounce back from the recent market crash, the short-term recovery hints at a potential rebound.
However, the significant decline in crypto market sentiment limits TRON’s chances of a bullish comeback. Amid these conditions, is a breakout from the falling channel pattern possible for TRON? Let’s dive into the analysis.
TRON Price Trend: Falling Channel Pattern Takes Shape
In the daily chart, the TRX price trend reveals a quick bump, leading to a falling channel pattern. After a 94% surge on Dec. 3, TRON took a quick pullback with a 23% drop on Dec. 4.
Tron Price Chart
The price decline extended, now forming a falling channel pattern. Within the pattern, the TRX price has found a crucial support level just before the $0.20 psychological mark.
With multiple lower price projections, TRON is holding its ground above the $0.21 mark. With this sustained support, the price trend also hints at a double-bottom reversal within the falling channel pattern.
Technical Indicators: Signs of a Potential Reversal
Supporting the reversal potential, the daily RSI line indicates a bullish divergence between the two lows. However, TRX is trading within the lagging spans A and B, which still maintain a bearish outlook.
Additionally, the conversion line, baseline, and lagging span line modestly defend short-term consolidation within the channel. Despite this, the overall price action suggests a bullish breakout could be on the horizon.
Community Sentiment: Tron’s Strong Market Performance
Amid the potential for a breakout rally, a recent X post from LunarCrush analytics ranked Tron first on Altrank.
This ranking reflects strong community activity and solid market performance, offering a sentiment boost for Tron, even amid broader market corrections.
Tron Price Target: Can TRX Reach $0.30?
Based on Fibonacci levels from the recent pullback, a channel breakout rally could push TRX prices to the starting point of the channel, near the 38.2% Fibonacci level. This level aligns with the $0.30 psychological mark, suggesting an upside potential of over 30%.
However, with the broader market pullback, TRX might dip below $0.21 and test the local support trendline. This could lead to a 12% drop, testing the $0.20 psychological level.
Will the growing fear in the market drop Ethereum back to $2,150? or is the uptrend to $4,100 inevitable amid rising institutional support?
As Bitcoin retraces back to the $97,000 mark, Ethereum is back to retest the bullish dominance at $2,700. Amid the increased market volatility, the Fear and Greed Index has shifted into the fear zone, now sitting at 35.
Currently, Ethereum is down 4.17% over the past 24 hours, extending its 7-day decline to 16.49%. With bulls struggling to maintain dominance above the $2,700 mark, ETH price analysis points to a possible rally following a triangle breakout pattern.
Ethereum Price Trend: Triangle Holds the Key
The daily chart shows that Ethereum’s price trend is strongly influenced by the Asian trend line, which currently dominates the market landscape. Under this influence, Ethereum has fallen from its recent swing high of $4,105 to the current price of $2,704.
This represents a significant 34% decline in Ethereum’s value over the past two months. However, with recent lower price rejections, Ethereum continues to hold above its local support trend line.
As two trend lines converge, Ethereum is now trapped within a triangle pattern. The price is testing the bottom support level, a crucial crossroads that will determine its future price direction.
While the ongoing correction has pushed Ethereum toward the lower Bollinger Band, the RSI levels remain above the oversold threshold. However, the RSI fails to show any clear bullish signals through divergence.
Ethereum Price Chart
Institutional Demand for ETH: BlackRock Leads the Accumulation
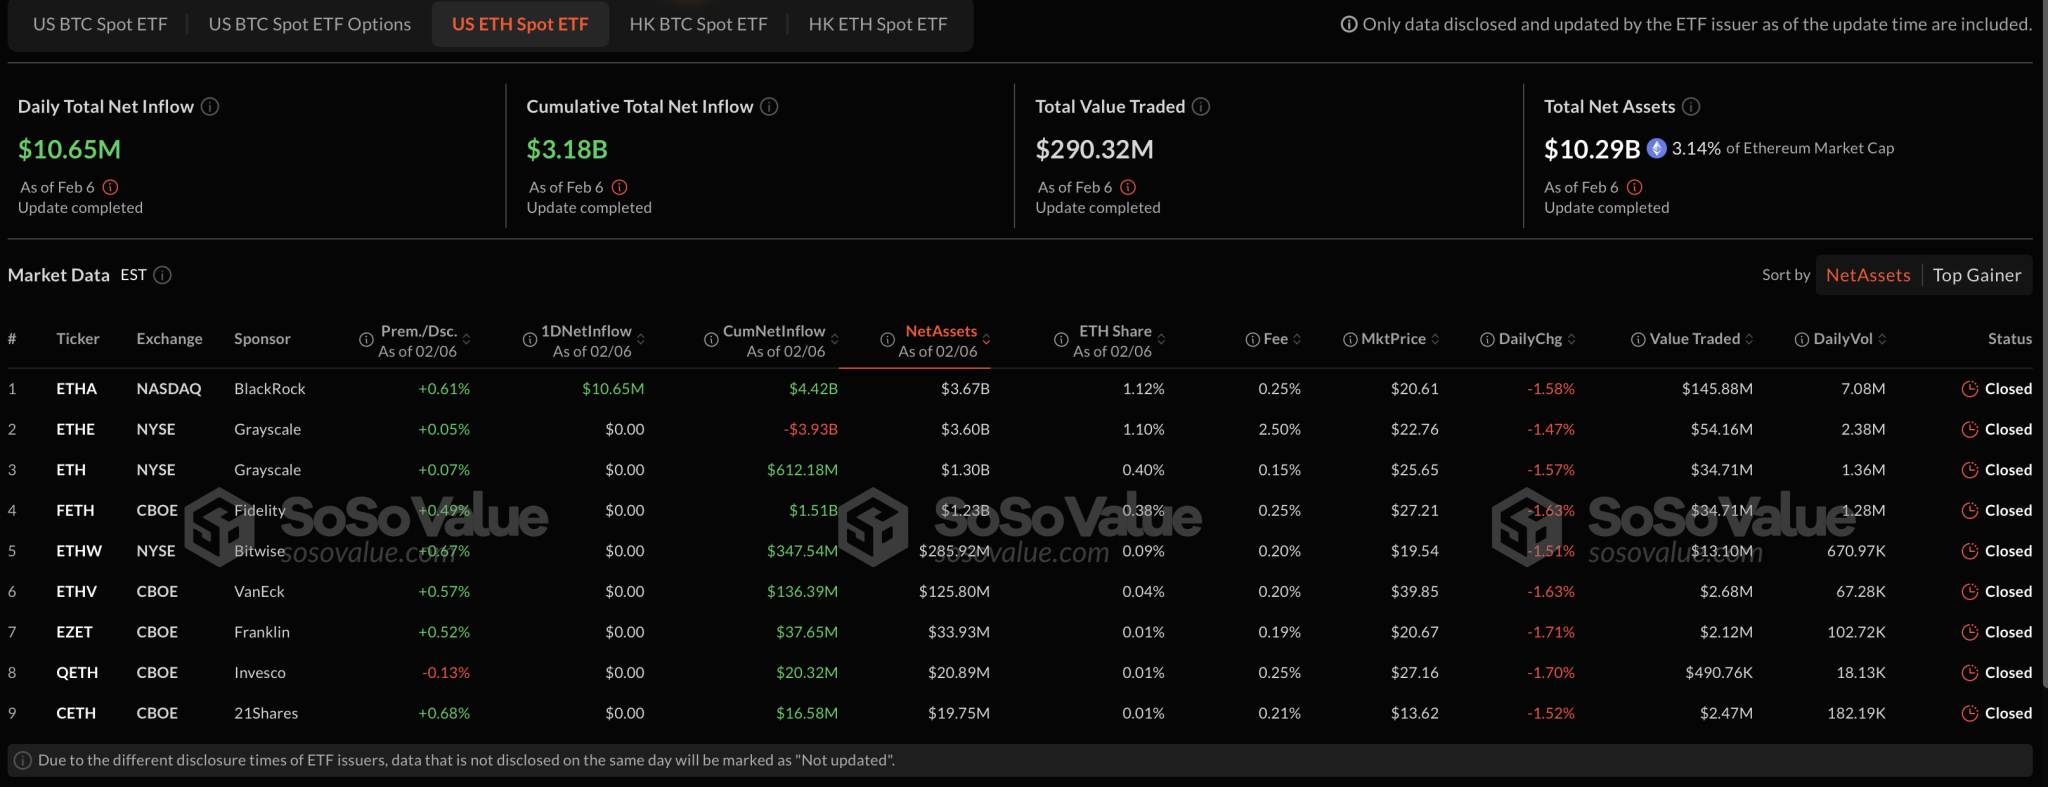
Despite the broader bearish trend in the crypto market, institutional demand for Ethereum remains strong. On February 6, while 8 out of 9 Ethereum ETFs reported net-zero flow, BlackRock was the only buyer.
BlackRock acquired $10.65 million worth of ETH on Thursday, bringing its total inflow to $4.42 billion. This cumulative figure makes it the most prominent ETF holding Ethereum.
ETH ETFs
Investor Sentiment: Confidence Remains Strong in Ethereum ETF
Continuing with the theme of institutional support, Michael van de Poppe highlighted in a recent X post that investors have purchased over $500 million worth of Ethereum through Ethereum ETFs over the past week.
In his statement, he emphasized, “They are not buying because they assume the bull market is over.”
With rising inflows over the past few weeks, the institutional market remains optimistic about Ethereum’s potential in the crypto bull run.
As institutional support increases, Ethereum’s market price will likely eventually reflect this demand.
Whale Activity: Shift in Holdings During Market Crash
Amid the strong support from institutions, Ethereum’s whale holdings have undergone significant changes. According to IntoTheBlock’s balance-by-holdings indicator, whale sentiment shifted during the recent market downturn.
Ethereum holdings worth over $10 million dropped from $379.36 billion to $312.93 billion. This represents a 17.51% decline over the past week and a notable rebound from the $285.81 billion low reached during the market crash.
Similarly, holdings in the $1 million to $10 million range decreased from $35.38 billion to $29.51 billion. Surprisingly, this price band saw little offloading during the crash, indicating that investors holding between $1 million and $10 million in Ethereum are showing stronger hands.
Ethereum Whales Holdings
Ethereum Price Prediction: Key Levels to Watch
As demand for Ethereum gradually returns, short-term selling sentiment is expected to fade. If this occurs, the Fibonacci levels suggest a potential price target of $4,165 in the event of a triangle breakout.
However, if the local support trend line fails to hold, Ethereum could experience a significant drop, potentially testing the recent low around $2,150. This would also put immense bearish pressure on the psychological $2,000 support level.
The proposed Dogecoin uptrend remains on track as a prominent analyst highlights a crucial level the asset must hold to reach greater heights.
The Dogecoin moonshot calls keep pouring in amid long-term bullish sentiments and historic cyclical performance. Most recently, seasoned market analyst Ali Martinez suggested that the meme coin’s price upsurge to double digits remains on course.
However, the prominent market analyst shared a crucial price level Dogecoin needs to hold to keep the upsurge prospect alive. He disclosed this in his recent analysis, in which he also highlighted the asset’s price action depending on its reaction around the make-or-break level.
Dogecoin Nears Crucial Price Level
After a strong rebound on Monday, the largest meme coin by market cap has posted three consecutive downtrend days. The consolidation has seen Dogecoin correct 6%, taking its month-to-date retracement to 23%.
Amid this performance, Martinez speculated that the $0.19 price mark is a crucial support level Dogecoin should avoid falling below.
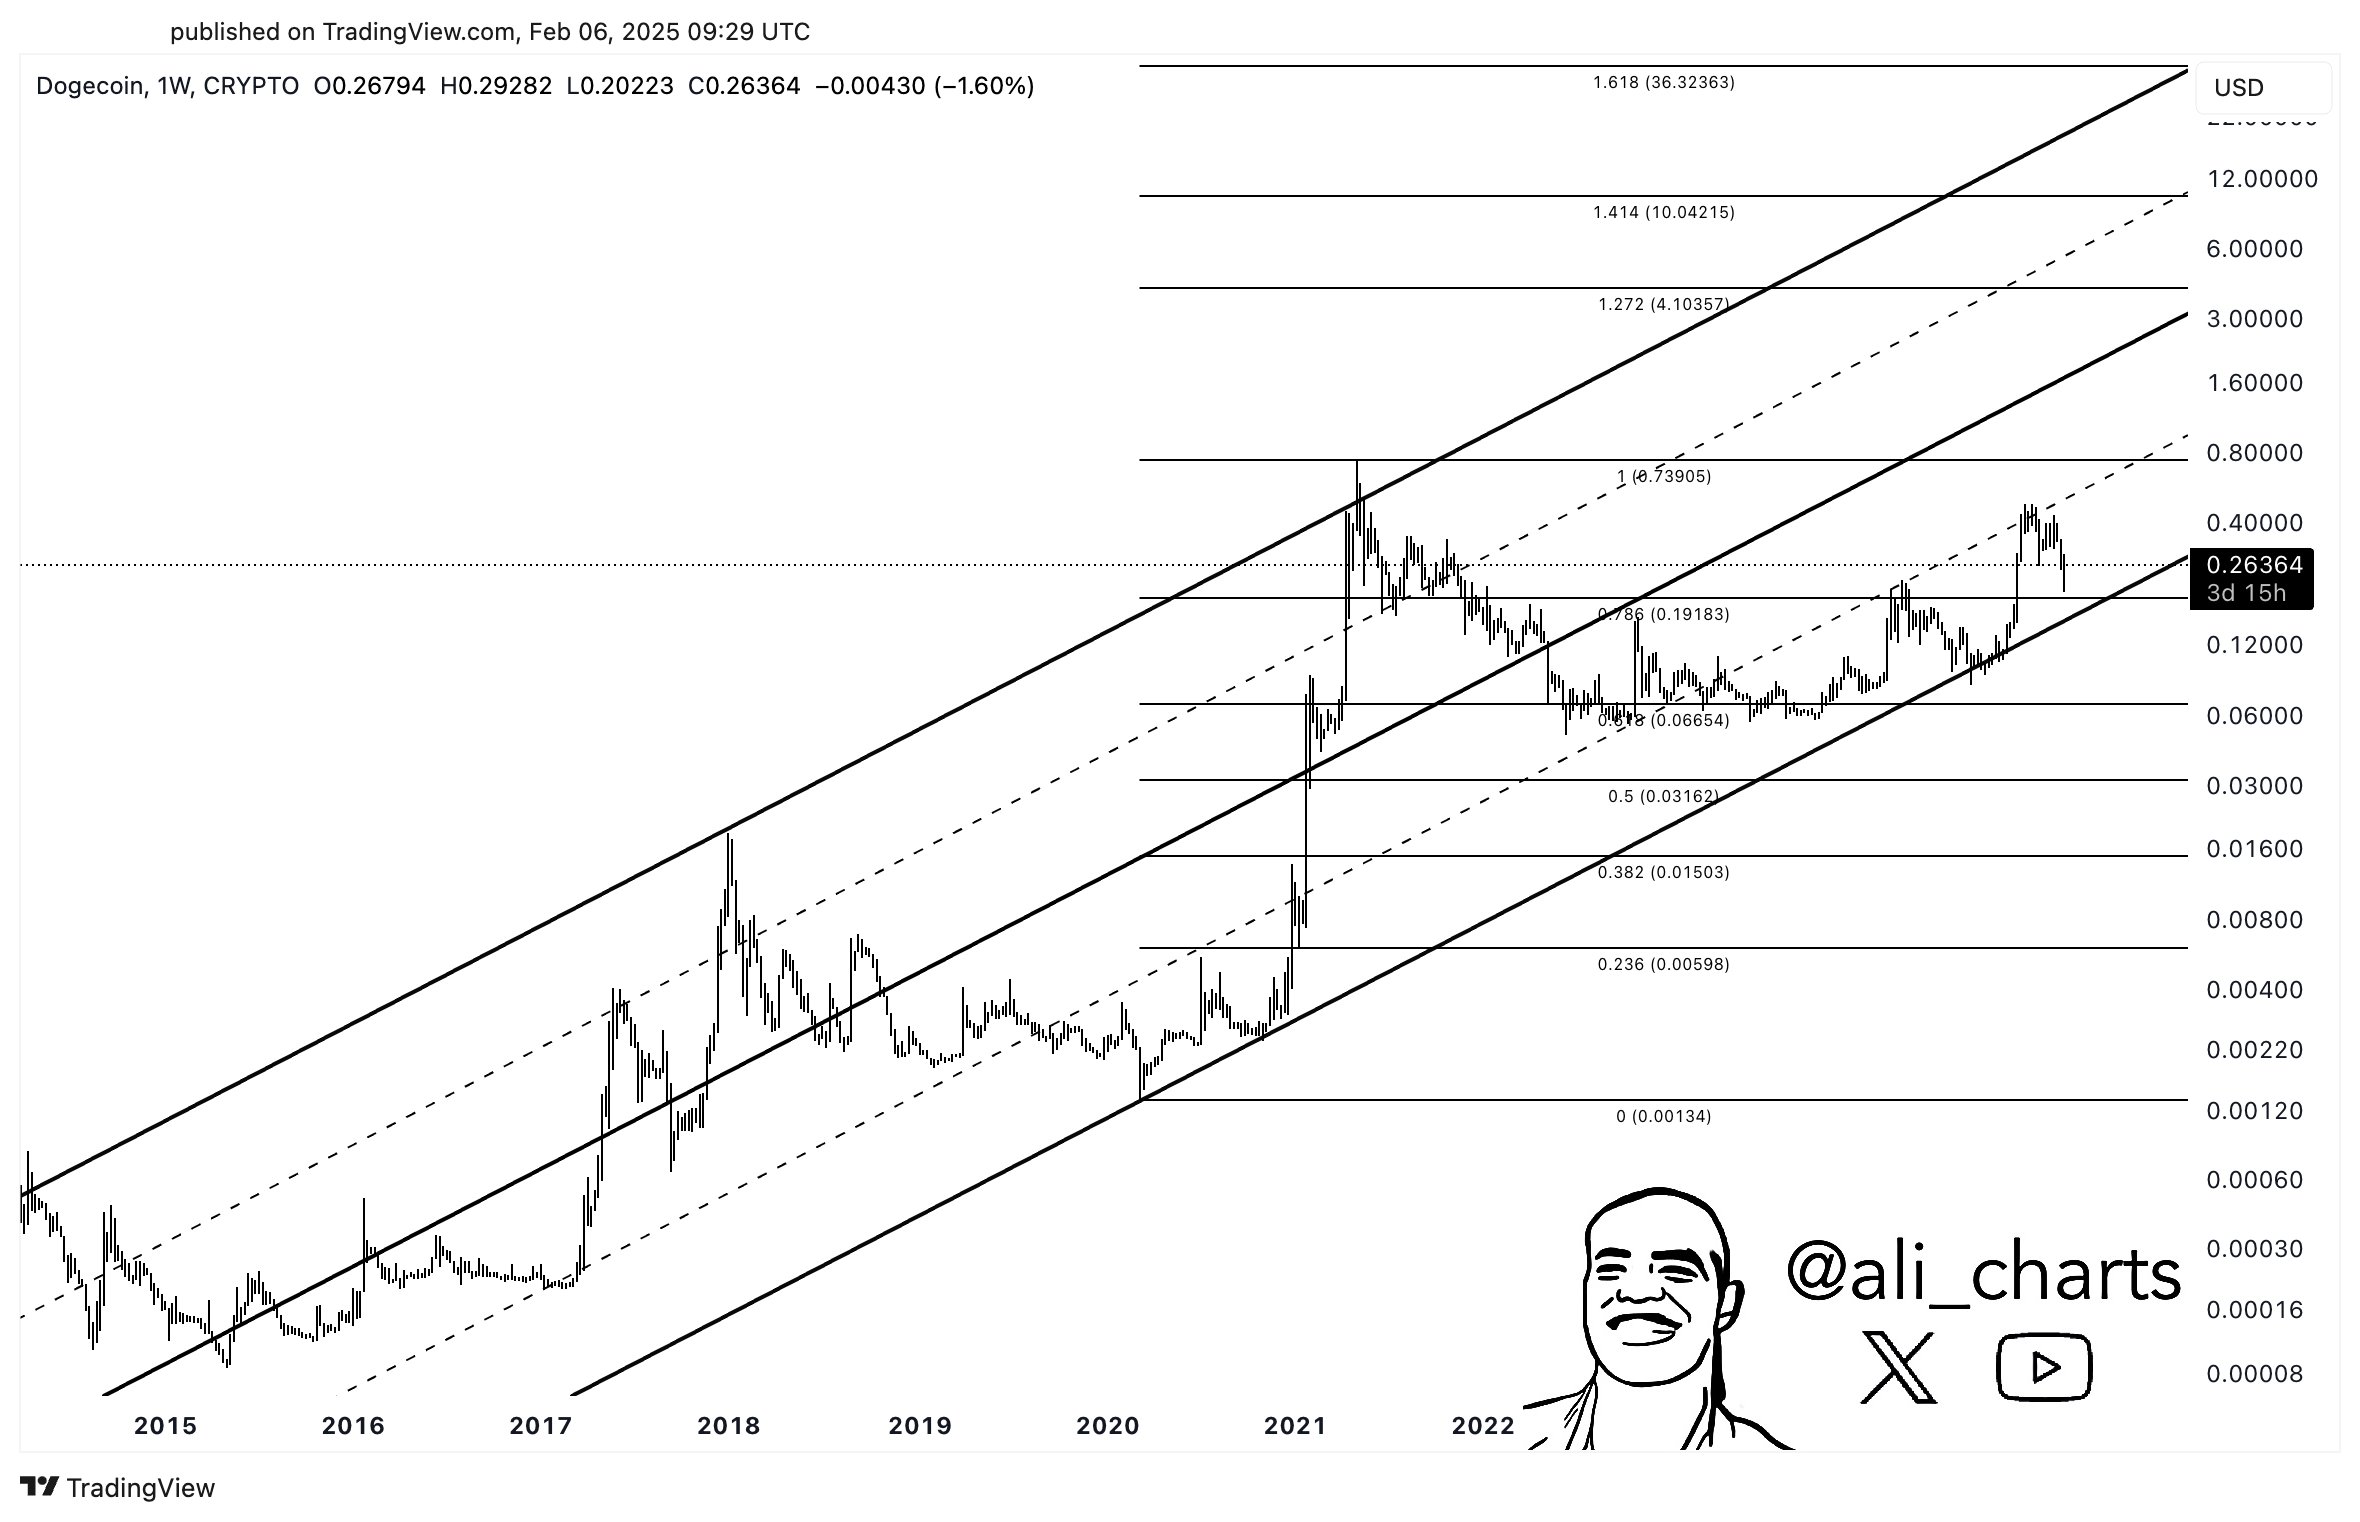
An accompanying chart shows that the crucial level lies at the lower boundary of its multi-year ascending channel, a price structure Dogecoin has consolidated around since 2014. Nonetheless, Martinez expects Dogecoin to hold the price mark, riding on the building momentum around the meme coin’s ecosystem to resume a parabolic rally to $10.
Dogecoin to $10
Price Levels Following Dogecoin’s Reaction
Nonetheless, Martinez highlighted levels Dogecoin could reach depending on its price action around the crucial level. According to the accompanying chart, Dogecoin could either surge considerably to unprecedented highs or capitulate to deeper lows.
If the level holds, Dogecoin will target the tip of the ascending channel at the 1.414 Fibonacci extension at $10.04. Meanwhile, the meme coin could surge further to the 1.618 Fib. level at $36.32.
Other Dogecoin to $10 Analysis
Meanwhile, Martinez is not the only commentator predicting an over 3,900% price surge to $10. Analyst Dima James Potts also expects the meme coin to reach the price mark this year, citing historic cyclical price action.
Furthermore, X’s AI chatbox Grok suggested that Dogecoin could hit $10 but with a longer timeframe. The interactive tool predicted the surge to the ambitious price level by 2040.
In the meantime, Dogecoin trades at $0.2486, almost unchanged from the past day.