Recent analyses show some interesting data about the behavior of the Bitcoin market following its fourth halving.
As the crypto market navigates this phase, pundits have provided detailed perspectives on the potential implications for price trends and volatility, drawing connections to historical patterns and current market conditions.
An anonymous account, Bit Paine, highlighted the ongoing effects of Bitcoin’s fourth halving, which occurred approximately 19 weeks ago. According to Bit Paine, the total number of blocks stands at 859,432, with 19,442 blocks mined since the halving.
It has been ~19 weeks since the fourth #bitcoin halving.
We are at block 859,432 or H+19,442, implying a net -60,756 #BTC on the market compared to a counterfactual where the halving did not occur.
The equivalent of a ~$3.5B buy that will never be sold and will repeat every…
— Bit Paine ⚡️ (@BitPaine) September 1, 2024
This has resulted in a net decrease of 60,756 BTC in the market compared to a scenario without the halving, equivalent to around $3.5 billion in value. This reduction reflects a supply that will not re-enter circulation, a process expected to repeat every 19 weeks due to the halving.
However, the potential impact of such a supply reduction has been temporarily offset by the recent sale of approximately 50,000 BTC by German authorities, the U.S. government, and the Mt. Gox stash.
Bit Paine concluded that while the supply shock has been delayed, it is steadily building up.
Bitcoin’s “Chopsolidation”
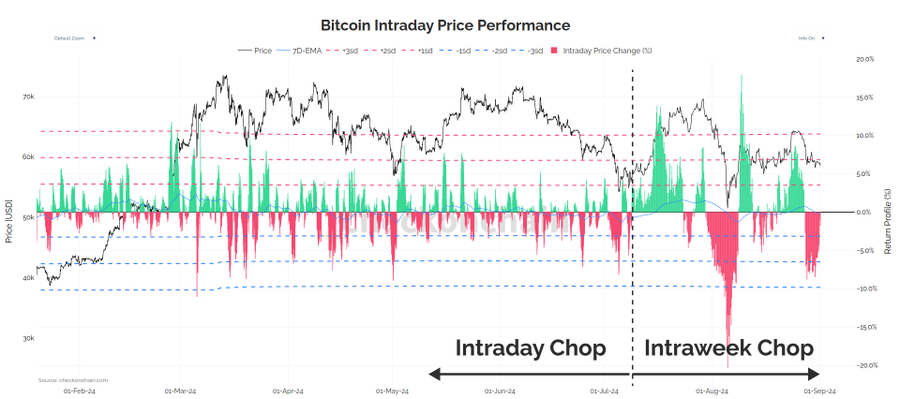
Another analysis by the account Checkmate examines Bitcoin’s current market behavior, describing it as “chopsolidation.” This term refers to the volatile sideways movement within a specific price range.
Between February and July 2024, Bitcoin experienced relatively contained intraday price swings. The analyst observed that Bitcoin’s price swings are becoming larger and more sustained, indicating growing instability within the current range. Consequently, the market may soon move to a different price level.
Historical Patterns and Future Trends
Meanwhile, in a separate analysis, analyst Kyledoops presented a historical analysis of Bitcoin’s price cycles, discussing what he terms the “Blue Year” and “Red Year.”
According to Kyledoops, Bitcoin’s current price action resembles the calm before the storm, characteristic of a “Blue Year” that typically precedes significant price surges during a “Red Year.”
Bitcoin's price action now echoes the calm before the storm, marking the end of a "Blue Year"—a crucial, quiet period setting up for the explosive "Red Year."
Historically, this phase has preceded all-time highs, as seen in 2012, 2016, and 2020, hinting at the next big surge on… pic.twitter.com/zonpawtK7g
— Kyledoops (@kyledoops) September 1, 2024
Historical patterns from 2012, 2016, and 2020 show that these calm periods often set the stage for explosive growth, with 2024 potentially following this trend.
A Milestone in Bitcoin’s Bull Market Cycle
In related news, veteran trader Peter Brandt has previously pointed out that Bitcoin may be nearing an unusual milestone in its current bull market cycle. Brandt noted that this cycle might soon become the longest in Bitcoin’s history without achieving a new all-time high (ATH) following a halving.
Reflecting on past cycles, Brandt observed that after Bitcoin’s first halving in 2012, it quickly surged to new heights within eight weeks. In the 2015-2017 cycle, however, Bitcoin took a 27% plunge after halving and took 24 weeks to break through previous highs. As Bitcoin continues its sideways trend, the market is left to wonder whether a new ATH is on the horizon or if it is slipping further away.
DisClamier: This content is informational and should not be considered financial advice. The views expressed in this article may include the author's personal opinions and do not reflect The Crypto Basic opinion. Readers are encouraged to do thorough research before making any investment decisions. The Crypto Basic is not responsible for any financial losses.


