




Bitcoin approaches resistance as Ethereum and XRP recover, while Sui advances and Cardano gains nearly 11%. Key crypto levels to watch for October 5, 2026.
| Asset | Price | 24-hour change | Aggregate 24-hour volume | Rank |
|---|---|---|---|---|
| Bitcoin | $86,081 | +1.49% | $20.60 billion | 1 |
| Ethereum | $2,716.43 | +0.81% | $7.49 billion | 2 |
| XRP | $1.51 | +1.39% | $1.42 billion | 5 |
| Sui | $1.23 | +4.83% | $827.00 million | 25 |
| Cardano | $0.269078 | +10.78% | $838.82 million | 16 |
Bitcoin MACD Improves Below $87,330 Resistance
Bitcoin’s completed October 4 daily candle opened at $84,743, reached $86,737 and closed at $86,515—a 2.09% advance. The close returned BTC to the upper part of its recent range but did not clear resistance between $87,086 and $87,330.
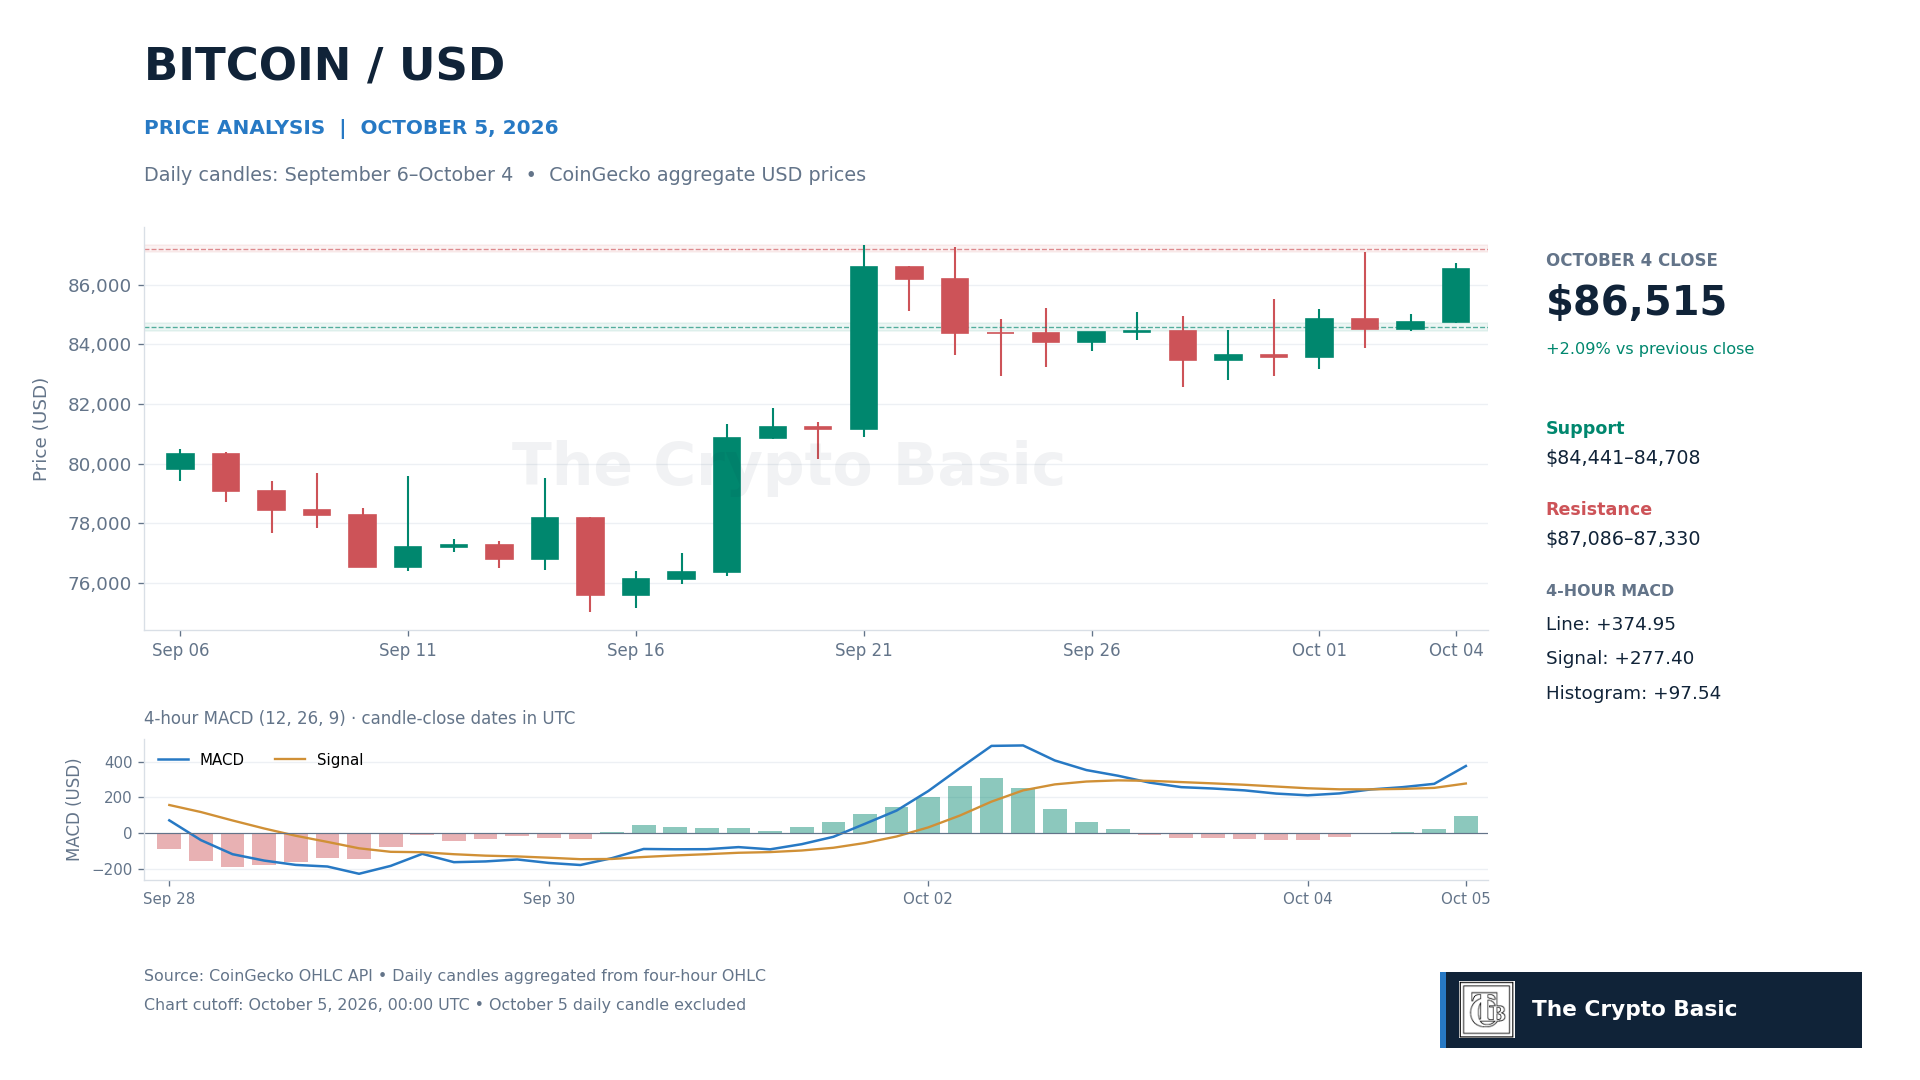
On the completed four-hour candle ending October 5 at 00:00 UTC, MACD using 12, 26, and 9 exponential periods reached 374.95, above its 277.40 signal line. The histogram expanded to 97.54 from 22.61.
This confirms improving short-term momentum, but not a price breakout. BTC price needs a daily close above $87,330 to confirm range expansion toward the upper-$88,000 region and $89,000. A rejection followed by a close below $84,441 would invalidate the immediate bullish setup and reopen $83,898, followed by $82,580–$82,950.
Ethereum Holds Above Its Bollinger Midline
Ethereum’s price October 4 candle closed at $2,726.64 after trading between $2,686.33 and $2,736.97. The 1.48% daily rise left ETH above the $2,647.91 midline of its daily Bollinger Bands, calculated with a 20-day simple moving average and two population standard deviations.
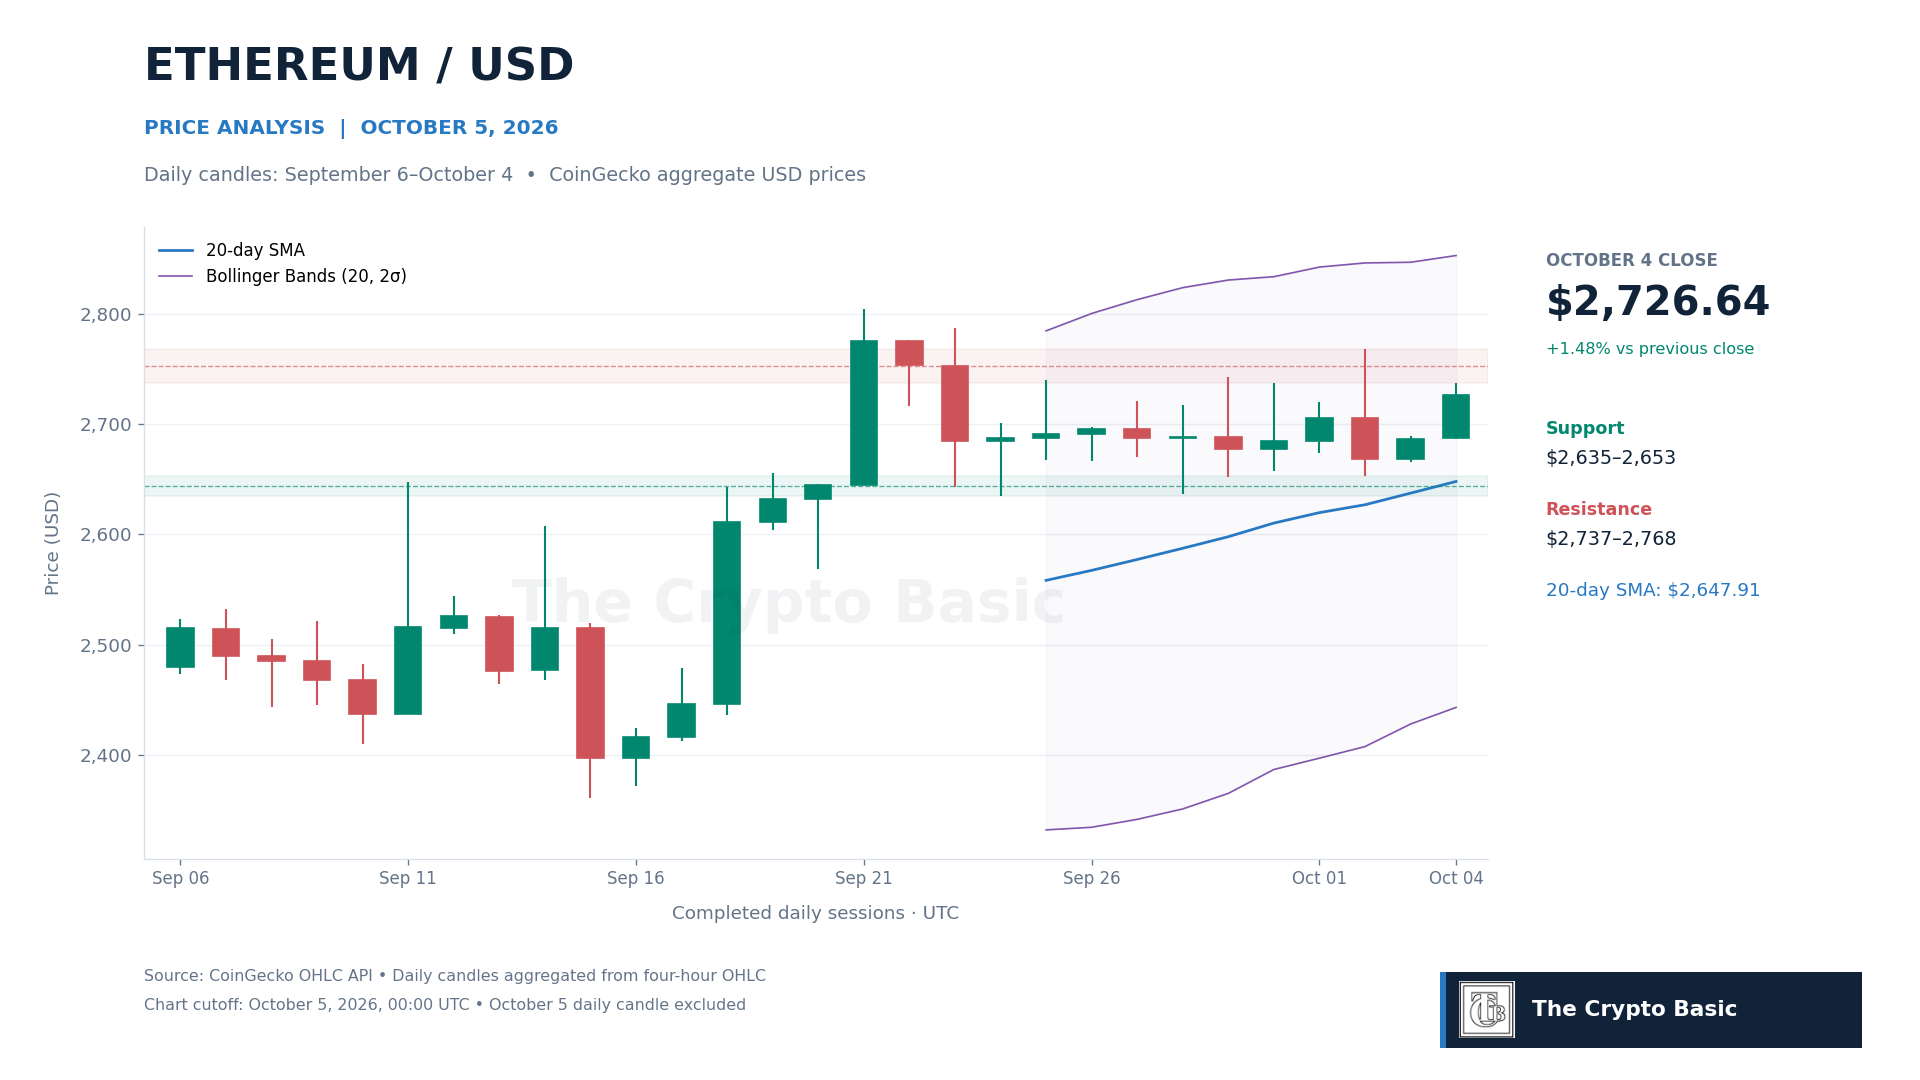
The upper band stands near $2,852.76 and the lower band near $2,443.06. ETH remains inside that envelope, making the setup constructive but not a confirmed breakout.
A daily close above $2,737–$2,768 would strengthen the case for a move toward $2,787–$2,804. The upper band would become the next dynamic reference if momentum persists. A close below $2,635 would weaken the structure, bringing the Bollinger midline and $2,610–$2,583 back into focus.
XRP Reclaims Its 20-Day Moving Average
XRP closed October 4 at $1.52 after trading from $1.49 to $1.53. The close was 2.01% above the open and remained above the rising 20-day simple moving average at $1.466.
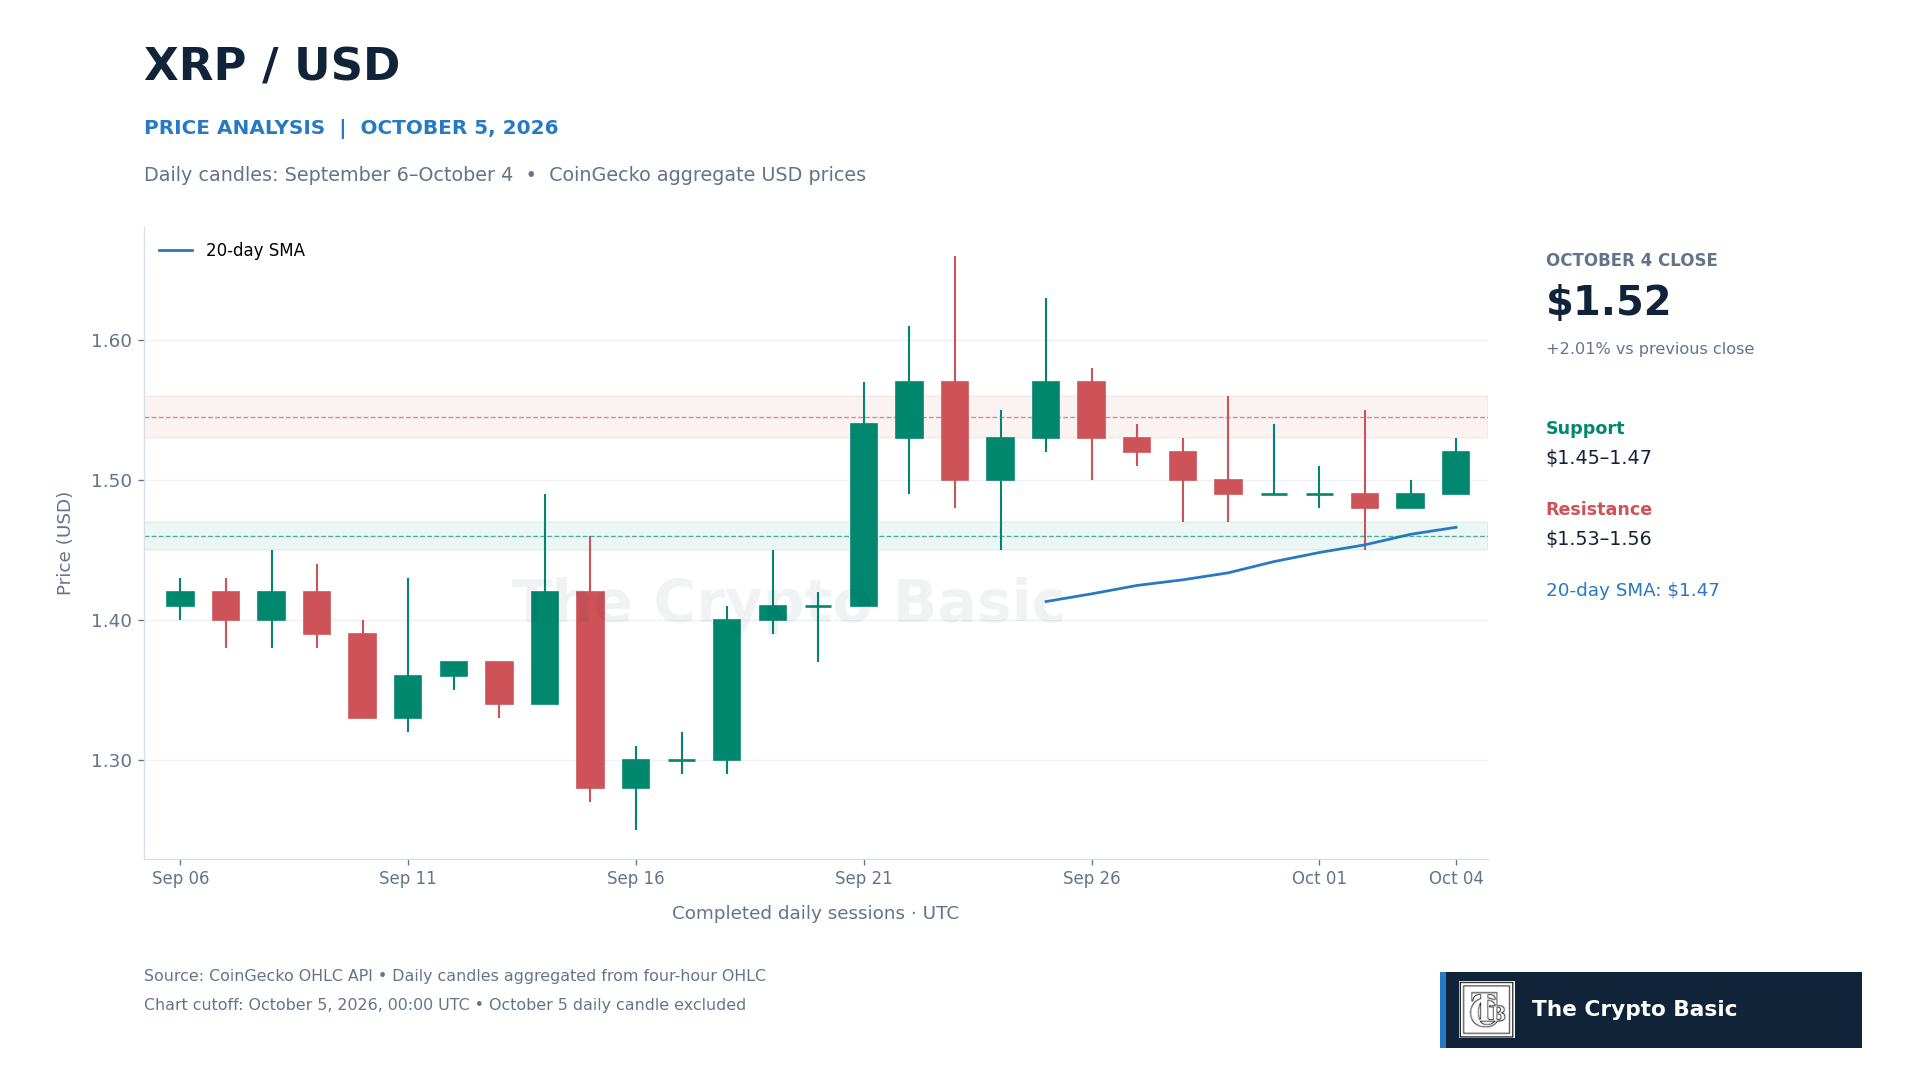
The moving-average recovery improves the short-term structure, although the completed candle stopped at the lower edge of resistance. XRP needs a daily close above $1.56 to confirm a break of the $1.53–$1.56 supply zone. That would shift attention to $1.61 and $1.66.
A close below the 20-day average—and especially below $1.45—would invalidate the recovery and expose $1.41, followed by $1.37. XRP remains range-bound until one of these closing conditions is met.
Sui Holds the First Fibonacci Retracement
Sui’s completed October 4 candle advanced 2.54%, closing at $1.21 after testing $1.26.
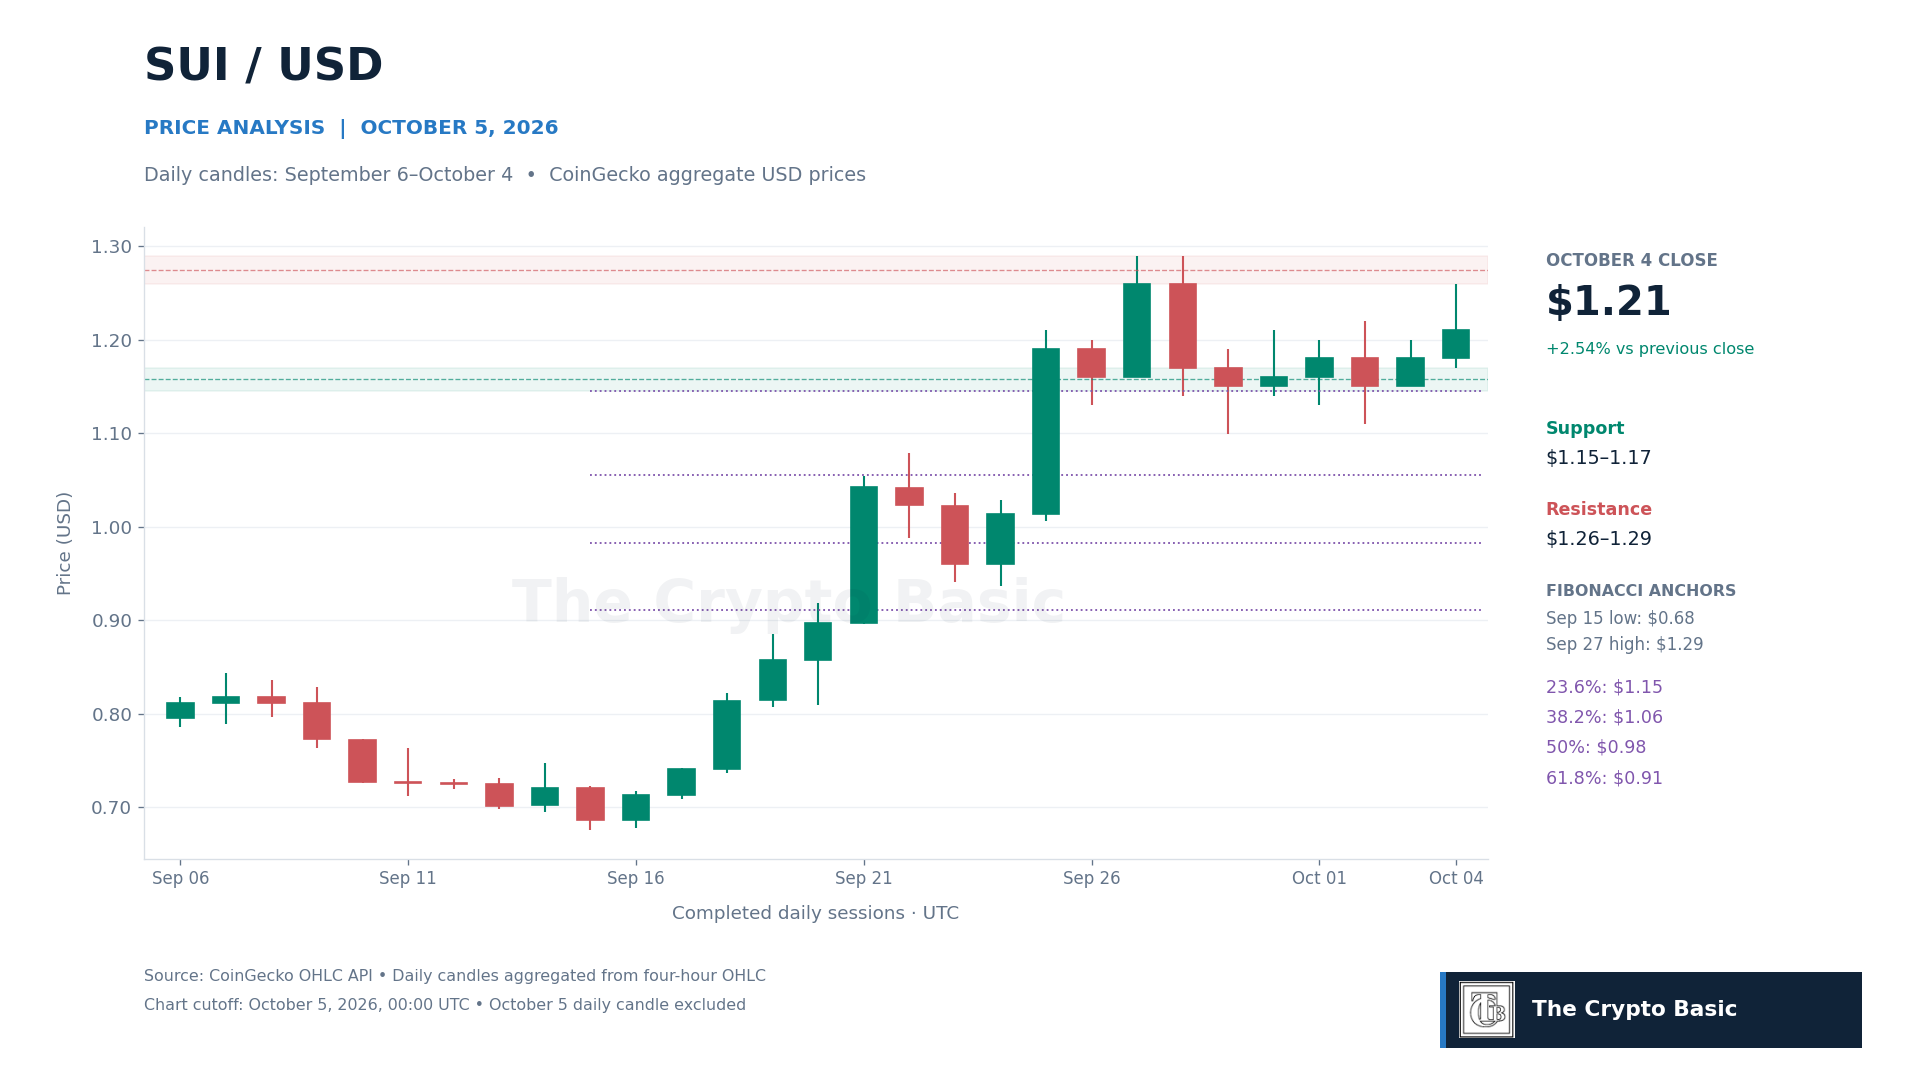
The Fibonacci map uses the upward swing from the September 15 low of $0.675641 to the September 27 high of $1.29. This places the 23.6% retracement at $1.1450, the 38.2% level at $1.0553, the midpoint at $0.9828, and the 61.8% retracement at $0.9103.
Price has held above the first retracement, preserving the recovery structure, although $1.26–$1.29 remains unbroken resistance. A completed daily close above $1.29 would confirm a breakout. Only after that confirmation would the 1.272 extension near $1.4571 become a conditional upside reference.
A daily close below $1.1450 would invalidate the immediate bullish setup and expose $1.0553, followed by $0.9828. The live $1.23 quote remains an intraday observation rather than completed-candle confirmation.
Cardano RSI Rises but Price Still Needs a Closing Breakout
Cardano produced the strongest rolling move in this five-asset group. Its completed October 4 candle rose 6.40%, opening at $0.243888 and closing at $0.259507 after reaching $0.267926.
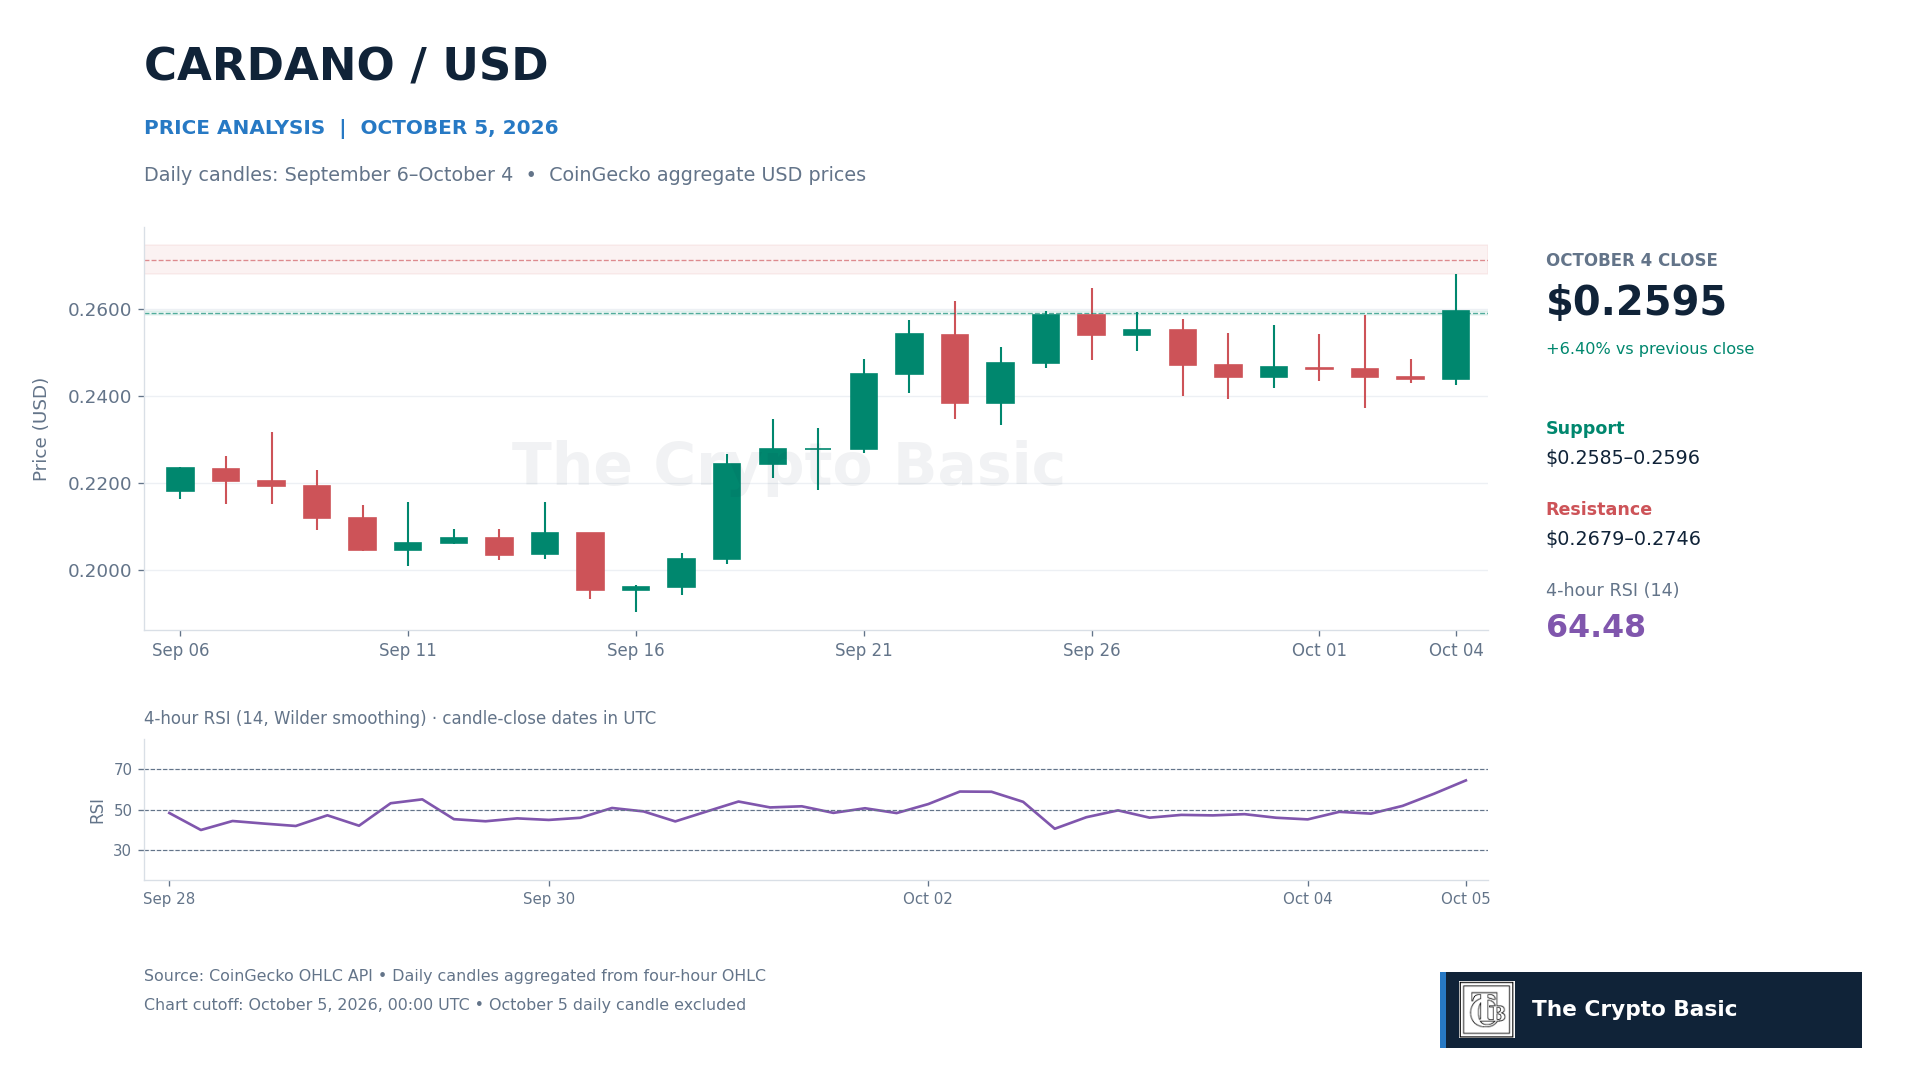
The 14-period four-hour RSI, calculated with Wilder’s smoothing, increased to 64.48 on the completed candle ending at 00:00 UTC, up from 57.91. Momentum improved without entering the conventional overbought region above 70.
ADA’s live quote of $0.269078 was above the October 4 high at the cutoff, but that intraday move was not yet a confirmed closing breakout. A daily close above $0.2679, with follow-through through $0.2750, would confirm continuation.
A reversal below $0.2585 would weaken the attempt, while a close below $0.2425 would invalidate the immediate recovery and expose $0.237–$0.230.