



XRP Monthly RSI Returns to Historical Recovery Zone as Key Crossover Remains Unconfirmed.
XRP’s monthly chart is showing an RSI configuration similar to conditions seen before two previous large price advances, but the technical signal highlighted in the setup has not yet been confirmed.
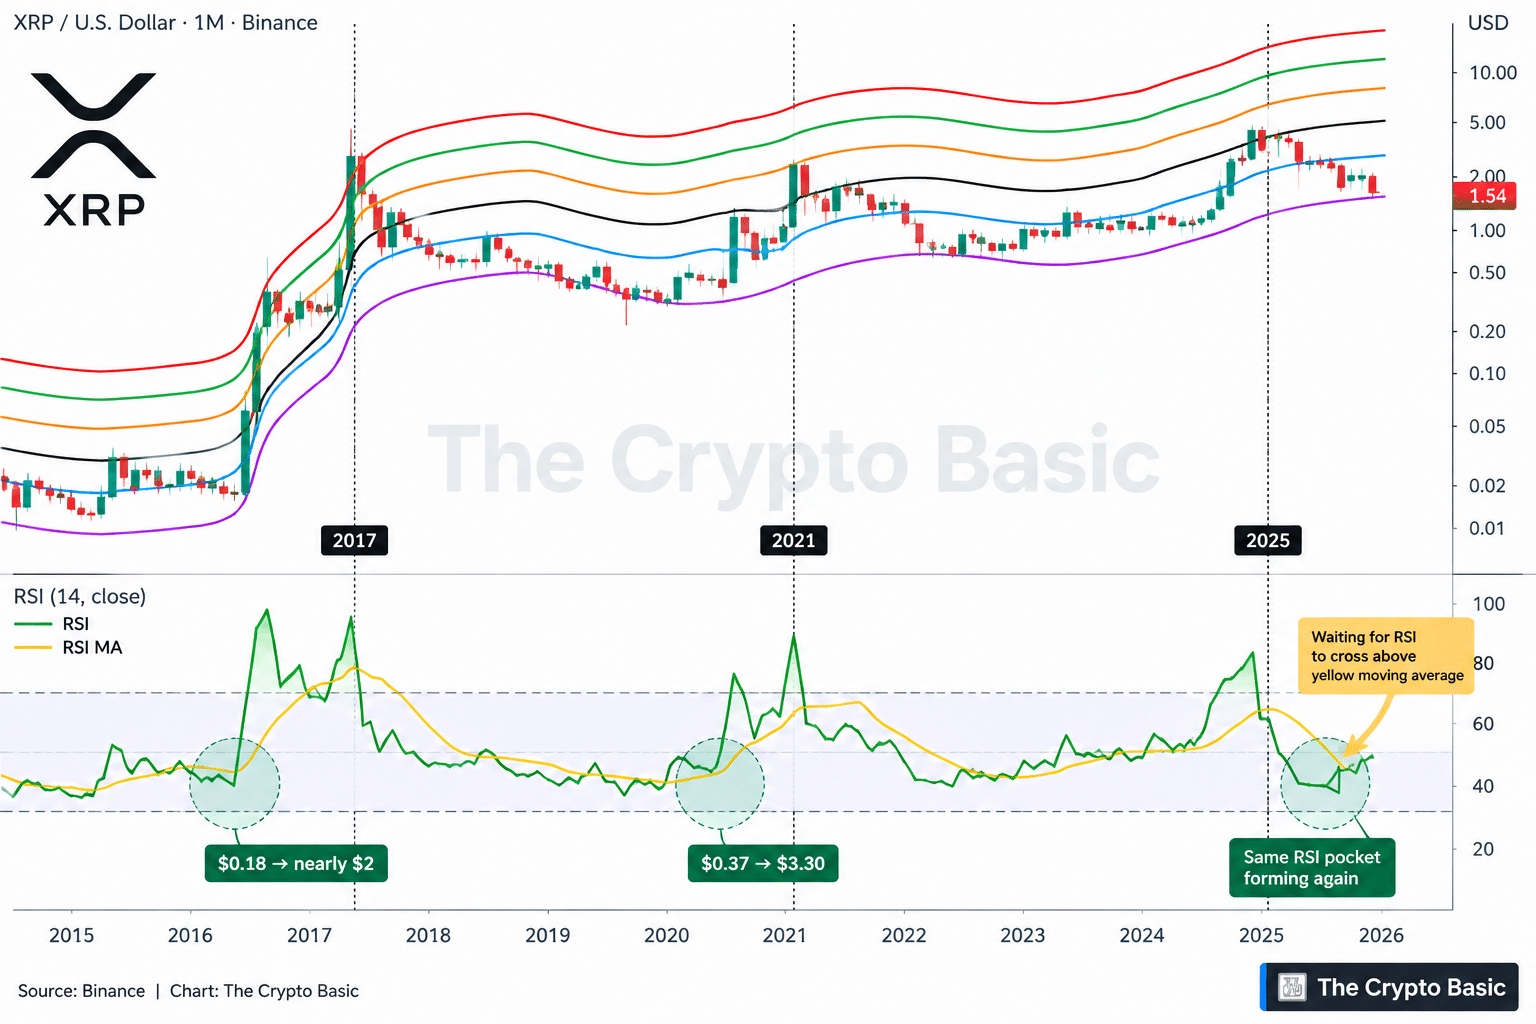
The XRP/USD monthly chart tracks the Relative Strength Index alongside a moving average of the indicator. The current RSI reading has fallen into a lower range that previously appeared during major corrective phases, while the RSI remains below its yellow moving-average line.
The key condition being monitored is a monthly RSI crossover back above that moving average. Until that occurs, the historical comparison remains incomplete.
Previous RSI Setups Preceded Major XRP Advances
The chart highlights earlier periods in which XRP’s monthly RSI dropped into a comparable zone before recovering.
During one previous cycle, XRP traded near $0.18 before later advancing to almost $2. A separate setup occurred when XRP was around $0.37, followed by an eventual move toward approximately $3.30.
In both cases, the RSI first declined into the lower highlighted region before turning higher. The green RSI line subsequently crossed or recovered above its yellow moving average as momentum improved.
The current configuration shows XRP’s RSI again positioned in that lower historical range. However, the green RSI line has only started to turn upward and remains below the yellow moving average on the monthly timeframe.
That difference is significant because the chart’s proposed confirmation condition has not yet occurred.
Using XRP’s current price near $1.54, the two historical scenarios would look like this:
- $0.18 → $2.00: about an 11.11× move, or roughly +1,011%. Applied to $1.54, XRP would reach approximately $17.11.
- $0.37 → $3.30: about an 8.92× move, or roughly +792%. Applied to $1.54, XRP would reach approximately $13.74.
These figures are mathematical comparisons with previous rallies, not price forecasts.
XRP Price Also Remains Inside Its Broader Monthly Structure
The price panel shows XRP trading within a set of long-term moving-average bands following its latest pullback from the 2025 advance.
The chart marks comparable periods around 2017, 2021 and 2025, showing how XRP has previously moved through extended consolidation and correction phases while momentum reset on the monthly RSI.
The present setup does not establish that XRP will repeat the magnitude of earlier rallies. The historical moves began from different prices, occurred under different market conditions and unfolded over different periods.
For the current pattern, the next technical development is straightforward: the monthly RSI would need to cross back above its moving average to reproduce the confirmation seen in the earlier examples.
Until that crossover occurs, the setup remains a historical comparison rather than a completed momentum signal.