




XRP is at an important juncture, and analyst Casi Trades says its next move will determine whether the coin continues rising or falls further.
According to her analysis, $0.98 is the key price level to watch. If XRP stays above this level, its chances of starting a new upward trend remain strong. On the other hand, the bearish scenario would unfold if XRP drops below $0.98, extending its correction and pushing the price down to $0.87.
XRP Elliott Wave Analysis Highlights Critical Price Levels
Casi shared an Elliott Wave chart on X showing XRP trading around $1.19 after losing 10% in a single day. She warned that the coin was running out of time to maintain its current position as selling pressure increased in the market.
Her latest chart outlines two possible scenarios for XRP’s longer-term price action.
The orange projection represents the bullish scenario, in which XRP maintains its previous low of $0.98. Notably, the coin reached this level in August. Holding above this level would leave room for a recovery and preserve the analyst’s bullish outlook.
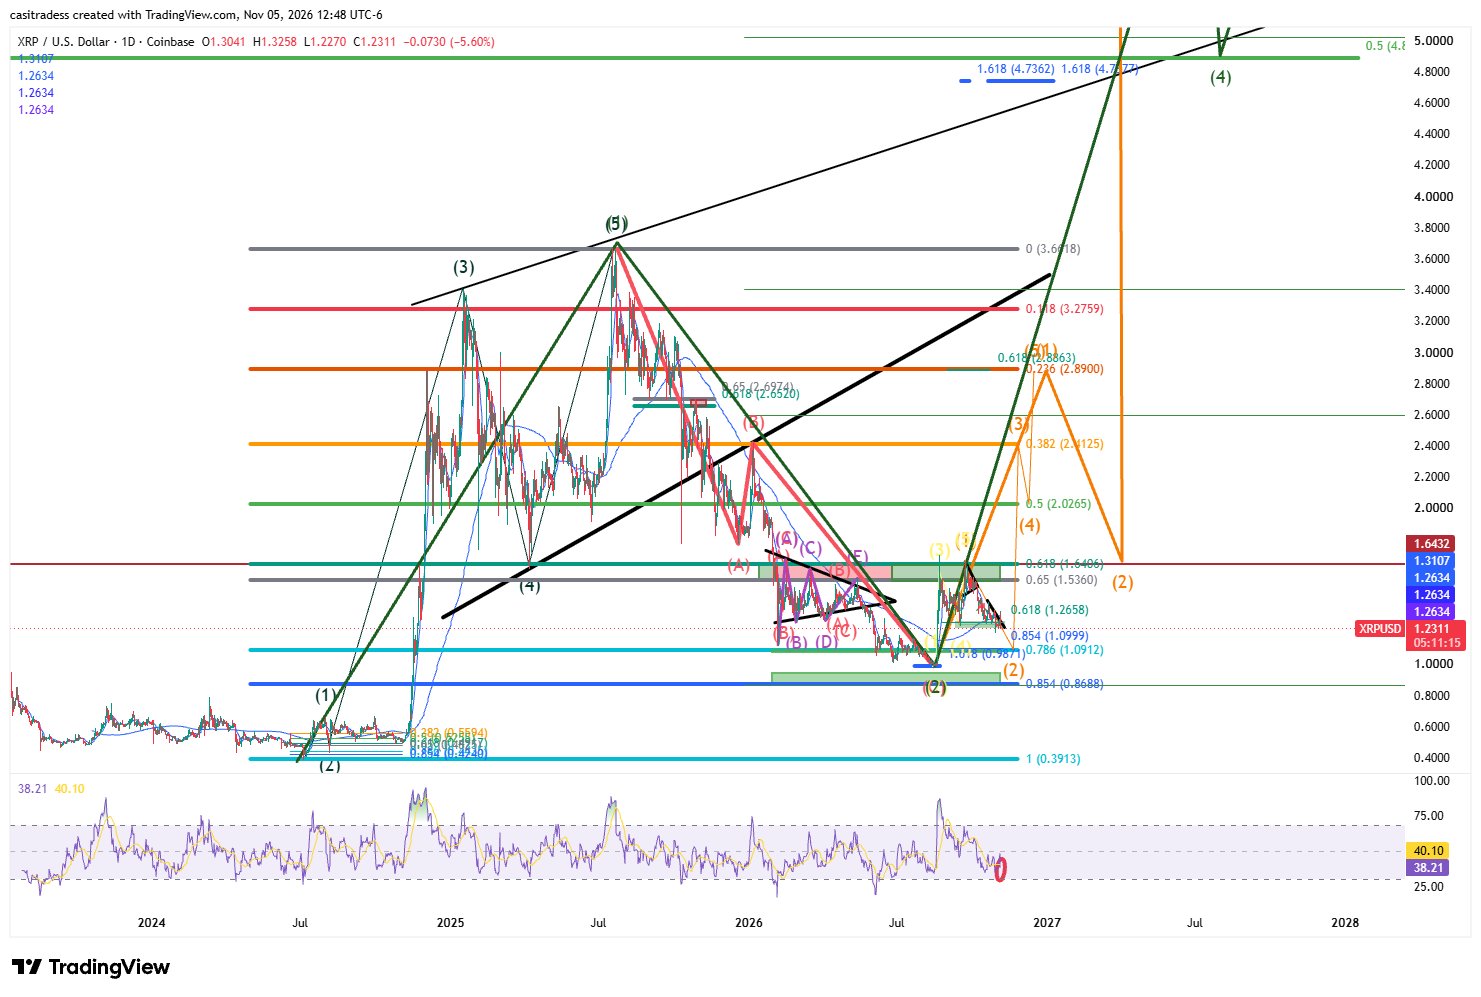
Conversely, the green projection illustrates the bearish scenario. If XRP establishes a new low below $0.98, Casi expects the macro Wave 2 correction to extend toward $0.87.
The chart also identifies several intermediate Fibonacci levels, including approximately $1.09–$1.10, $1.26, $1.53, and $1.64. These levels could provide additional reference points as XRP navigates its ongoing correction.
Casi emphasized the importance of these indicators, explaining that every Fibonacci level on her chart serves a purpose.
“Yes, every single fib line is important, or I would not have it on the chart,” she added.
XRP $4.70–$5.00 Price targets if Bullish Structure Holds
Beyond the immediate correction, Casi’s macro chart outlines significantly higher price projections if XRP maintains its bullish Elliott Wave structure.
The upside Fibonacci extensions include potential targets between $2.89 and $3.28. Further projections extend toward approximately $4.70–$5.00, with the possibility of even higher levels.
These projections depend on XRP completing its correction without invalidating the bullish wave structure.
Casi’s latest assessment also builds on her earlier warning that XRP could revisit $1.10 before completing its Wave 2 correction. She previously identified $1.125 as a possible temporary stopping point and noted that bullish RSI divergence near the lower target could help confirm a potential bottom.
Analyst Eyes $27 Target Based on Historical Cycles
In a separate analysis, ChartNerd urged investors not to panic over the recent decline. He encouraged them to learn from previous buying decisions and consider the dip an opportunity to lower their average entry price.
In particular, ChartNerd projected a bold double-digit price for XRP by comparing its long-term chart across previous market cycles. The chart highlights three major bullish cycles:
- 2017–2018: XRP soared 111,098% before correcting by 97%.
- 2020–2021: The token surged 1,674%, then fell 86%.
- 2022–2025: XRP rallied 1,202% before dropping 72%.
Based on Fibonacci extensions, ChartNerd identified long-term price targets of $8.4, $13.60, and $27, corresponding to the 1.272, 1.414, and 1.618 extension levels, respectively. From its current level, XRP would need to climb 550% to reach $8.4 and 2,100% to reach $27.
While promising, this outlook depends on the overall market entering a bull season, and these price targets could take several years to materialize.