Home Blog Page 1021

Dogecoin Holds Key Support at $0.33: Will Bulls Push Prices to $0.40?

With a stand-off at $0.33, technical indicators suggest that Dogecoin may be poised for a reversal. Is a price recovery possible for DOGE amidst a declining crypto market?

As Bitcoin drops to $92K, the meme coin segment has fallen below a $100 billion market cap. Dogecoin, down by 3.33% in the past 24 hours, has experienced a 4.08% drop overall.

With a market cap of $50 billion, Dogecoin continues to dominate more than 50% of its segment. However, the recent surge in supply has raised concerns among its holders.

Dogecoin Price Analysis

On the 4-hour chart, Dogecoin’s price action shows a failed attempt to maintain above the 61.80% Fibonacci level at $0.37772, followed by a minor consolidation phase that lasted for a few days.

Dogecoin Price Chart

However, with the broader market correction, Dogecoin fell after failing to break through the psychological resistance at $0.40. This correction led to a 24-hour low at $0.32417.

Despite this, the underlying support from the 38.20% Fibonacci level at $0.33030 prevented a strong bearish close, leading to a brief consolidation. As of now, Dogecoin is priced at $0.33957.

The sudden surge in supply caused a bearish crossover between the 20- and 50-period EMA lines. However, the 4-hour RSI is moving sideways above the oversold boundary, signaling a bullish divergence. This suggests that a potential rebound for Dogecoin is still possible.

With Blood in the Streets, Is It Time to Buy?

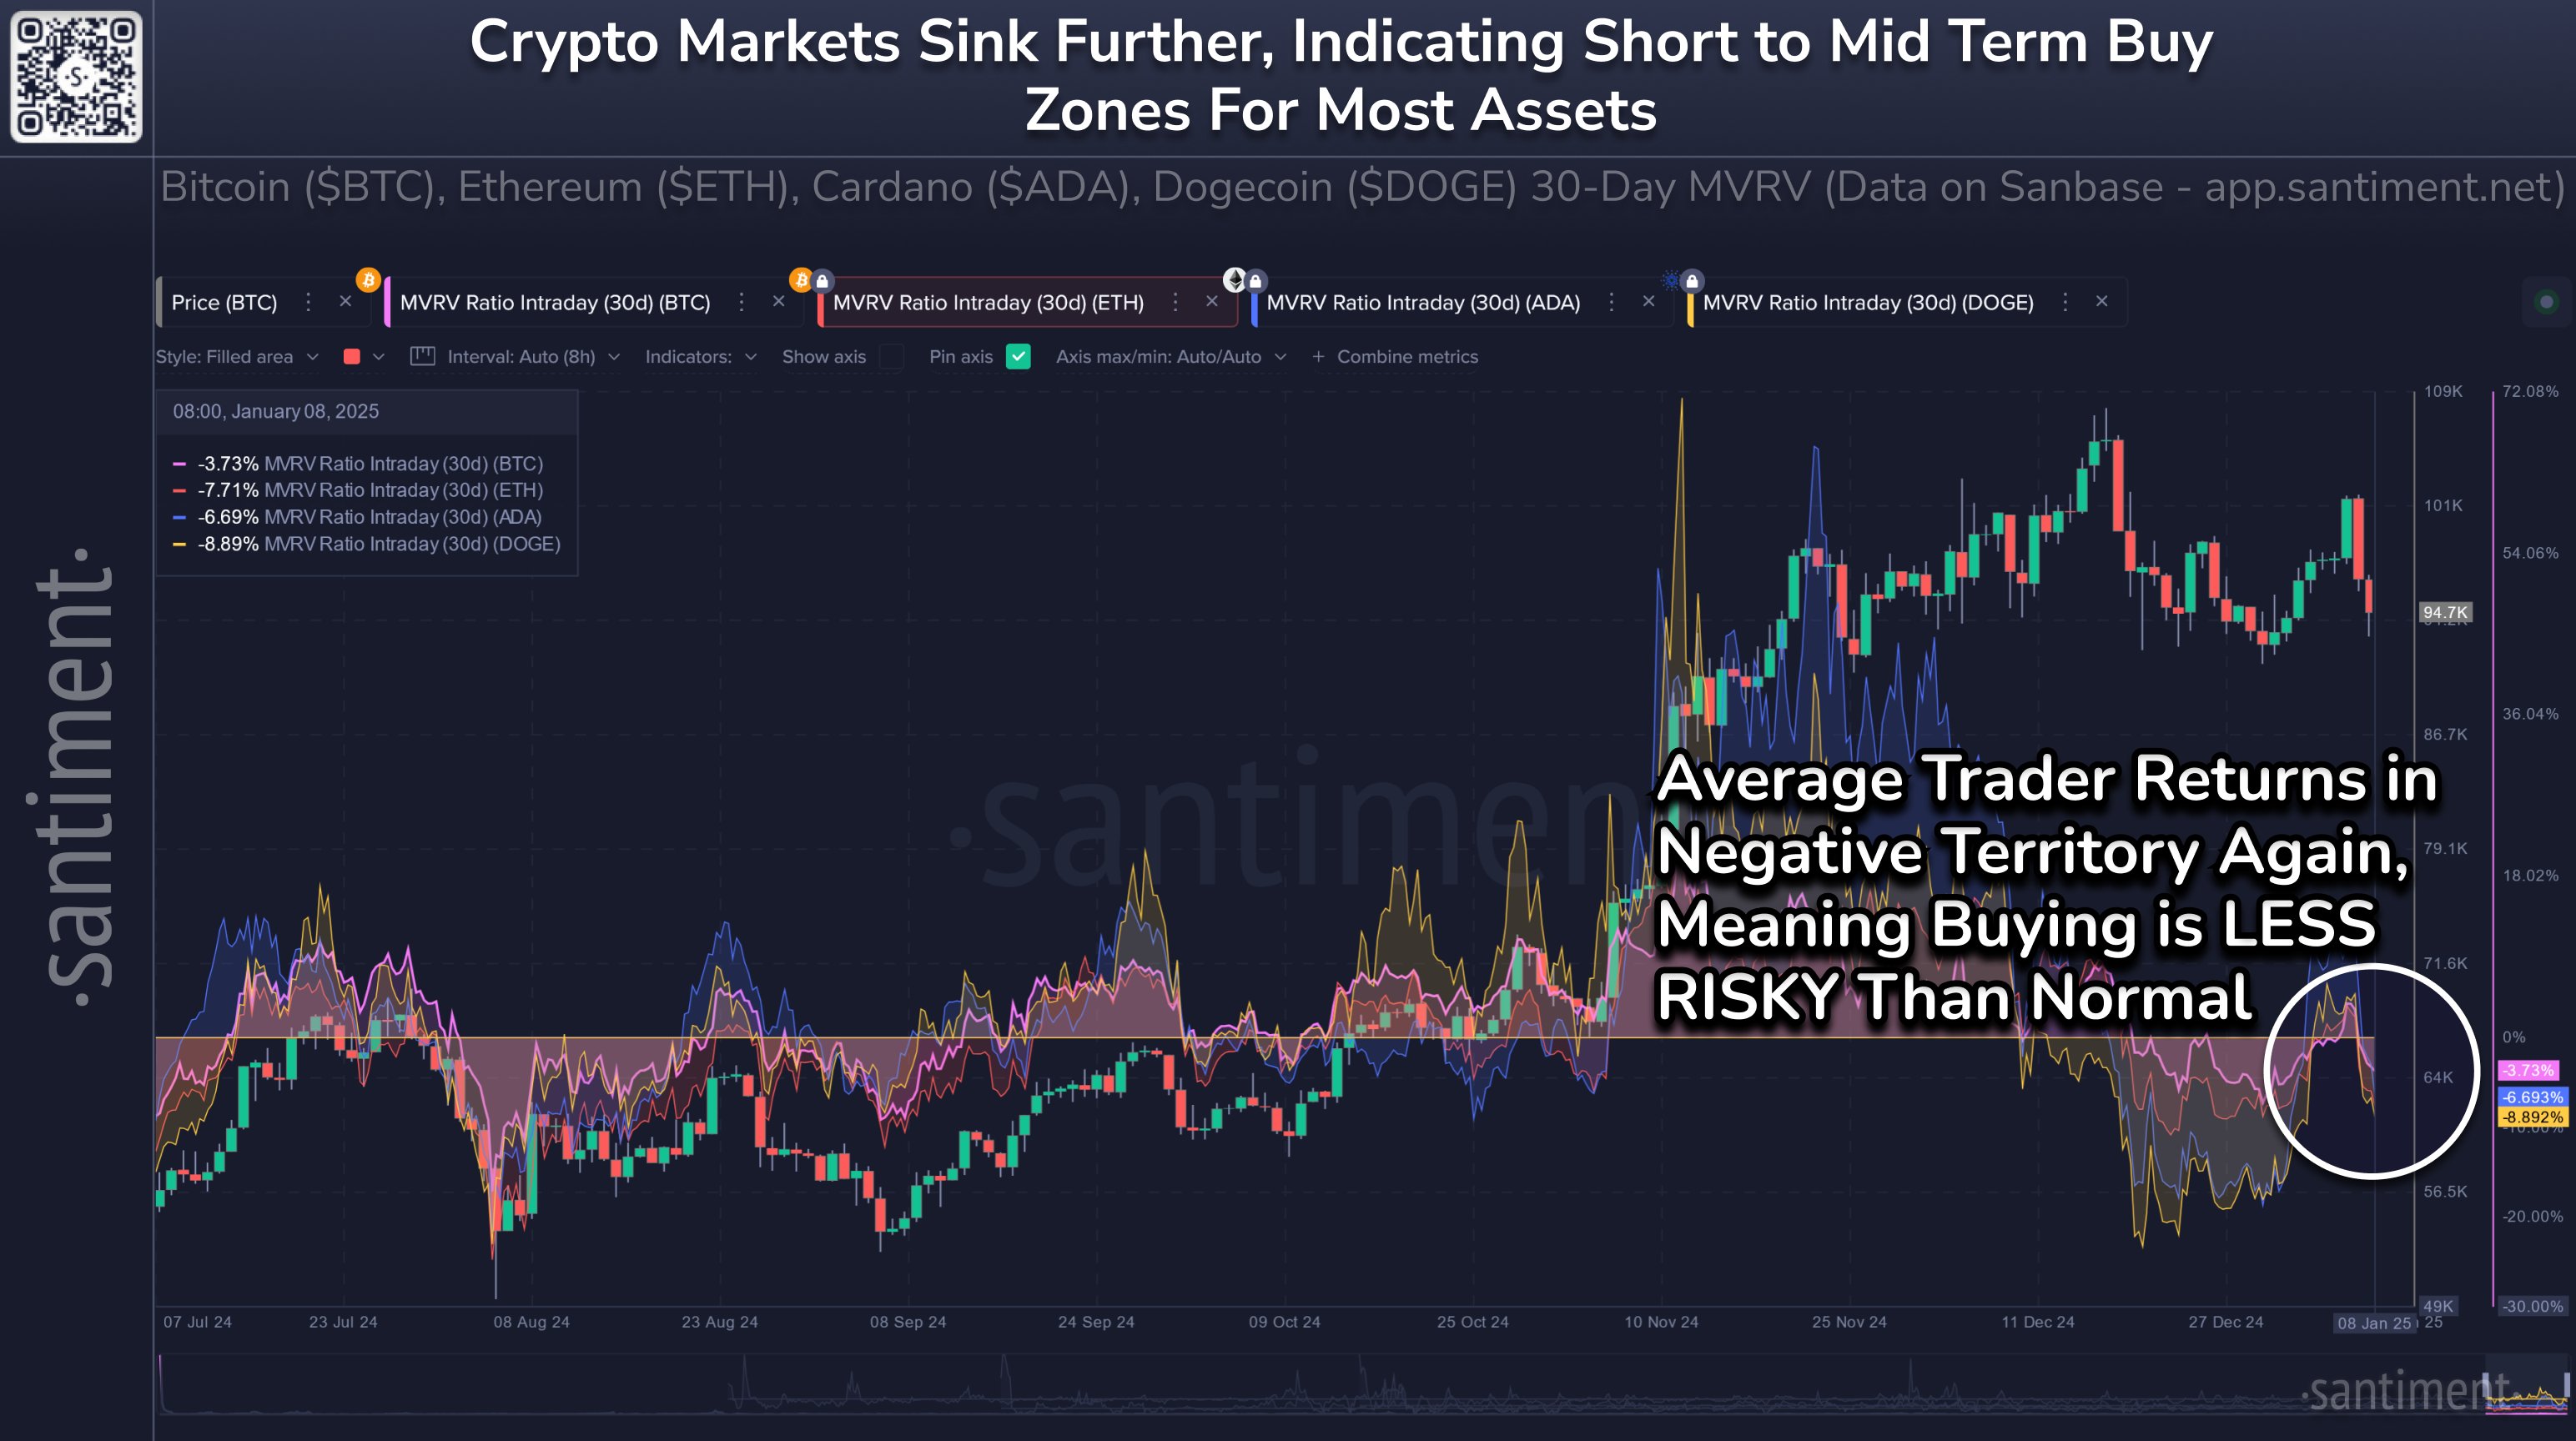
According to a recent tweet by Santiment, the average trading returns for Dogecoin are currently negative. This indicates that wallets active over the past 30 days are showing losses, and the MVRV (Market Value to Realized Value) ratio has turned negative.

This could present a potential buying opportunity, with “blood on the streets.” Dogecoin’s MVRV ratio is at -8.892%, significantly higher than Bitcoin’s at -3.73% and Cardano’s at -6.693%.
Image

DOGE Price Target

With the bullish divergence in the RSI and the likelihood of professional traders entering the market to capitalize on discounted prices, Dogecoin could experience a minor rebound. The immediate resistance is near the 50% Fibonacci level and the 200 EMA at $0.35.

Beyond that, the bullish trend could face significant resistance around the psychological $0.40 mark. On the other hand, a bearish trend could revisit the crucial support zone around $0.30.
Analyst Says XRP Looks Very Strong, Cites Chart Pattern to Send to $9

0

Crypto analyst Matt Hughes recently pointed out a notable development in XRP price action, suggesting the potential for a 3X price rally anytime soon.

In a Wednesday tweet, Hughes highlighted XRP’s resilience amid the ongoing bearish market. According to him, XRP remains one of the few coins that has not even touched the daily Ichimoku Cloud yet.

The development emphasizes the asset’s strength as it maintains a firm position above key support levels.

XRP Resilience Amid Downturn, Ready for $9 Run

During Wednesday’s bearish market storm, XRP’s price crashed to $2.20. Considering its January high of $2.504, the dip represented a loss of 11.6%.

Meanwhile, during the same timeframe, the altcoin king Ethereum lost 14.2% of its value, and Solana dropped by 15.25%. Leading meme coins like Dogecoin fared even worse, plummeting by 18% from $0.398 to $0.3268.

Hughes interpreted XRP’s lower price slump as an incredibly bullish signal, suggesting the coin is ready for a major bounce. He had expected XRP to breach into the Ichimoku Cloud to retest some of its December lows, but that did not happen.

Image
XRP chart showing price action around Ichimoku Cloud

Essentially, XRP’s ability to stay well above the cloud is now seen as a sign of strong bullish momentum.

In the accompanying chart, XRP’s price of $2.31 (at the time of analysis) seems far from testing the Ichimoku Cloud—a scenario many traders would expect during corrections. Interestingly, XRP is even maintaining this value at press time.

Now, XRP is showing stronger resilience than Bitcoin. In particular, Bitcoin is trading with a 2.6% dip at $93,500 at press time, while XRP is at $2.32 with only a 0.54% decline.

Hughes interprets this as a sign of heightened market confidence. Accordingly, he boldly expressed that XRP could be ready for a breakout run to $9 in the near term. Notably, attaining $9 would represent a significant 288% price growth from current levels.

Similar Bold Projection from Veteran Analyst

This price projection aligns closely with the suggestions of Peter Brandt, a veteran market analyst. In a recent update, Brandt argued that XRP could reach a $500 billion market cap, driven by the formation of a “half-mast flag” pattern on its weekly chart. 

This consolidation follows a major rally in December 2024, when XRP peaked at a $165 billion market cap.

Brandt believes that if the flag pattern completes, XRP’s market cap could triple from its current level, pushing its price to $8.74 per token. However, he cautions that the pattern needs to break out within six weeks to maintain its bullish potential.

Expert Reveals Key Shiba Inu Long Entry Zone, Targets Massive Rebound to $0.00004170

0

A TradingView analysis has identified a key Shiba Inu accumulation zone, with upside targets of up to $0.00004170.

Shiba Inu (SHIB) has mirrored the broader market’s bearish trend, with notable declines over the past few days. As of today, SHIB is trading at $0.00002096, with a 24-hour trading volume of $550,146,631.

This price represents a 3.89% drop in the last 24 hours and a cumulative loss of 5.33% over the past week. The downturn is indicative of sustained selling pressure across the market.

However, key accumulation trends and a well-defined long entry zone suggest that recovery may be on the horizon.

Favorable Shiba Inu Accumulation Zone Amid Bearish Market

Amid the recent decline, an analyst on TradingView identified critical Fibonacci levels that point to an accumulation phase for SHIB. The analysis focused on Shiba Inu’s price action in the 2-day timeframe.

Specifically, the analyst noted that Shiba Inu is pulling back within its upward trend channel, nearing the critical long entry zone at approximately $0.0000162.

This price point coincides with the lower boundary of an ascending channel. The analyst sees it as a significant accumulation point should the bears drive the SHIB price lower.

Shiba Inu 2-day Price Chart

Upside Targets to SHIB

Accordingly, the analysis outlines possible price targets for SHIB after this accumulation phase. The first target is $0.00002800. Once Shiba Inu bulls overcome the above level, the second level to aim for is $0.00003500, which aligns with historical resistance zones.

Meanwhile, the third target is $0.00004170, a potential 98.10% increase from the current price. The analyst views the retracement as a healthy accumulation signal before a possible bullish trend resumes.

Long-Term Holders Dominate

Aligning with the TradingView observation, on-chain data from IntoTheBlock shows a consistent rise in SHIB’s long-term holders. The number of addresses holding SHIB for over a year has risen by 0.51%, now totaling approximately 950,000. 

Shiba Inu Addresses by Time Held Chart

In contrast, the number of short-term traders who held SHIB for less than a month has decreased by 35.11%. This decline reflects reduced speculative activity, further stabilizing the market.

Mid-term holders, categorized as addresses holding SHIB for 1 to 12 months, have grown by 19.98%. This resurgence suggests renewed interest among mid-term investors.

Historic Shiba Inu Accumulation Among Whales

Adding to the accumulation narrative, The Crypto Basic recently shared that Shiba Inu witnessed an extraordinary spike in large holder inflows, reaching a daily net flow of 33.59 trillion tokens on January 7, 2025.

This influx, valued at $739 million, accounted for approximately 5.7% of SHIB’s circulating supply, marking one of the highest accumulation events in the token’s history. 

Historically, daily inflows averaged around 600 billion SHIB throughout 2024, with a rare high of 24.79 trillion tokens in March 2024. The last comparable event occurred in July 2021, when large holders moved significant volumes due to lower market prices.

Market Analyst Says Ethereum Will Disappoint in This Cycle; Here’s His Maximum ETH Target

0

With the cryptocurrency bull market still on course, a seasoned analyst has asserted that Ethereum will disappoint this cycle.

The crypto market has entered the last year of its bull cycle, renowned for massive upsides and a possible peak. Altcoins have benefited from this bullish scenario, led by the sector’s leader, Ethereum.

Market expert Egrag Crypto has suggested that Ethereum will disappoint many this cycle. In a Wednesday post, he provided a detailed analysis of the asset’s expected performance, including price, market cap, and dominance peaks.

Market Cap and Price Prediction

Egrag dissected Ethereum’s market cap performance using Fibonacci levels in the past two cycles. He attached a chart clearly showing the levels and how he expects the altcoin king to trend this bull run.

Ethereum Market Cap

The market analyst noted that Ethereum’s market cap peaked around the 1.414 Fibonacci extension during the 2021 bull run. The altcoin’s valuation reached its zenith at $575.9 billion, leading to an all-time high of $4,867.

However, Egrag asserted that Ethereum may struggle to replicate such a Fibonacci extension high, predicting a most probable stop between 1.272 and 1.414. The levels would ensure the asset reaches a market cap ranging from $915 billion to $1.16 trillion.

Still, the analyst insisted that the altcoin king will struggle to break a $1 trillion market cap, citing diminishing returns. As a result, his best probable bet is a peak around the 1.272 extension.

Meanwhile, with a market of $915 billion and a circulating supply of 120.47 million, Ether will trade at $7,594 per coin, a 130% increment from the current market price. Moreover, Egrag stated that Ethereum’s best target would be 2.1x to 2.3x its current market price, reflecting a peak between $7,000 and $9,000.

Notably, the price prediction aligns closely with an analysis from Steno Research. The financial firm speculated that the altcoin king will hit $8,000 before the end of this year.

Market Dominance Outlook

Egrag also attached a dominance chart indicating Ethereum’s trend since 2018. The chart shows that the asset’s market dominance reached 26% in January 2018, and its all-time peak is 30.81%, attained a year earlier.

Ethereum Dominance

Furthermore, the market expert stated that Ethereum’s dominance will trade between the 0.5 and 0.702 Fib. levels, representing 15-20% precedence. However, he picked 0.702 as his expected target.

Using the analogy, he noted that if the cryptocurrency market reaches a total market cap of $5 trillion, Ethereum will reach $1 trillion (20%). This supports his assertion that Ethereum’s cap will trade around the level.

In the meantime, Ethereum continues its sideways movement, trading at $3,324 at the time of writing.

Donald Trump Transition Team Interviews Six Candidates for CFTC Chair Position

0

U.S. President-Elect Donald Trump’s transition team interviews at least half a dozen candidates to fill the chairmanship position of the CFTC. 

FOX Business Senior Correspondent Charles Gasparino revealed the development yesterday, highlighting a significant potential shift for the crypto industry under Trump’s administration.

Gasparino expects the Commodities Futures and Trading Commission (CFTC) to play a major role in crypto regulation in the upcoming administration. 

Why CFTC Might Become Crypto Top Cop 

It is worth mentioning that the SEC is currently the leading regulator for the crypto industry under the Biden administration. However, the SEC, especially its chair Gary Gensler, has been accused of favoring regulation by enforcement over regulatory clarity. 

According to Gasparino, the CFTC is more of a regulator than an enforcement arm. Its approach aligns with Trump’s broader goal of reducing the regulatory burden the Gensler-led SEC has imposed on the industry. 

Candidates for CFTC Chair Position 

Per Gasparino, Trump’s transition team has already vetted at least half a dozen candidates to replace Rostin Behnam, the current CFTC Chair. However, he provided the names of five candidates. 

They include Brian Quintez, Head of Crypto Policy at Andreessen Horowitz; CFTC Commissioner Caroline Pham; former Kraken CLO Marco Santori; Milbank LLP Partner Josh Sterling; and Neal Kumar, partner at Willkie Farr & Gallagher. 

Of the candidates vetted by Trump’s transition team, Gasparino highlighted Quintez as a strong contender due to his expertise in crypto and AI. 

“I’ll put my money on Mr. Quintez,” the FOX Business Senior Correspondent remarked. 

Trump to Prioritize Crypto Regulation 

As indicated during the campaign, the Trump administration aims to prioritize crypto regulation. So far, he has appointed several pro-crypto advocates to top positions, including the SEC and Treasury Secretary. 

Trump also made history last year by appointing a White House AI & Crypto Czar in the person of David O. Sacks. The CFTC is expected to become the top regulator for the crypto industry under Trump, potentially creating a regulatory-friendly environment for the sector. 

Last year, the U.S. House of Representatives passed the FIT21 Act to give the CFTC more regulatory control over the crypto industry. The Senate has yet to decide whether to support the bill.

In the meantime, the United States Congress is committed to prioritizing crypto regulation this year, with the FIT21 Act emerging as a key focus. 

Average Dogecoin Trader Returns in the Red Amid Market Struggles

0

Dogecoin (DOGE) traders see negative returns amid latest market slump, but Santiment analysts believe this might be the opportune time to buy.

Amid macroeconomic headwinds, crypto asset prices have struggled in recent weeks, and even traders of the popular light-hearted doggy-themed crypto Dogecoin (DOGE) have not been able to escape the rut as has been recently highlighted by crypto analytics platform Santiment.

Dogecoin (DOGE) Traders See Red

The average returns of Dogecoin (DOGE) traders are back in the red. This is according to Santiment data shared on Wednesday, January 8.

Per the data, the average returns of DOGE traders have fallen sharply from highs of about 72% in November 2024 to a negative 8.89% as of Wednesday. The firm deduced this using the intraday market value to realized value ratio (MVRV) over the past 30 days.

The MVRV measures the difference between an asset’s price and the average price at which coins were last moved, presenting insights into the profitability of holders.

Chart showing average trader returns for BTC ETH ADA and DOGE
Chart showing average trader returns for BTC ETH ADA and DOGE. Source: Santiment Feed

Meanwhile, DOGE traders are not the only ones to experience this decline in average returns. The data also shows that the average return for Bitcoin, Ethereum, and Cardano traders is also in the red at -3.73%, -7.71%, and -6.69%, respectively.

The data comes on the heels of a market slump this week sparked by U.S. economic data suggesting that the Federal Reserve is unlikely to be in any hurry to continue its interest rate cut regime. DOGE, in particular, has seen a nearly 19% drop from highs of $0.39831 on Tuesday to lows of $0.32444 on Wednesday.

Still, Santiment Feed has suggested that the recent decline in returns could present an opportunity for traders.

Not a Time to Panic?

Analysts at Santiment believe the recent decline in returns for DOGE traders may not be a time to panic but rather search for opportunity.

The firm argued that it was “less risky” to buy when average returns for traders are in the red. It highlighted that times like these were when most pro-traders made their money, citing the famous Nathan Rothschild quote, “The time to buy is when there’s blood in the streets.”

Santiment Feed suggests that this could be a good play for traders as it anticipates a short to medium-term recovery for crypto assets. Still, the firm warned that, as with most things, there was no guarantee.

Market Veteran Identifies Next Bitcoin Support Level to Watch as BTC Hits $92K

0

Market analyst Ali Martinez calls attention to the critical Bitcoin support level to watch as BTC battles bearish pressure.

Bitcoin’s recent slide below $100,000 has raised concerns about the asset’s near-term trajectory. Following its climb to $102,278 on Jan. 7, BTC quickly reversed, shedding over 5% in a single day. It now trades at $92K, struggling to regain momentum. 

Bitcoin Slumps to $92K

This sharp decline came after U.S. labor market data hinted at fewer interest rate cuts in 2025, dampening investor sentiment. Amid this bearish pressure, market analyst Ali Martinez has outlined major levels and patterns that could shape Bitcoin’s outlook.  

In an analysis, Martinez pointed out that Bitcoin initially invalidated a bearish head-and-shoulders pattern by breaking through its right shoulder. 

However, the reversal on Jan. 7 erased those gains, pushing Bitcoin back below the pattern’s neckline. Discouragingly, this reactivation of bearish sentiment has unsettled the market, with investors eyeing crucial support zones.  

Martinez called attention to the $95,400–$98,400 range as a significant demand zone where about 1.77 million addresses acquired 1.53 million BTC. As Bitcoin dips below this area, these investors could face mounting pressure to sell, potentially amplifying the downside. 

Notably, this materialized yesterday, Jan. 8, with Bitcoin closing the day at $95,065 amid a 1.94% drop. BTC now changes hands at $92,951. Martinez warns that a further slide below $92,000 could lead to a sharper decline, with Bitcoin facing minimal support until it reaches $74,000.  

Interestingly, the market analyst had previously highlighted the possibility of this $70,000 level, citing bearish commentaries from multiple market veterans in a report late last month.

Bitcoin’s Current Position

According to him, the current conditions also show broader macroeconomic fears. The combination of weaker rate cut expectations, and the loss of critical technical levels has triggered concerns about a deeper market correction. 

Notably, if selling pressure accelerates, Bitcoin could soon enter a phase of pronounced volatility. Despite the bearish macro setup, Martinez sees short-term opportunities for a potential rebound. 

On Bitcoin’s four-hour chart, the TD Sequential indicator flashed a buy signal. This suggests that a bounce toward $98,600 could occur as market participants seek to capitalize on this liquidity zone. 

Martinez noted that $98,600 represents a $35 million liquidation area that could entice market makers to trigger a brief rally. Nonetheless, traders should approach such a rebound with caution, as it may only provide temporary relief. 

The analyst stressed that a drop below $92,000 would likely negate any short-term recovery. The lack of support between $92,000 and $74,000 could trigger a more substantial downturn. However, if Bitcoin were to reclaim $100K, this would invalidate the bearish trend.

Cardano Founder Reveals What’s Next for Hydra After Doom

0

Cardano founder Charles Hoskinson reveals what is next for Hydra after Doom.

Amid crypto’s quest for mass adoption, blockchains are increasingly trying to improve scalability. Among the chains moving the needle in this regard is Cardano.

In December 2024, the network gained significant recognition by shattering the maximum theoretical transactions per second (TPS) record as it showcased the capabilities of its scalability protocol Hydra through a Doom gaming test.

Now, Cardano founder Charles Hoskinson has offered insights on what’s next for Hydra after Doom.

Hydra Coming to Real Applications

In a video shared with followers on Wednesday, January 8, Hoskinson disclosed that while Doom offered a great way to showcase Hydra’s capabilities, the gaming tournament would come to a close on January 20.

With the end of Doom, Hoskinson reveals that the goal will be to get Hydra integrated into Layer 2 protocols like Anastasia Labs’ Midgard and Sundae Labs’ Gummiworm. From here, the hope is to get Hydra’s capabilities integrated into real applications, including DeFi, payments and gaming experiences.

Interestingly, Hoskinson notes that Anastasia Labs and Sundae Labs have already kicked off work in this regard, with developments around their own Hydra infrastructure.

The Cardano founder noted that there are also plans to initiate a three to six-month research and development collaboration effort between these firms and Input Output, the blockchain’s primary developer.

Meanwhile, Hoskinson contended that there is still lots of work to be done, including unlocking communication between Hydra Heads, which refer to instances of the protocol, integrating zero-knowledge technology, and building out the Hydra Tail protocol. He stressed that the goal was to keep improving Hydra year after year and not to hit some lofty threshold.

What You Need To Know About Hydra Doom

Hydra Doom was a Cardano initiative designed to test its scaling protocol at the extreme using a multiplayer first-person shooter game where every frame represented a transaction, and players were incentivized to deploy multiple Hydra Heads.

In December 2024, this culminated in Cardano recording over 1 million TPS, the highest of any blockchain by far. For context, Chainspect data shows Internet Computer (ICP) as having the highest maximum theoretical TPS with a record near 210,000. Aptos and Solana come second and third with records of 160,000 and 65,000, respectively.

It will be worth watching to see whether Cardano will be able to raise the bar even higher as the Doom tournament continues.

This is Not the Time to Short or Sell Your Dogecoin: Expert Analyst

0

Despite Dogecoin joining the broader crypto market downturn, a notable analyst has advised against selling or shorting the meme coin alpha.

The doggy-themed meme coin started the week bullish, surging to an intra-week high of $0.3989. However, the token has retraced over 12% from this peak and almost relinquished last week’s gains despite speculation that it would soon outdo Bitcoin and XRP.

Meanwhile, analyst Trader Tardigrade argues that the dip is not a sell signal. In a recent analysis, he recommended that traders do not sell or short Dogecoin, as the correction is part of a greater bullish picture.

Dogecoin Retesting Ascending Triangle’s Apex

Trader Tardigrade insinuated that Dogecoin’s retracement is still part of its bullish plans. He shared in a tweet that the largest meme coin by market cap was simply retesting the apex of its ascending triangle.

An accompanying chart to the analysis shows that Dogecoin broke out of the bullish ascending triangle with a price upswing past the structure’s base at $0.3435 on January 3. The leading meme coin’s bullish momentum endured until it lost steam at $0.3989 four days later. 

Dogecoin Ascending Triangle

Meanwhile, the chart shows a potential rebound from the current area to unprecedented heights. Dogecoin will target a 182% push past its current all-time high of $0.7488 to areas around $0.9500.

Crucial Support for Dogecoin

Analyst Crypto Zeinab shares a similar stance with Trader Tardigrade’s commentary. The seasoned market speculator noted in a January 8 tweet that Dogecoin has reached crucial support.

Per an accompanying chart, the support zone lies around the base of Trader Tardigrade’s ascending triangle. Meanwhile, Zeinab asserted that Dogecoin could rebound from the demand zone, with his chart showing a retest of the intra-month high at $0.3989.

Major Dogecoin Support

However, if Dogecoin loses the $0.3435 support level, the analyst expects the demand wall at the 0.618 Fibonacci extension to wedge against lower prices. Notably, the Fibonacci level lies at $0.2730, an area that cushioned Dogecoin’s December 20 capitulation.

In the meantime, Dogecoin trades at $0.3340, down 3% in the past day.

New York Judge Sets Trial Date for Terra Founder Do Kwon

0

New York District Judge Paul Engelmayer schedules the trial dates of Terra co-founder Do Kwon for late January 2026, with the proceeding expected to last up to eight weeks. 

The court issued the decision yesterday following Kwon’s second court appearance in a New York federal court, according to a Bloomberg report.

Yesterday’s proceeding flagged off the discovery phase of the highly anticipated lawsuit featuring Terra co-founder whose stablecoin, UST, lost its peg to the dollar in 2022, leading to a $40 billion wipeout. 

Kwon Trial to Begin in January 2026 

Notably, yesterday’s session was scheduled to determine whether the court would grant a settlement of the lawsuit without a trial. However, the court believes a trial is necessary, scheduling the proceeding for January 26, 2026. 

Judge Engelmayer approved the date following a request from Kwon’s lawyers, who asked for a year to prepare for the trial. The rationale behind the request is to give the Terra co-founder ample time to prepare for the proceeding due to his other legal woes outside the U.S. 

While granting the request, the judge stated that setting a trial date of more than a year after the initial conference has never been done before. Nonetheless, he granted the request, scheduling the date for January 26, 2026. 

Kwon’s Charges 

It is worth noting that Kwon is currently facing nine felony charges related to alleged fraud at his company, Terra. He pleaded not guilty to all charges in the hope of defending himself at trial. However, if found guilty, he could spend up to 130 years behind bars. 

For context, Kwon’s case revolves around allegations suggesting that he made false claims regarding the stability of the Terra system. Recall that the U.S. SEC introduced a lawsuit against him in 2023, alleging that he connived with another company, Jump Crypto, to help maintain UST’s peg before its ultimate collapse. 

According to the U.S. government, both litigants and litigators submitted six terabytes of evidence sourced from phones and social media accounts. 

Upcoming Trial 

Of the eight weeks the trial is expected to take, Kwon’s prosecution will take four weeks. Ahead of the trial, Judge Engelmayer requested clarity on behalf of the jury to determine whether securities laws would impact the proceeding. 

He referenced the lawsuit between the SEC and Kwon, in which Judge Jed Rakoff ordered the defendant to pay a fine of $4.5 billion for violating federal securities law. 

It is worth mentioning that Kwon is also facing criminal charges in South Korea. After Montenegro authorities arrested Kwon, both South Korea and the United States were embroiled in a fierce legal tussle over his extradition. Last month, Montenegro finally approved the U.S. request to extradite Kwon.