Home Blog Page 1040

Bitcoin Analysis: Bearish Trendline in Focus as Bulls Eye $95,119

Will the Bitcoin (BTC) price sustain above $90K as the resistance trendline dominates the price chart?

Bitcoin’s price faces bearish pressure, with a breakdown below $93,000, marking a 1.12% drop in the past 24 hours. The CMC Fear and Greed Index has declined to 48, reflecting growing uncertainty among investors.

As BTC struggles to surpass key resistance levels, technical indicators suggest potential downside risks, while analysts remain divided on the possibility of a bullish rebound.

Bitcoin Price Analysis

Respecting the long-coming resistance trend line in the 4-hour chart, the BTC price continues a bearish trend. As expected in our last article, the crucial support level at $92,750 failed to absorb the incoming supply. 

The breakdown rally almost reached the $90,000 level as predicted, making a low of $91,315. With the lower price rejections, the BTC price experienced an early reversal from the estimated target of $90,742.

However, the bullish recovery to $92,748 failed to surpass the 20-EMA line and the resistance trendline. This led to a quick pullback below the $93,000 mark.

BITSTAMP:BTCUSD Chart Image by Trojan69420

Currently, Bitcoin is trading at $92,748, with a minor recovery of 0.43% in the past 4 hours. The 4-hour RSI line shows a quick turnaround from the oversold region, suggesting a possibility of sideways continuation.

The consolidation range is expected to respect the $90,742 support zone while struggling to break through the resistance trendline.

Fidelity Leads the Outflow Pack on December 30

As the market experiences a pullback, institutional support for Bitcoin declines. On December 30, the daily total net inflow of the U.S. spot Bitcoin ETF registered an outflow of $426.13 million.

Bitcoin ETFs
Bitcoin ETFs

Leading the bearish pack, Fidelity saw an outflow of $154.64 million, followed by Grayscale with an exit of $134.5 million.

BTC Price Targets

With the new year on the horizon, growing bullish anticipation may push Bitcoin above the resistance trendline.

In this case, the BTC price could reach the immediate resistance level of $95,119. This is extremely close to the dynamic average line of the 50-EMA.

On a side note, the 50-EMA has generated a death cross with the 200-EMA, signaling a potential sell-off. Furthermore, the declining 100-EMA is approaching the 200-EMA for another bearish crossover event.

On the bearish front, a breakdown below $90,742 would open the door to the next support level at $86,707.

Analyst Lights Hope for 2025

Despite multiple sell signals, independent analyst Ali Martinez has highlighted a massive potential for growth in Bitcoin.

Finding a correlation between the monthly RSI in previous market peaks and the Bitcoin Liquid Index, Martinez expects the BTC price trend to continue its bullish trajectory.

In previous bull market peaks, the monthly RSI reached 92 before the start of the next bear market. Currently, the monthly RSI line sits at 75, suggesting that the ongoing bull run has more fuel left than the bears anticipate.

Ali comment on Bitcoin RSI
Ali’s comment on Bitcoin RSI

Conclusion

The Bitcoin (BTC) price trend struggles under bearish pressure as technical indicators like the death cross and declining EMAs signal a continued downtrend.

However, with RSI recovering from oversold levels and analysts suggesting more room for growth, a bullish breakout remains possible, targeting the $95,119 resistance level.

Galaxy Research Predicts Bitcoin To Hit $185,000, Ethereum $5,500, and Dogecoin $1 in 2025

0

Leading crypto assets Bitcoin, Ethereum, and Dogecoin feature prominently as analysts at Galaxy Research present their 2025 forecasts for the market.

As 2024 draws to a close, all eyes look to 2025 and what it may hold. For the crypto market, the big question has been whether it would be able to sustain its impressive 2024 showing, particularly in Q4, in 2025.

These lingering questions have led to a flurry of predictions from analysts and researchers, with the latest one coming from Galaxy Research.

In this article, The Crypto Basic takes a look at Galaxy Research’s 2025 crypto predictions with a focus on Bitcoin (BTC), the largest crypto asset by market cap, Ethereum (ETH), the second-largest crypto by market cap, widely regarded as the “DeFi King,” and Dogecoin (DOGE), the largest meme coin by market cap.

Here’s how Galaxy Research sees BTC, ETH, and DOGE performing in 2025.

Bitcoin (BTC)

Galaxy Research expressed confidence that Bitcoin will continue its impressive run in 2025. The firm disclosed that it expects BTC to hit the $150,000 price point in the first half of 2025 and $185,000 in Q4, driven by continued adoption.

For one, Galaxy Research believes the rapid uptake of spot Bitcoin ETFs will continue in 2025, tipping the assets under management in the investment vehicles to more than double from about $120 billion to $250 billion in 2025.

At the same time, Galaxy Research expects continued adoption of the Bitcoin treasury model by more firms and countries. The firm believes at least five Nasdaq 100 companies and five countries will add the leading digital asset to their balance sheet in the new year.

Further, Galaxy Research anticipates a Bitcoin DeFi boom in 2025, tipping the amount of coins locked in smart contracts and staking protocols to double.

Amid all these factors, the firm asserts that Bitcoin will again be a top performer among global assets on a risk-adjusted basis in 2025.

Ethereum (ETH)

Ethereum will shake recent doldrums over the past two years to trade at new all-time highs in 2025, according to Galaxy Research. Specifically, the crypto research firm has tipped the asset to trade at new highs above the $5,500 price point in 2025.

For context, the asset’s all-time high price is around the $4,900 price point, and it is currently trading at around $3,350.

Galaxy Research based its Ethereum prediction on expected regulatory clarity from the incoming Donald Trump administration. The firm tipped this clarity to offer tailwinds for DeFi and staking.

For one, the firm expects more traditional finance firms to dabble with DeFi and Ethereum Layer 2 chains. At the same time, it also expects ETFs to soon be allowed to stake a portion of their ETH holdings, unlocking interest payments for investors, all of which it anticipates will drive demand for ETH.

Amid these catalysts, Galaxy Research also expects Ethereum to gain some ground against Bitcoin, which it has underperformed since 2022. The firm tipped the ETH/BTC ratio to end 2025 above 0.06, up about 70% from current levels between 0.03 and 0.04. Still, the firm warns that this surge will be preceded by an initial dip below the 0.03 level.

Dogecoin (DOGE)

Meanwhile, Galaxy Research asserted that Dogecoin (DOGE) will follow up its over 245% gain in 2024 with a run to new highs in 2025. Specifically, the firm noted that the popular doggy-themed meme coin will clinch the long-coveted $1 price milestone and hit a $100 billion market capitalization in the new year.

While there is no guarantee that Bitcoin, Ethereum, and Dogecoin will hit these milestones in 2025, the odds of a favorable run appear to still be in the crypto market’s favor with the incoming pro-crypto administration and continued albeit slower economic easing plans from the Federal Reserve.

Expert Warns Against December 31 XRP Pump Expectation

0

Analyst Vincent Van Code warns XRP enthusiasts against expecting a major December 31 price pump, advising a break during the holiday season.

As the year draws to a close, the XRP community is rife with speculation about potential price movements. Many XRP enthusiasts are anticipating a major event today that could trigger a significant price “pump” for the digital asset.

However, Vincent Van Code, a software engineer and voice in the community, has cautioned against putting too much faith in these predictions.

Low Probability of a Major Event

In a tweet shared with his followers, Van Code expressed skepticism about the chances of a “big” XRP rally on December 31. According to him, the likelihood of such an event is extremely low—roughly 1 in 1,000. 

Moreover, he emphasized that there is little real evidence to suggest that a significant market move is imminent. Accordingly, he urged community members to consider the risks before making investment decisions based on the speculations.

“Is this gamble worth it?” Van Code asked, pointing out the importance of being grounded in reality rather than chasing speculative trends without strong backing.

Indeed, today, the last day of the year, the crypto market is largely bearish, and XRP is among the victims. XRP has dipped by 2% today, struggling to maintain the $2 price. It even briefly touched $1.9 before stabilizing back at $2.

Holiday Season and Limited Market Activity

Furthermore, Van Code reminded the XRP community that it is the holiday season when many industry professionals are taking a break. “Who’s actually working?” he asked. 

He suggested that key figures and market movers are likely spending time with their families and enjoying their hard-earned success rather than planning large-scale market manipulation.

Meanwhile, Van Code acknowledged the fun of speculating about riddles and puzzles within the XRP community. He appreciates the mysteries and speculative price forecasts but urges his followers not to bet on them as if they were certain events.

Advice to Unwind and Reflect

In his final point, Van Code recommended using the end of the year to unwind, regroup, and even take the opportunity to learn something new. “Take a break,” he encouraged, “there’s little happening now.”

Here’s the Biggest Wall Stopping Shiba Inu from Reclaiming $0.00003

0

Shiba Inu (SHIB) faces a massive supply wall in its struggle to reclaim early December highs.

The crypto market continues to witness a bearish phase, with asset prices persistently declining. Amid this unfavorable market condition, Shiba Inu (SHIB) is one of the biggest victims, having collapsed by more than 37% from its early December peak.

Despite the prevalent bearishness, Shiba Inu appears to be holding up well above the $0.00002 price territory but has failed to transcend this region. SHIB met fierce resistance when it attempted to reclaim $0.000025 on Christmas Day. 

Smaller SHIB Supply Wall

As the bears maintain control, IntoTheBlock data identifies a large sell wall that has served as resistance to Shiba Inu’s upsurge.

Particularly, SHIB faces two major supply walls before the much-coveted $0.00003 price territory. The first wall is relatively smaller, but poses a threat, nonetheless. This area lies between $0.000023 and $0.000024, where 42,310 addresses bought 60.44 trillion tokens.

Shiba Inu Supply Wall IntoTheBlock
Shiba Inu Supply Wall | IntoTheBlock

Shiba Inu witnessed the roadblock from this supply wall when it attempted to solidify a breach of the $0.000024 region on Christmas Day. The resistance led to a pullback that triggered an over 8% drop by Boxing Day, Dec. 26. 

Largest Sell Wall Stopping Shiba Inu from Hitting $0.00003

Meanwhile, beyond the $0.000023 to $0.000024 sell wall, the meme coin faces intense antagonism between $0.000024 and $0.000030. Notably, within this price range, data shows that about 208,010 addresses procured 70.35 trillion SHIB.

Shiba Inu Supply Wall

Due to the sheer number of addresses and the massive volume in this region, the area represents the largest ever wall for Shiba Inu. For instance, after Shiba Inu soared to a six-month peak of $0.00003343 on Dec. 8, it faced major resistance, largely from this massive sell wall.

Consequently, SHIB collapsed by an astonishing 15.30% the next day, marking its largest intraday decline since the Terra implosion in May 2022. Before the Dec. 8 attempt, SHIB previously pushed to breach the $0.00003 level, but a roadblock at $0.00003045 led to a 16.8% crash over a three-day period.

Several market analysts have presented lofty targets for Shiba Inu once the broader market rebounds, including the yearly peak at $0.000045. However, the dog-themed token’s chances of reaching any of these goals remain bleak until it decisively closes above the $0.00003 region.

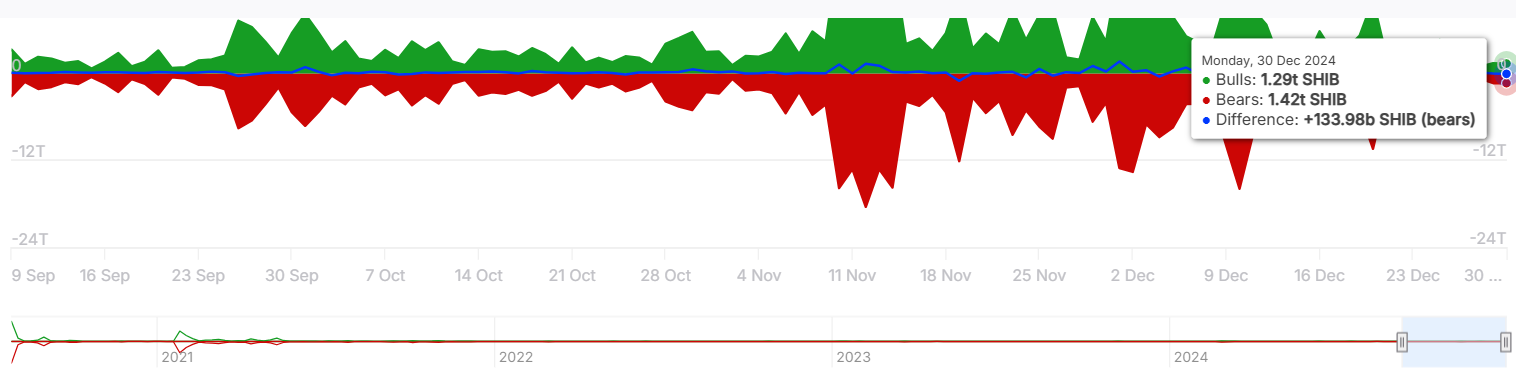
Meanwhile, further data from IntoTheBlock reveals that bears have dominated the scene over the past two days, contributing to the selling pressure. Specifically, on Dec. 29, SHIB saw an excess of 92.7 billion tokens sold by large whales. By Dec. 30, this figure rose to 133.98 billion SHIB.

SHIB Bears Maintain Control

At press time, Shiba Inu currently changes hands at $0.000021066, down by a meager 0.26% this morning. The asset has declined 21.19% in December after securing a 49.47% rise last month on the back of Donald Trump’s victory in the presidential election.

BlackRock’s IBIT Becomes the Greatest ETF Launch in History Spurred by Record Adoption

0

The IBIT Bitcoin ETF from BlackRock is the greatest ETF launch in history after swift investor adoption catalyzed a single-year net inflow worth billions of dollars.

Following an impressive market debut year, Bitcoin spot exchange-traded funds (ETFs) are among the most prominent investment vehicles in the global market. The funds’ immediate impact has seen them record a cumulative inflow of $35.24 billion and a net asset of $106.24 billion.

However, the iShares Bitcoin Trust (IBIT) stands out among these funds. The ETF’s herculean feat twelve months after its market debut has ensured it is the greatest launch in ETF history.

A Bloomberg report highlighted the impressive one-year performance of the BlackRock Bitcoin ETF and how its market entry has changed the narrative for the pioneering cryptocurrency Bitcoin.

The Fastest-Growing ETF in History

Recall that the US Securities and Exchange Commission (SEC) finally approved the introduction of spot ETFs tracking Bitcoin’s performance in January. On the 11th of the same month, 11 issuers launched trading, including BlackRock’s IBIT and Grayscale’s GBTC.

The rest has been history, as the funds instantly gained traction among US investors. However, IBIT saw the most inflows, with the intense warmth pushing the issuer’s net cumulative inflow past the $50 billion valuation in less than a year.

Notably, the incessant capital influx saw BlackRock’s IBIT become the fastest-growing ETF in history, trouncing the feat previously held by its own iShares Core MSCI EAFE ETF. Interestingly, the Bitcoin ETF reached the $50 billion milestone five times faster than the index fund tracker, which achieved the milestone in almost four years.

Moreover, BlackRock’s IBIT has grown to the size of 50 European market-focused ETFs, most of which have existed for decades. As a result, Nate Geraci, the president of the ETF Store, inferred that the investment vehicle is “the greatest launch in ETF history.”

BlackRock Extends Dominance to the Options Market

The IBIT did not just dominate the spot ETF market but also took the options market by storm. For context, the US SEC approved options trading for BlackRock’s Bitcoin spot product in September, and the contract went live on the Nasdaq exchange on November 19.

Under a month of offering contracts for the Bitcoin product, the IBIT contract ranked among the most active ETF options in the market. The contract records a 20-day average daily notional volume of $1.7 billion, ranking seventh in the star-studded list.

BlackRock Options Trading Volume

Meanwhile, BlackRock’s Bitcoin ETF win is among the catalysts for Bitcoin’s over 100% yearly price uptick. The asset surged to a new all-time high of $108,000 in early December, spurred by several bullish macroeconomic factors, including inflows from Bitcoin ETF issuers.

XRP Bollinger Bands Squeeze Again, Expert Says XRP Most Promising Setups Could Take It to $11

0

XRP continues to struggle around the $2 price as 2024 winds down, but analysts believe the token is one of the most promising crypto assets for 2025.

Last night, XRP dipped below the $2 mark for the third time in December, testing lows of $1.995 on Binance before bouncing back.

Although XRP’s ongoing price action has been discouraging, analysts like Ali Martinez believe its chart patterns are among the most bullish in crypto. He has cited numerous technical formations to support this view.

XRP Bollinger Bands Squeezing

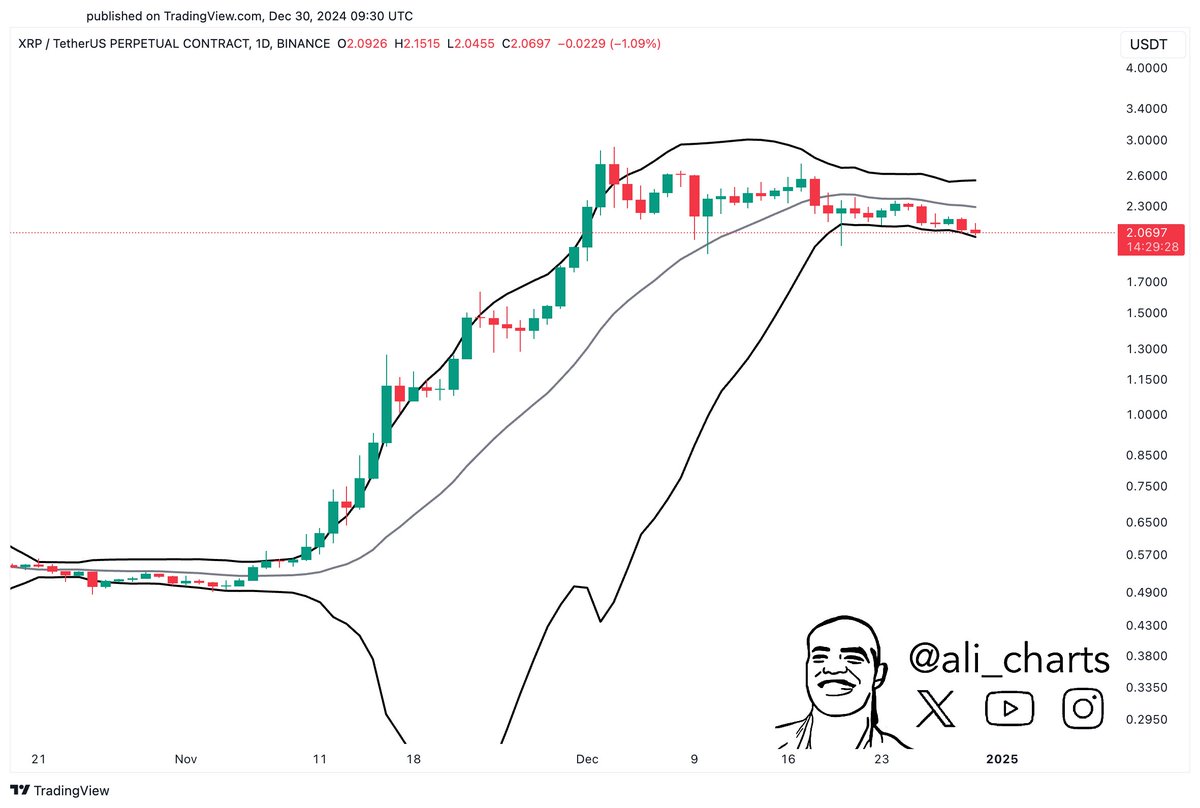
In a recent commentary, Martinez pointed out that the Bollinger Bands are tightening on XRP’s daily chart. He emphasized that this formation signals an imminent significant price movement.

Image
Bollinger Bands Squeezing on XRP 1D chart.

Notably, other market analysts have also observed this BB squeeze on XRP’s chart across different timeframes. They agree the setup is promising and could propel XRP to a new all-time high.

XRP Forming Compelling Pattern for $11 Rally

Meanwhile, in a follow-up update, Martinez presented another chart that paints a compelling picture of a potential surge to $11.

The chart shows that after a powerful rally in November that catapulted XRP to new heights, the price entered a period of consolidation. Specifically, it depicted XRP trading within a tightening range, where buyers and sellers engage in a tug-of-war, forming a bullish pennant.

XRP bull penant
XRP bull pennant

This consolidation phase, marked by diminishing volatility, has historically preceded explosive moves. When observing XRP on the 4-hour chart, this setup repeated at least three times between November and the first week of December. Each instance resulted in a significant breakout for XRP.

Martinez had pointed out this formation in a separate update two weeks ago, suggesting a short-term target of $4 upon a breakout.

Now, XRP is hovering around $2.04, locked within narrowing trendlines as the market awaits a decisive move. Martinez expects a 440% rally to $11 in XRP’s next leg up.

With the ongoing bearish performance, market commentators are urging XRP holders to remain patient.

Pundits like Bobby A assured investors that the asset has not broken out of a seven-year downtrend only to stop just short of reaching a new peak. He stressed that the ongoing pattern is temporary and consistent with historical moves.

Whales Positioning for XRP’s Next Move

Notably, while retail investors are increasingly frustrated with the continuous downturn in XRP, whales continue to load up on the asset, positioning for its next move. For instance, on December 25, XRP whale holdings increased by 60 million XRP.

$18 Dogecoin Price Projection: How Feasible is this Target?

0

A prominent market commentator maintains his ambitious two-digit Dogecoin target despite the consolidation, but pessimism abounds.

Over the past month, several analysts have maintained extremely bullish sentiments on the leading doggy-themed meme coin Dogecoin (DOGE) and have not backed down despite recent crypto market struggles.

Amid the sea of optimistic takes, however, many market observers have begun to question whether the highly ambitious price targets eyed by analysts are grounded in reality.

Dogecoin (DOGE) to $18?

At the time of writing, Dogecoin looks set to close 2024 with an over 245% gain, having surged from a January 2024 opening price of $0.08956 to trade at $0.30930 currently. While an over 200% annual return is impressive by any measure, analysts like Ali Martinez have maintained that there is a chance that this is just the beginning of DOGE’s parabolic run.

Over the past few weeks, the analyst has repeatedly reiterated the view that a DOGE rally to anywhere between $4, $18, and $23, representing 1,200%, 5,700%, and 7,300% gains from current prices, respectively, is possible based on the asset’s historical price action in previous bull markets in 2017 and 2021.

To be sure, as has been highlighted by Martinez, DOGE rallied 5,000% to a peak of $0.01857 from a similar position in 2017 and 12,000% in 2021 to its current all-time high of $0.74.

On Monday, December 30, Martinez again shared his bullish outlook on DOGE, reiterating the $18 price target based on an ascending channel on the asset’s weekly candle chart formed by the aforementioned historical price action.

DogecoinUSD weekly candle chart
DogecoinUSD weekly candle chart. Source: Ali Martinez

An Unrealistic Target?

“Unrealistic,” “far-fetched,” and “nonsense” are some of the reactions that have trailed Ali Martinez’s ambitious $18 price projection for Dogecoin.

These reactions come as many believe that such a price projection sets an unattainable market cap target for the meme coin. Specifically, DOGE will need to attain a market cap of $2.65 trillion to hit the $18 price point, assuming it maintains its circulating supply of 147.3 billion coins. For context, the market capitalization of Bitcoin, the largest crypto by market cap, is about $1.8 trillion.

Understandably, many find it difficult to imagine a future where DOGE, a meme coin with a current market capitalization of only $45.8 billion, can surpass the current market capitalization of Bitcoin.

While the $18 target seems impractical to most, many remain optimistic about Martinez’s $4 calls. However, even this $4 projection represents an ambitious undertaking as it will require the asset to hit a market capitalization of nearly $600 billion, about 50% more than the market capitalization of Ethereum.

Still, it may also not be wise to bet against DOGE as not many traditional finance experts would have ever anticipated a future where such an asset would have a market capitalization of over $45 billion.

Dogecoin Whales Active Despite Downtrend, Move 816,890,148 DOGE in 24 Hours

0

Dogecoin whales have been actively shifting large amounts of the meme coin to new addresses amid the market’s downward trend.

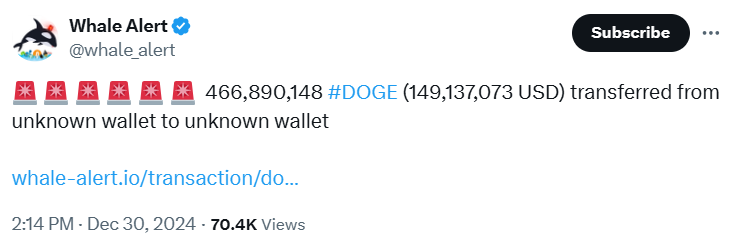
The on-chain tracking platform Whale Alert drew the community’s attention to this massive Dogecoin shuffle among whales. On December 30, it pointed to two staggering transactions worth a combined $260 million. 

Whales Shift DOGE to New Addresses

Data from Whale Alert shows that an unidentified whale address moved 466,890,148 DOGE tokens to a new address on Monday by 13:13 (UTC).

Whale Alert on X
Whale Alert on X

Notably, the sending wallet “DB24H3” transferred DOGE worth approximately $150 million to an unidentified receiving address, “DFRapC.” 

The sending address emptied its Dogecoin stash into the new wallet, shifting the funds over multiple transactions to the same wallet. Meanwhile, the assets remain with the receiving wallet at the time of writing, neutralizing any skepticism the transaction may have raised in the Dogecoin community.

Another Whale Shifts 350,000,000 DOGE

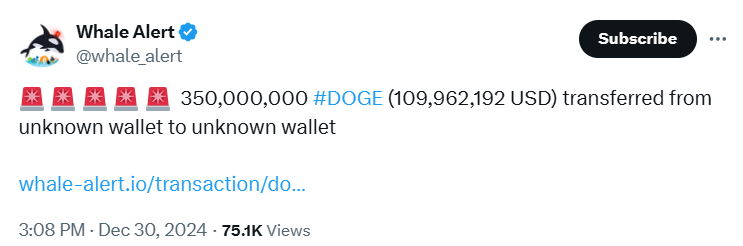
While curiosity swelled among Dogecoin enthusiasts over the implication of the hefty fund shift, another whale wallet moved a similarly staggering amount. Whale Alert also uncovered the transaction where an unidentified wallet moved 350 million DOGE to a new wallet.

Whale Alert on X
Whale Alert on X

This second transaction occurred almost an hour after the first, specifically by 14:06 (UTC) on December 30. Within the transaction hash “0abd62,” address “DQhgaR” received 350,000,000 DOGE ($109.9 million) over 35 transactions from multiple sending addresses.

Meanwhile, the receiving address now holds 353.5 million DOGE ($110 million) after procuring 3.4 million DOGE ($1 million) from another wallet today.

Dogecoin Nears 30 Cents

Moreover, the significant shuffle correlated with a continued downtrend in Dogecoin’s price. The largest meme coin by market cap further corrected 2% in the past 24 hours, pushing closer to $0.3000. 

However, bulls remain optimistic, insisting the recent dip is a buying opportunity. For context, analyst Ali Martinez recently noted that Dogecoin’s fractal properties could take the meme coin alpha to $23 this cycle.

At the time of writing, Dogecoin trades at $0.3103 with a market cap of $45.77 billion.

Here is Why XRP is One of the Most Hated Coins: Analyst Explains

0

A market analyst points to quick exhaustion in XRP price rallies as a reason behind the constant antagonism the altcoin faces.

While XRP has delivered impressive gains during specific periods over the past 11 years, many view its inconsistent performance as reasons for its unpopularity. Amid the ongoing consolidation, analyst IncomeSharks recently discussed why the altcoin often finds itself under criticism.  

XRP’s Brief Rallies

In an analysis this morning, IncomeSharks highlighted XRP’s recurring pattern of brief rallies, often lasting four to five weeks before leading to sharp corrections. 

His initial commentary came up on Dec. 3, in which he pointed out that the latest XRP rally had lasted just over four weeks. The rally, which began on Nov. 5, saw XRP surge from $0.5031 to a seven-year high of $2.9 by Dec. 3. This marked a 476% gain. However, the uptrend stalled at $2.9, and a pullback followed shortly.

By Dec. 9, XRP had continued to correct. At this point, IncomeSharks noted that XRP’s rally had just barely extended to five weeks, breaking its historical trend of four-week surges. 

He questioned whether the asset could sustain its momentum and suggested that its consistent inability to maintain rallies contributed to its negative reputation among long-term investors.  

However, XRP’s pullback was not isolated. Notably, the decline coincided with a broader market correction. Nonetheless, Bitcoin was able to rebound mid-month to reach a new all-time high of $108,364 on Dec. 17. Despite Bitcoin’s push, XRP failed to retest the $2.9 peak, with the bears attempting to push it below $2. 

Not Attractive to Long-Term Investors

In his latest disclosure today, IncomeSharks summarized his critique of XRP, stating that its pattern of four-to-five-week rallies every few years is not a bullish characteristic. 

He argued that while XRP presents opportunities for short-term traders, it fails to provide consistent returns for long-term investors. His accompanying chart suggested that this pattern of brief rallies occurred from late 2017 to January 2018 and from late March to late April 2021.

However, IncomeSharks failed to observe that in 2017, XRP’s bull run lasted for more than four weeks. XRP first rallied from $0.00570 in February to $0.0615 in March 2017, then consolidated before another four-week rally pushed it to $0.3988 in May 2017. After another pullback, XRP rallied again to $3.31 in January 2018.

Ripple Escrow Practices

Meanwhile, in addition to its brief rallies, XRP faces criticism for Ripple’s monthly sales of XRP from escrow accounts. Ripple, which controls nearly 40 billion XRP in escrow, releases 200 million tokens every month. 

Some critics claim these regular sales suppress XRP’s price and hinder its growth, contributing to the perceived underperformance. However, Ripple execs have consistently refuted these claims.

Timeline for XRP Path to $13 and Beyond: $0.87 Support Holds the Key

0

A notable market analyst believes XRP could slump below the $1 price mark before recording a recovery pump to a two-digit ultimate target.

XRP is currently battling bearish pressure. The token has experienced a 9% loss over the past 24 hours but remains above $2. With the year drawing to a close, XRP is on track to close its first-ever yearly candle above $2, a major milestone in its history. 

However, market experts predict a volatile path ahead, with sharp corrections potentially setting up the necessary conditions for a massive rally.  

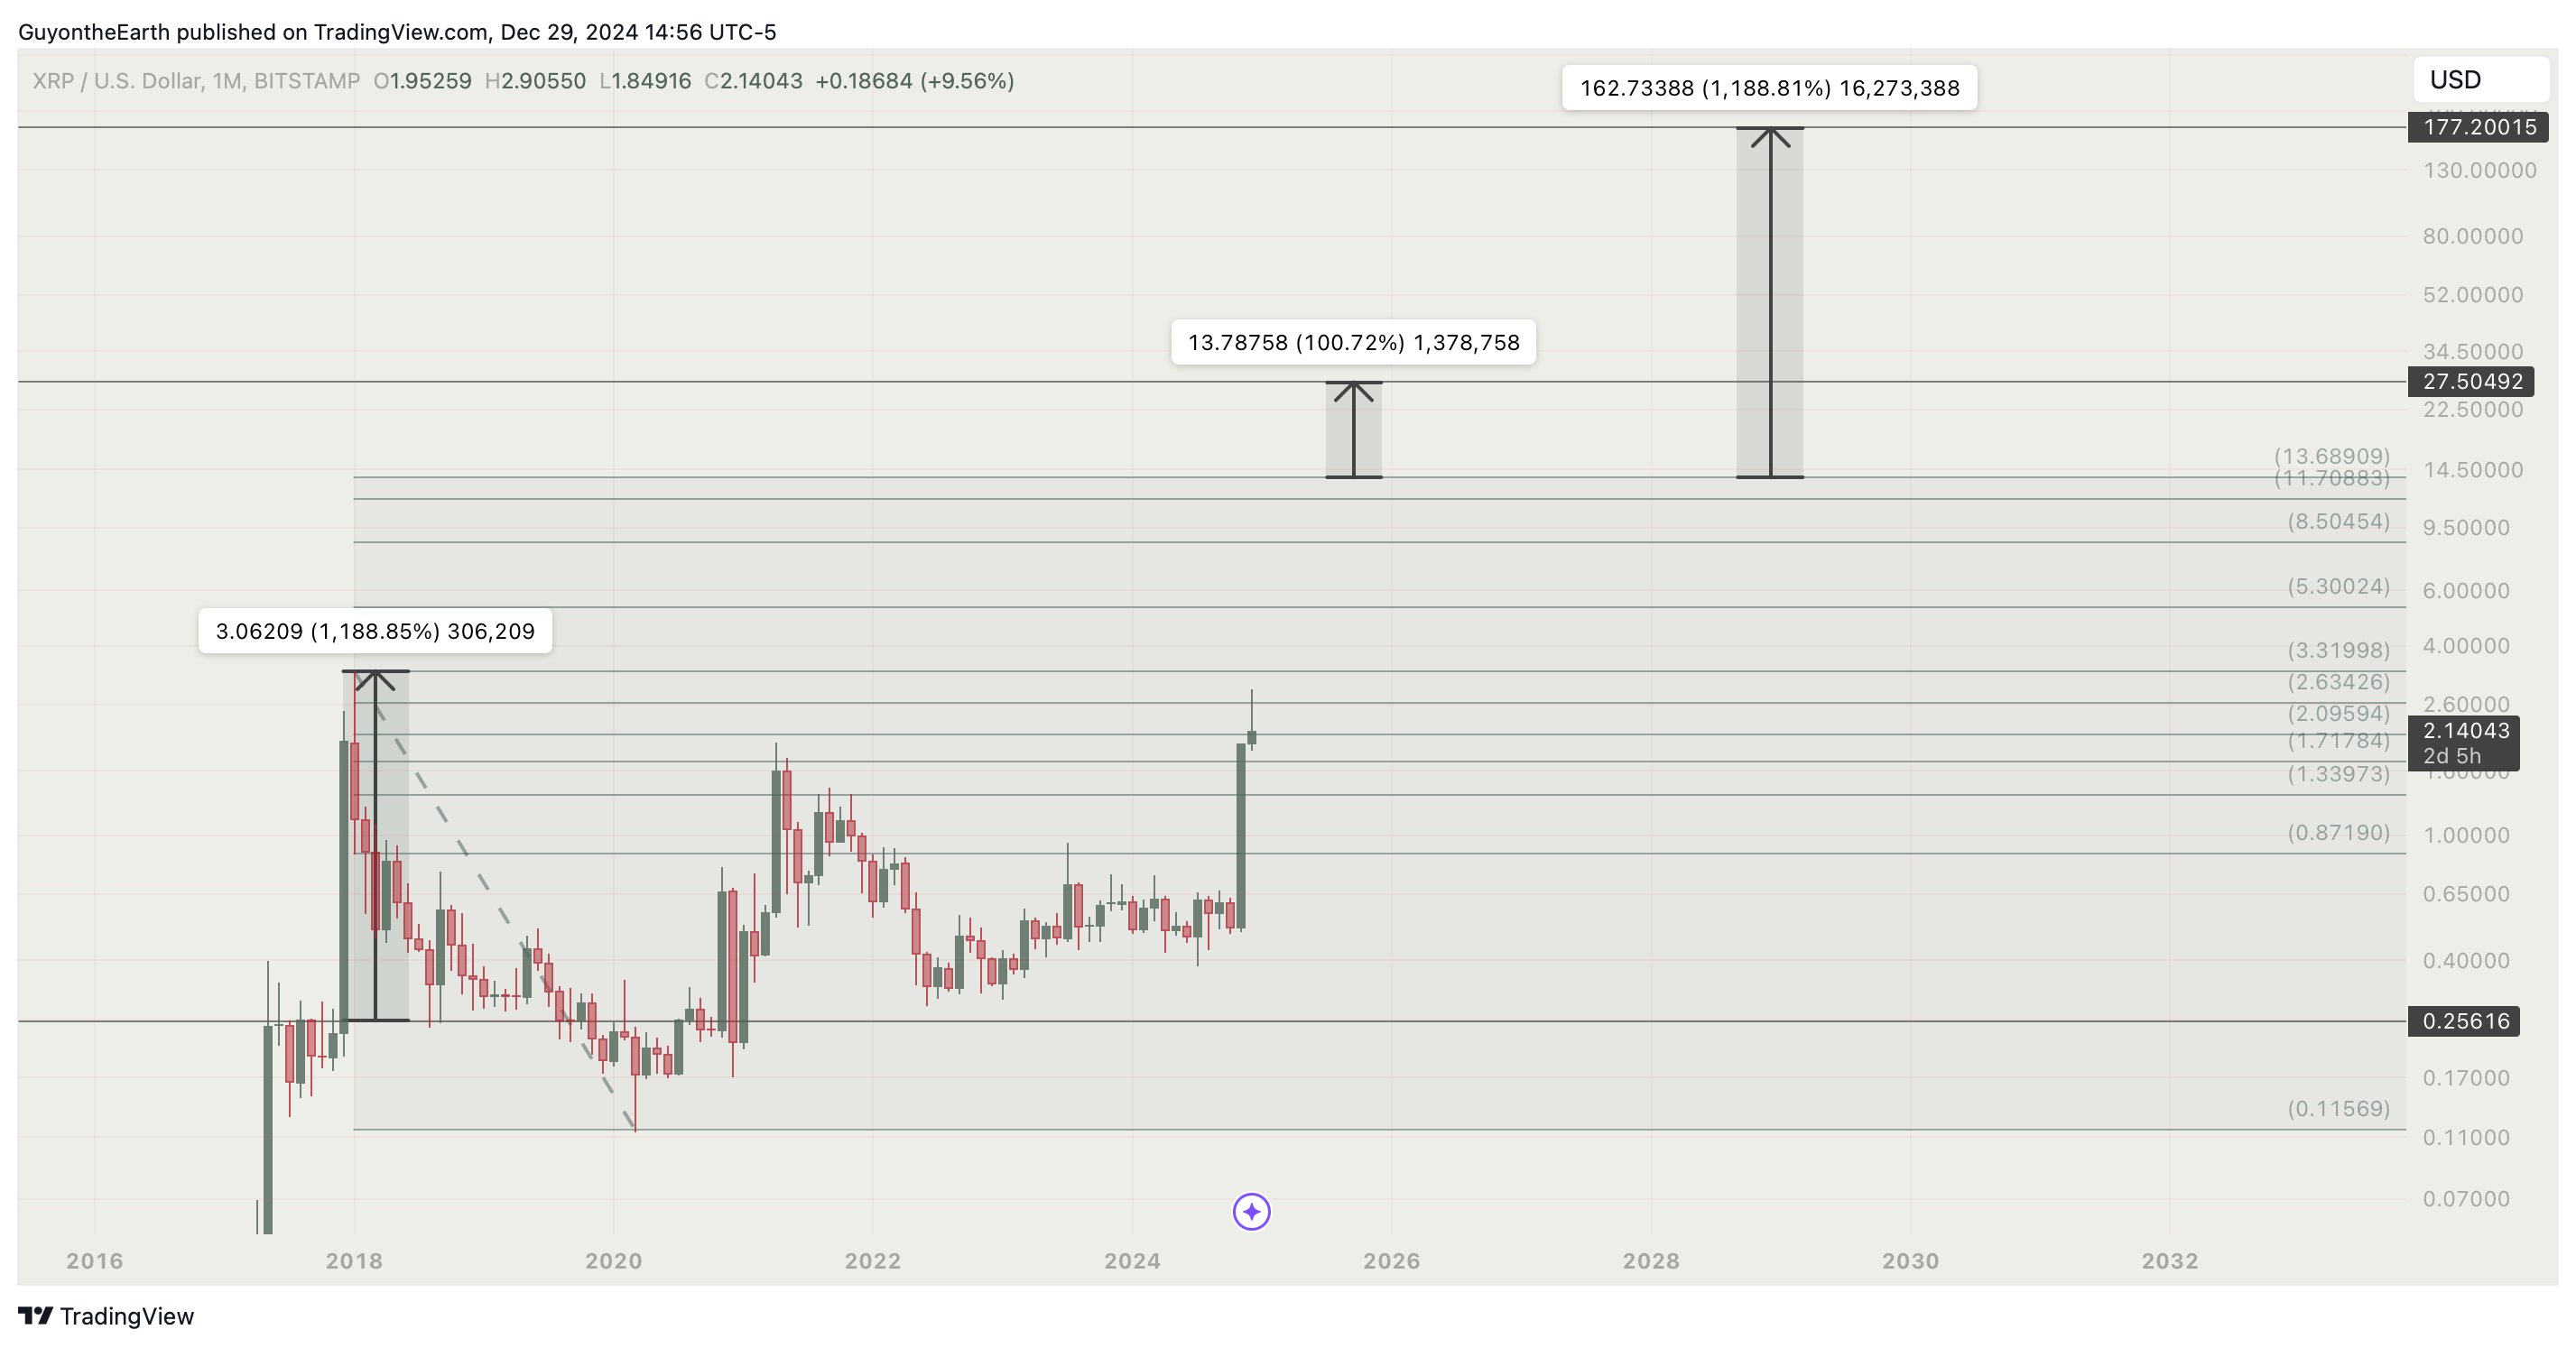
A well-known analyst, “Guy on the Earth,” recently presented a similar stance. He compared the current market conditions to previous bull cycles, particularly the 2013 and 2017 runs. 

Historically, XRP’s bull markets have seen extensive consolidation periods before explosive rallies. The 2013 cycle featured a four-year consolidation followed by a massive price surge, while the 2017 cycle extended gains by 1,100% within months.  

The analyst suggests that as the crypto market matures, volatility will decrease, leading to smaller percentage gains. According to him, a repeat of the 2017 extension could theoretically push XRP to $177, but such a target is unlikely during this cycle. 

Image

Instead, he set a more realistic maximum target for this bull run of $27. Interestingly, another prominent market watcher, EGRAG Crypto, has consistently predicted $27 as his target for XRP, citing different pathways. Meanwhile, “Guy on the Earth” believes the target is achievable by January 2026.  

XRP Short-Term Targets

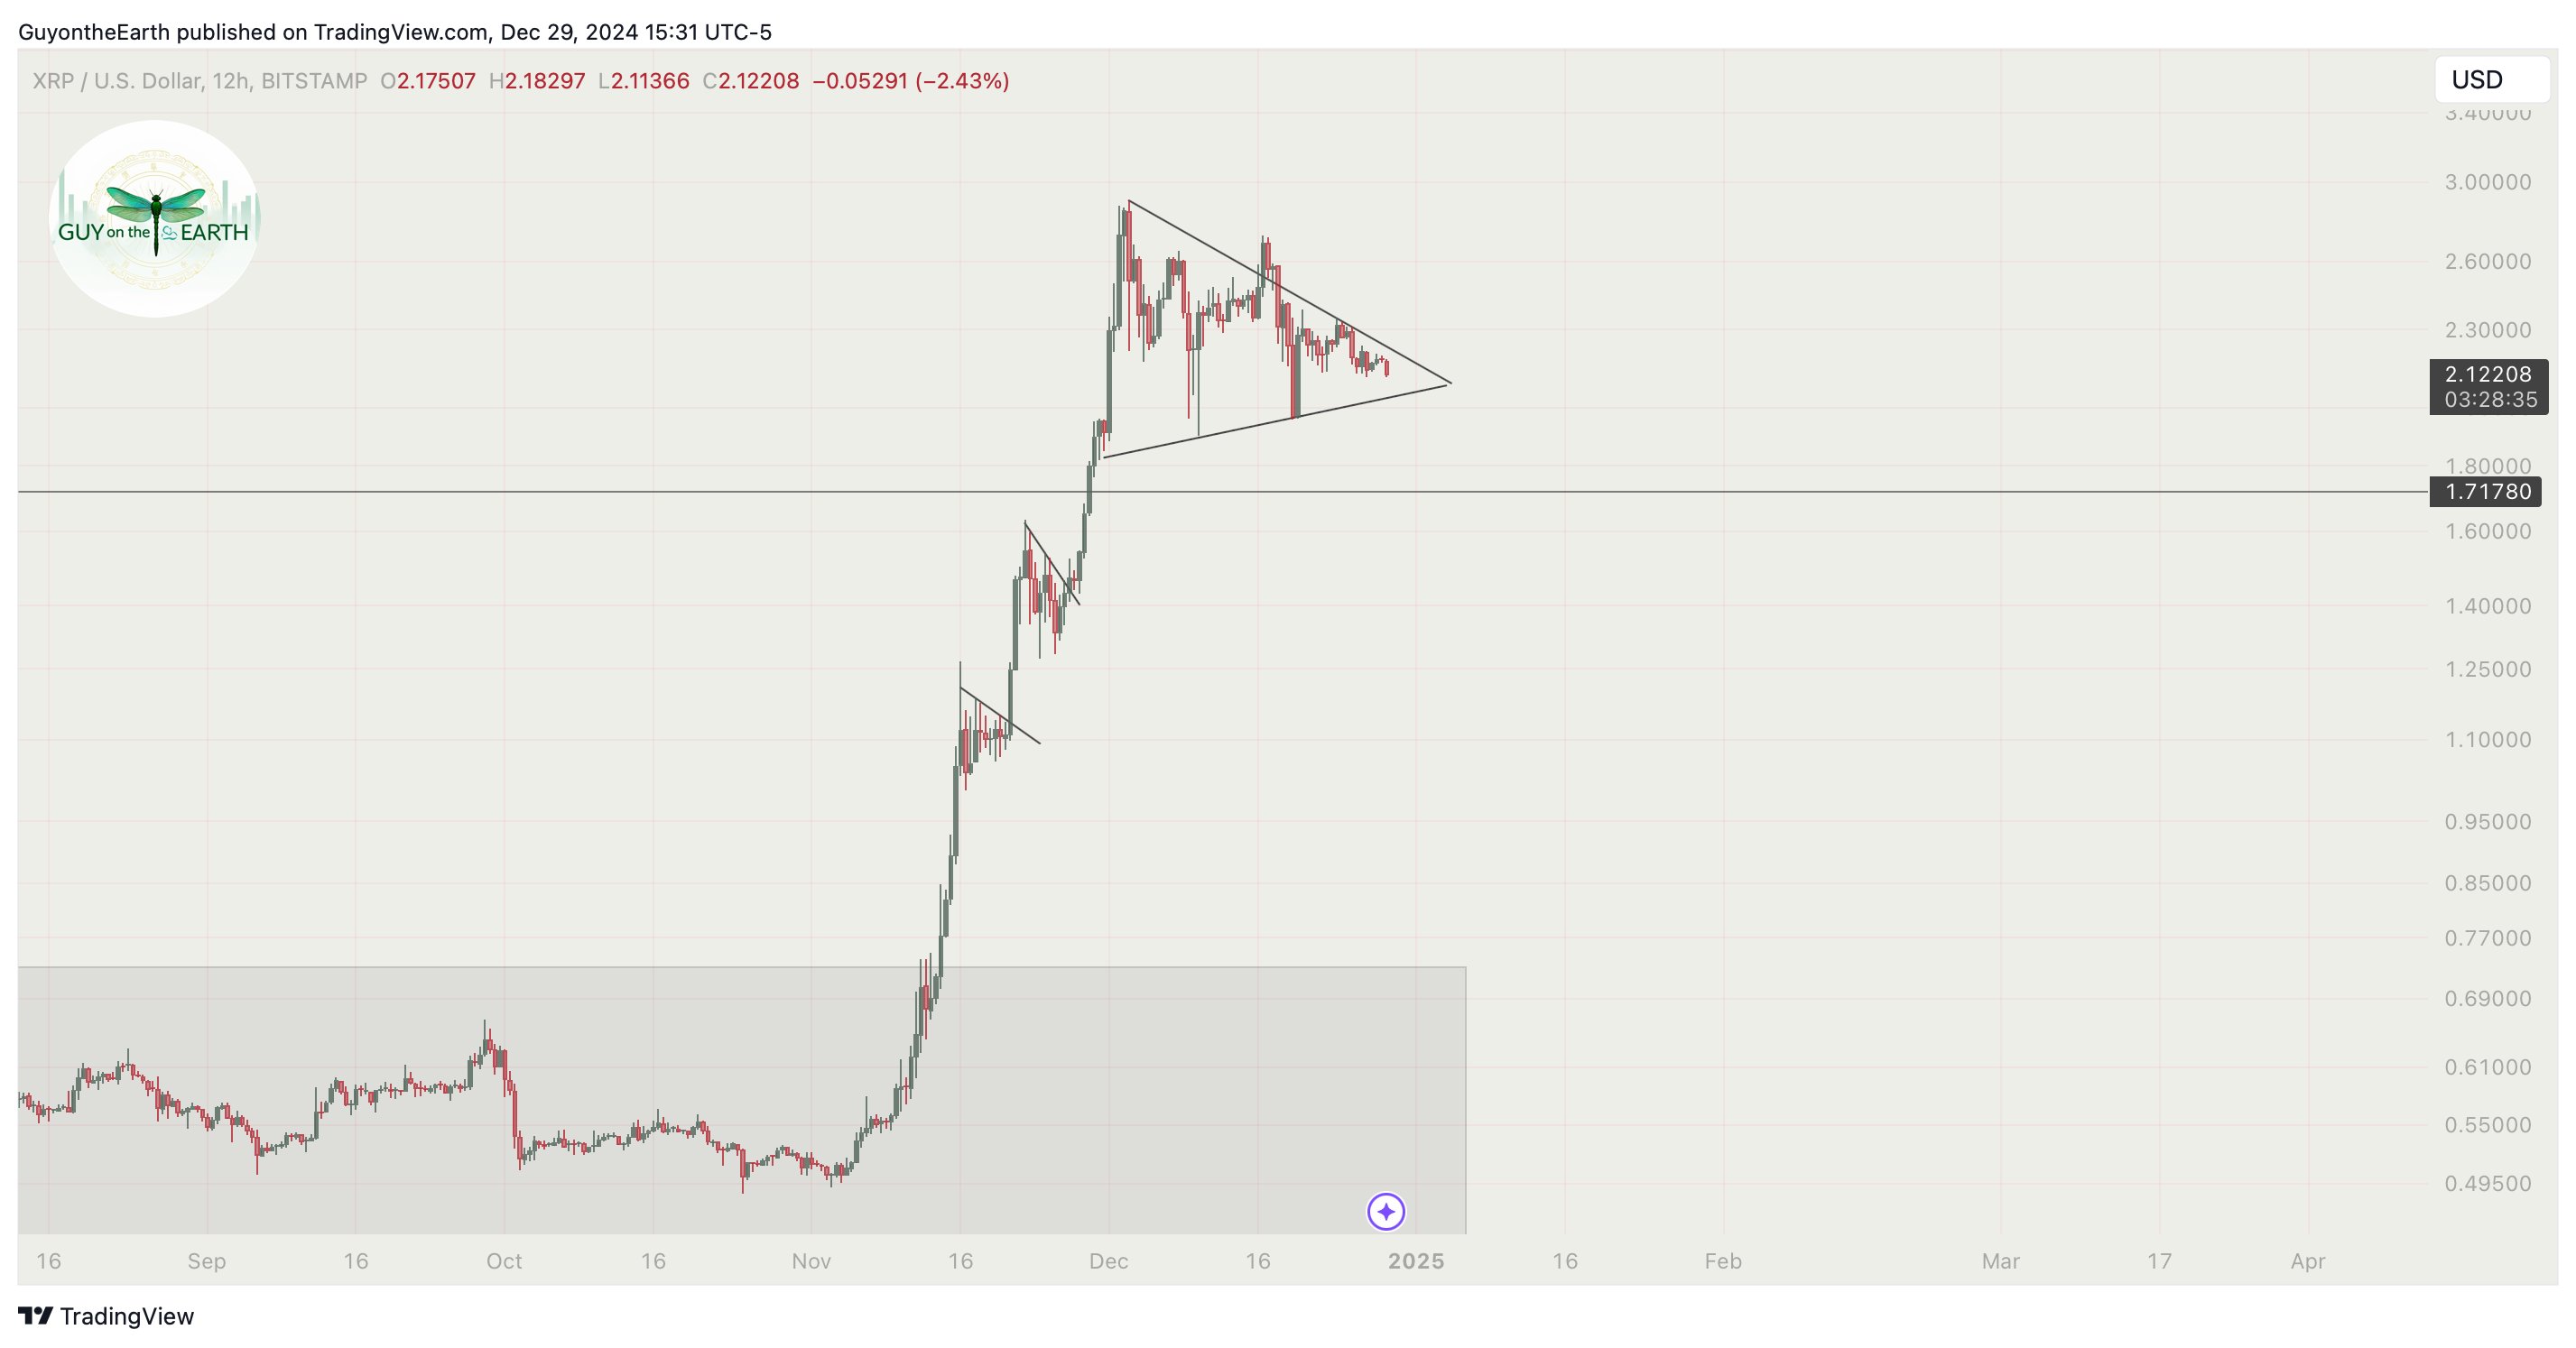
In the short term, the analyst predicts further downside for XRP. He expects the token to test support levels between $1.70 and $1.80 in the coming days. This correction aligns with a potential Bitcoin drop to around $80,000, which could pull XRP lower. For context, BTC currently trades for $92,550.

If the $1.70 and $1.80 support levels fail, XRP could fall to $1.33 or even $0.87, aligning with Fibonacci levels from historical patterns. Notably, these levels represent prime opportunities to enter long positions. The analyst views $1.70 as a solid entry point, with $1.33 being an even stronger buying zone.  

Image

For context, such price action would be consistent with XRP’s historical behavior of triangle consolidations preceding major upward movements. However, the analyst thinks this consolidation phase could be longer and deeper than many expect, creating anxiety.  

Long-Term Price Targets

Despite the near-term bearish outlook, the analyst maintains a bullish perspective for XRP’s long-term trajectory. He identifies $13 as a minimum target for the current cycle, with a blow-off top potentially pushing the price to $27 by January 2026.  

For profit-taking, the analyst suggests investors should leverage a tiered strategy. He advises selling 10% of holdings when XRP reaches $5.30, 20% at $8.50, and another 20% at $13. Investors can then reserve the remaining 50% of holdings for a potential peak at $27.

Notably, XRP currently changes hands at $2.02, down 3.53% over the past 24 hours as the bulls struggle to maintain a $2 price before the close of the year. From here, XRP would need to spike by 543% to claim the minimum target of $13 and by 1,236% to reach $27.