Home Blog Page 1180

Hoskinson Explains Why This Venture Capitalist Snubs Cardano in Latest Crypto Report 

0

Cardano founder Charles Hoskinson reveals why venture giant Andreessen Horowitz (a16z Crypto) failed to include Cardano in its recently published State of Crypto 2024 report. 

Yesterday, the crypto arm of leading venture capitalist Andreessen Horowitz (a16z Crypto) released the 2024 edition of its State of Crypto report. The VC highlighted the latest trends among crypto builders and recent tech improvements in the report. 

ADA Enthusiasts Question Cardano Omission From a16z Crypto Report 

The report provided several key metrics, such as monthly active crypto addresses and top blockchains by developer interest. According to the report, the monthly active crypto addresses hit an all-time high of over 220 million in September. 100 million of these addresses interacted with Solana. 

The other blockchains included in the report are BNB Chain, Ethereum, Polygon, Bitcoin, Tron, Ton, Avalanche, and Arbitrum. 

For the top blockchains by developer interest, the report mentioned several networks like Ethereum, Solana, Avalanche, Bitcoin, Base, Optimism, Avalanche, and BNB Chain, among others. However, a16z Crypto omitted Cardano from both metrics.  

Consequently, ADA enthusiasts called out a16z for omitting Cardano despite the network’s remarkable activity. Popular Cardano SPO Stake with Pride claimed that the network boasts over 1,000 projects and 1.3 million staked wallets. Additionally, Pride said Cardano’s daily active users range between 30,000 and 50,000. 

Despite this remarkable feat, Pride was stunned that a16z Crypto left out Cardano in its crypto report. 

Cardano Founder Reacts 

Reacting, Hoskinson emphasized that VCs usually write about projects they are invested in and could profit from. The comment implies that a16z will not highlight Cardano’s stats since the venture capitalist has no financial stake in the project. 

This is not the first time Hoskinson has reacted to venture capitalists’ unfair treatment of Cardano. Some of these VCs have taken things to the extreme by refusing to invest in any Cardano-related project. 

In November 2022, the founder of NMKR, Patrick Tobler, disclosed that a VC informed him that they would not provide financial backing for Cardano or any project affiliated with the blockchain. Responding, Hoskinson pointed out that these VCs prefer to invest their money in defunct projects like FTX and Terra. 

While he cannot say what VCs have against Cardano, Hoskinson believes Cardano will remain relevant against all odds. 

Bitcoin Second Bull Run Looms as BTC Futures Market Becomes Overleveraged

0

A recent analysis suggests Bitcoin may be gearing up for the second bull run as the futures market becomes overleveraged.

Ki Young Ju, the CEO of CryptoQuant, recently provided data that indicates overleveraging in the Bitcoin-Tether (BTC-USDT) futures market, which could be a precursor for massive price movements.

Notably, his report assessed data from two important metrics: the BTC-USDT open interest to reserves ratio and the BTC-USDT open interest to USDT market cap ratio.

Bitcoin OI to Reserves Ratio

The first metric, the Open Interest to Reserves ratio, highlights how much open interest (unsettled futures contracts) exists relative to the amount of Tether (USDT) held in reserves by major exchanges. Notably, OI on exchanges recently reached an ATH above $19 billion.

The ratio, which includes Ethereum- and Tron-based USDT, covers 97% of the total USDT market cap, making it highly representative of the overall market. A steady increase in this metric suggests growing leverage in the market.

Bitcoin OI to Reserves Ratio CryptoQuant
Bitcoin OI to Reserves Ratio | CryptoQuant

On July 29, the ratio had surged to 0.42, when Bitcoin’s price hit $70,016, as its recovery led to an uptick in BTC price. However, following the July 29 peak, it dropped alongside Bitcoin’s price, hitting a low of 0.27 in early August. 

Interestingly, this drop coincided with Bitcoin’s price falling to a six-month low of $49,577. This marked the end of a retracement phase. Since then, the metric has gradually recovered and now stands at 0.46. This recent recovery suggests increasing leverage as traders bet on a further rise in Bitcoin’s price.

BTCUSDT OI to USDT Cap Ratio

The second metric is the ratio of total BTC-USDT open interest to USDT’s market cap. This measure also reflects the level of leverage in the market and has closely tracked Bitcoin’s price movements throughout 2024. 

Bitcoin OI to USDT Market Cap Ratio CryptoQuant
Bitcoin OI to USDT Market Cap Ratio | CryptoQuant

At the start of the year, this metric was at a low of 0.06, but it spiked to 0.12 in March, aligning with Bitcoin’s all-time high of over $73,000. Since the March peak, the ratio has fluctuated with Bitcoin’s price, reaching a low of 0.07 in early August when the price dropped to $49,577. 

However, it has since returned to 0.12, demonstrating a recovery in market sentiment. The rise of these two metrics suggests that Bitcoin could be on the verge of another bullish surge.

Notably, Ki Young Ju confirmed that a factor driving this overleveraging is the relatively low Maximum Drawdown (MDD) in this market cycle. 

Bitcoin On a Recovery Path

With less severe price drops, even traders using 3x leverage positions have avoided liquidation, encouraging more aggressive use of leverage. As a result, many traders are now heavily leveraged. This in turn sets up the market for a potential sharp move.

Meanwhile, Bitcoin price has recently seen a resurgence, climbing by nearly 5% within two days earlier in the month and maintaining gains despite slight pullbacks. 

After breaching the $63,000 level, it continued its uptrend, recently reaching $67,000. However, the support at this level is weak, and if a correction occurs, bulls must defend the $66,119 pivot to prevent a drop into bearish territory.

Top Analyst Says Shiba Inu Poised for a Comeback Rally to $0.00004

0

AJTrader, a widely followed analyst on TradingView, has argued Shiba Inu may be setting out for a powerful upswing toward the $0.00004 level again.

A key factor influencing this optimism is the seven-month downtrend and the recent uptrend that is gradually building momentum for SHIB.

Notably, Shiba Inu experienced a collapse of over 76% since its peak in March, coming dangerously close to dropping another zero in August. However, a reversal of this downtrend has been underway, gaining momentum in September.

For instance, SHIB reached its lowest value for September at $0.00001238 on the sixth day of the month. Three weeks later, Shiba Inu achieved its highest price for the month at $0.00002156, marking the highest value the meme coin has seen in three months.

Amid Shiba Inu’s impressive performance in September, it surpassed a seven-month-long trendline, as illustrated in AJTrader’s chart. Although the altcoin has dipped to $0.000015 since its September peak, the price action remains above the resistance trendline.

Shiba Inu chart TradingView
Shiba Inu 1D Chart | AJTrader

Shiba Inu to $0.00004

In his commentary on this trajectory, AJTrader noted that Shiba Inu’s next successful attempt to recapture the $0.00002 region could provide the meme coin with enough momentum to break higher resistance levels at $0.00004.

At the time of reporting, Shiba Inu was exchanging hands at $0.0000178, reflecting a 5% drop from the higher threshold of $0.00001909 it traded at the previous day. From the current level, reaching $0.00004 would require a growth of 124.72%.

Other Bullish Shiba Inu Targets

Interestingly, AJTrader is not the only TradingView analyst bullish on Shiba Inu. Another market watcher has suggested a potential price surge of up to 400%, which could drive SHIB’s value to $0.00007, a high last seen three years ago.

However, analyst Klejdi Cuni on TradingView has highlighted that the path toward $0.00004 or $0.00007 may not be straightforward. Cuni outlined immediate resistance levels at $0.000019 and $0.00002, which, if surpassed, could open the door for higher levels.

Shiba Inu Bearish Signals

Meanwhile, while these analysts are seeing bullish signals in Shiba Inu’s current pattern, analyst Edward Fibonacci has identified a head-and-shoulders pattern on SHIB that signals a warning for a potential major correction. Edward noted that if Shiba Inu breaks below the $0.000015 level, it could continue on a downward spiral to $0.0000094.

XRP Set to Challenge $0.60 as It Trades Within a Bullish Channel Amid SEC Appeal Deadline

As discussions surrounding the SEC’s deadline to appeal intensify, XRP’s price has begun to rise within a bullish channel. Will it reach the $0.60 mark?

With the SEC approaching its deadline to submit the crucial Form-C statement in the ongoing Ripple case, the XRP token price is staging a bull run. Additionally, the founders of XRPL Labs have voted to reduce the XRP account reserve fee from 10 XRP to 1 XRP, resulting in a 90% waiver.

Amid this positive momentum, can XRP achieve the $0.60 milestone as the broader market gears up for a bullish comeback?

XRP Eyes Channel Breakout

In the 4-hour chart, XRP showcases a bullish trend gaining momentum within a rising channel pattern. With a boost in trading volume, the XRP token price is inching closer to the $0.55 mark.

XRP price chart
XRP price chart

The bullish rally began after a significant drop of 23.76% in early October when the price fell from $0.6650 to $0.50. However, the altcoin has begun to bounce back as the broader market recovers and social engagement around XRP concerning the SEC appeal increases.

The altcoin has risen by 6.86% from a seven-day low of $0.52263 to $0.55263. This recovery marks a new positive cycle within the rising channel pattern. 

As the bullish influence grows, the 20 and 50 EMAs in the 4-hour chart show a bullish crossover. Furthermore, the 20 and 100 EMAs are on the verge of a bullish crossover. 

Will XRP cross $0.60?

As the bullish trend extends, XRP appears poised to surpass the 200 EMA on the 4-hour chart while also breaking above the 23.60% Fibonacci level at $0.5510. For a sustained rally, the XRP token price must overcome the overhead resistance trendline and the 38.20% Fibonacci level at $0.5717.

According to the Fibonacci retracement analysis, a breakout from the rising channel could challenge the 61.80% and 78.60% levels at $0.60 and $0.6292, respectively. Conversely, key support levels for XRP are situated at $0.55 and $0.5174.

Two Major Signs That Bitcoin Bull Cycle is Still Early

0

Key metrics such as a surging Bitcoin open interest and low Google search interest signal that Bitcoin could rally substantially, as the cycle is still early.

Bitcoin is approaching its all-time high of around $74,000 after the recent spike over the last seven days. For context, the asset has rallied over 10% in the past week, reaching a three-month price high above $68,000 on Wednesday.

With analysts expecting the asset would reach its ATH before the November US election, the appreciation seems miniature compared to the potential rally Bitcoin could pull off eventually. Notably, two metrics show that the Bitcoin bull cycle is still nascent.

Market Participation Surges to ATH

Data from Coinglass shows that the open interest of the largest cryptocurrency by market cap has surged to new highs, hitting $39.67 billion on Thursday. Notably, this metric tracks the number and value of open derivatives and options positions on the premier crypto asset at a determined span.

The amount of funds actively traded on the Bitcoin market surged to $39.67 billion, surpassing yesterday’s high of $37.77 billion. This indicates increased interest and participation among traders, reinforcing bullishness.

Bitcoin Open Interest

Meanwhile, the Chicago Mercantile Exchange (CME) leads Bitcoin trading activities among other exchanges, providing liquidity worth $12.25 billion. Notably, being the largest futures exchange, CME accounts for more than 30% of the total derivative activities on the premier crypto asset.

Among traditional crypto exchanges, Binance, the largest platform by trading volume, commands a considerable amount of liquidity. Traders have opened about $8.08 billion worth of Bitcoin trading positions on the platform, accounting for 20% of the total derivative participation.

Furthermore, other notable exchanges, like Bybit and OKX, have billions of dollars in derivative positions opened on them, while Coinbase and Crypto.com provide liquidity in millions.

It bears mentioning that a spike in appetite for leveraged Bitcoin trading in such a manner precedes a corresponding price uptrend. This trend was apparent in the April and November 2021 spikes, with Bitcoin surging to its previous all-time high of $69,000 in the latter.

Bitcoin Search Interest Paints Bullish Bitcoin Picture

A further bullish Bitcoin scenario is evident in the miniature searches associated with the leading crypto asset. Data shows that the number of internet look-ups with the keyword “bitcoin” is nearing its all-time low despite Bitcoin approaching its all-time high.

Historically, search interest for Bitcoin spikes extensively as bull cycles mature. For instance, internet queries involving “bitcoin” surged to their peak popularity of 100 in November 2021, when Bitcoin touched $69,000.

Bitcoin Interest Chart

Notably, surging interest signals the presence of retail traders, popularly speculated to be the market top. With the interest index still below 25, Bitcoin’s popularity and bull run are historically still in their early stages.

Bitcoin Sees 813% Surge in New Whale Holdings, CryptoQuant CEO Says Market Atmosphere Maturing

0

New Bitcoin whale wallets have surged this year, signaling heightened interest in the asset class and maturation of the BTC sphere.

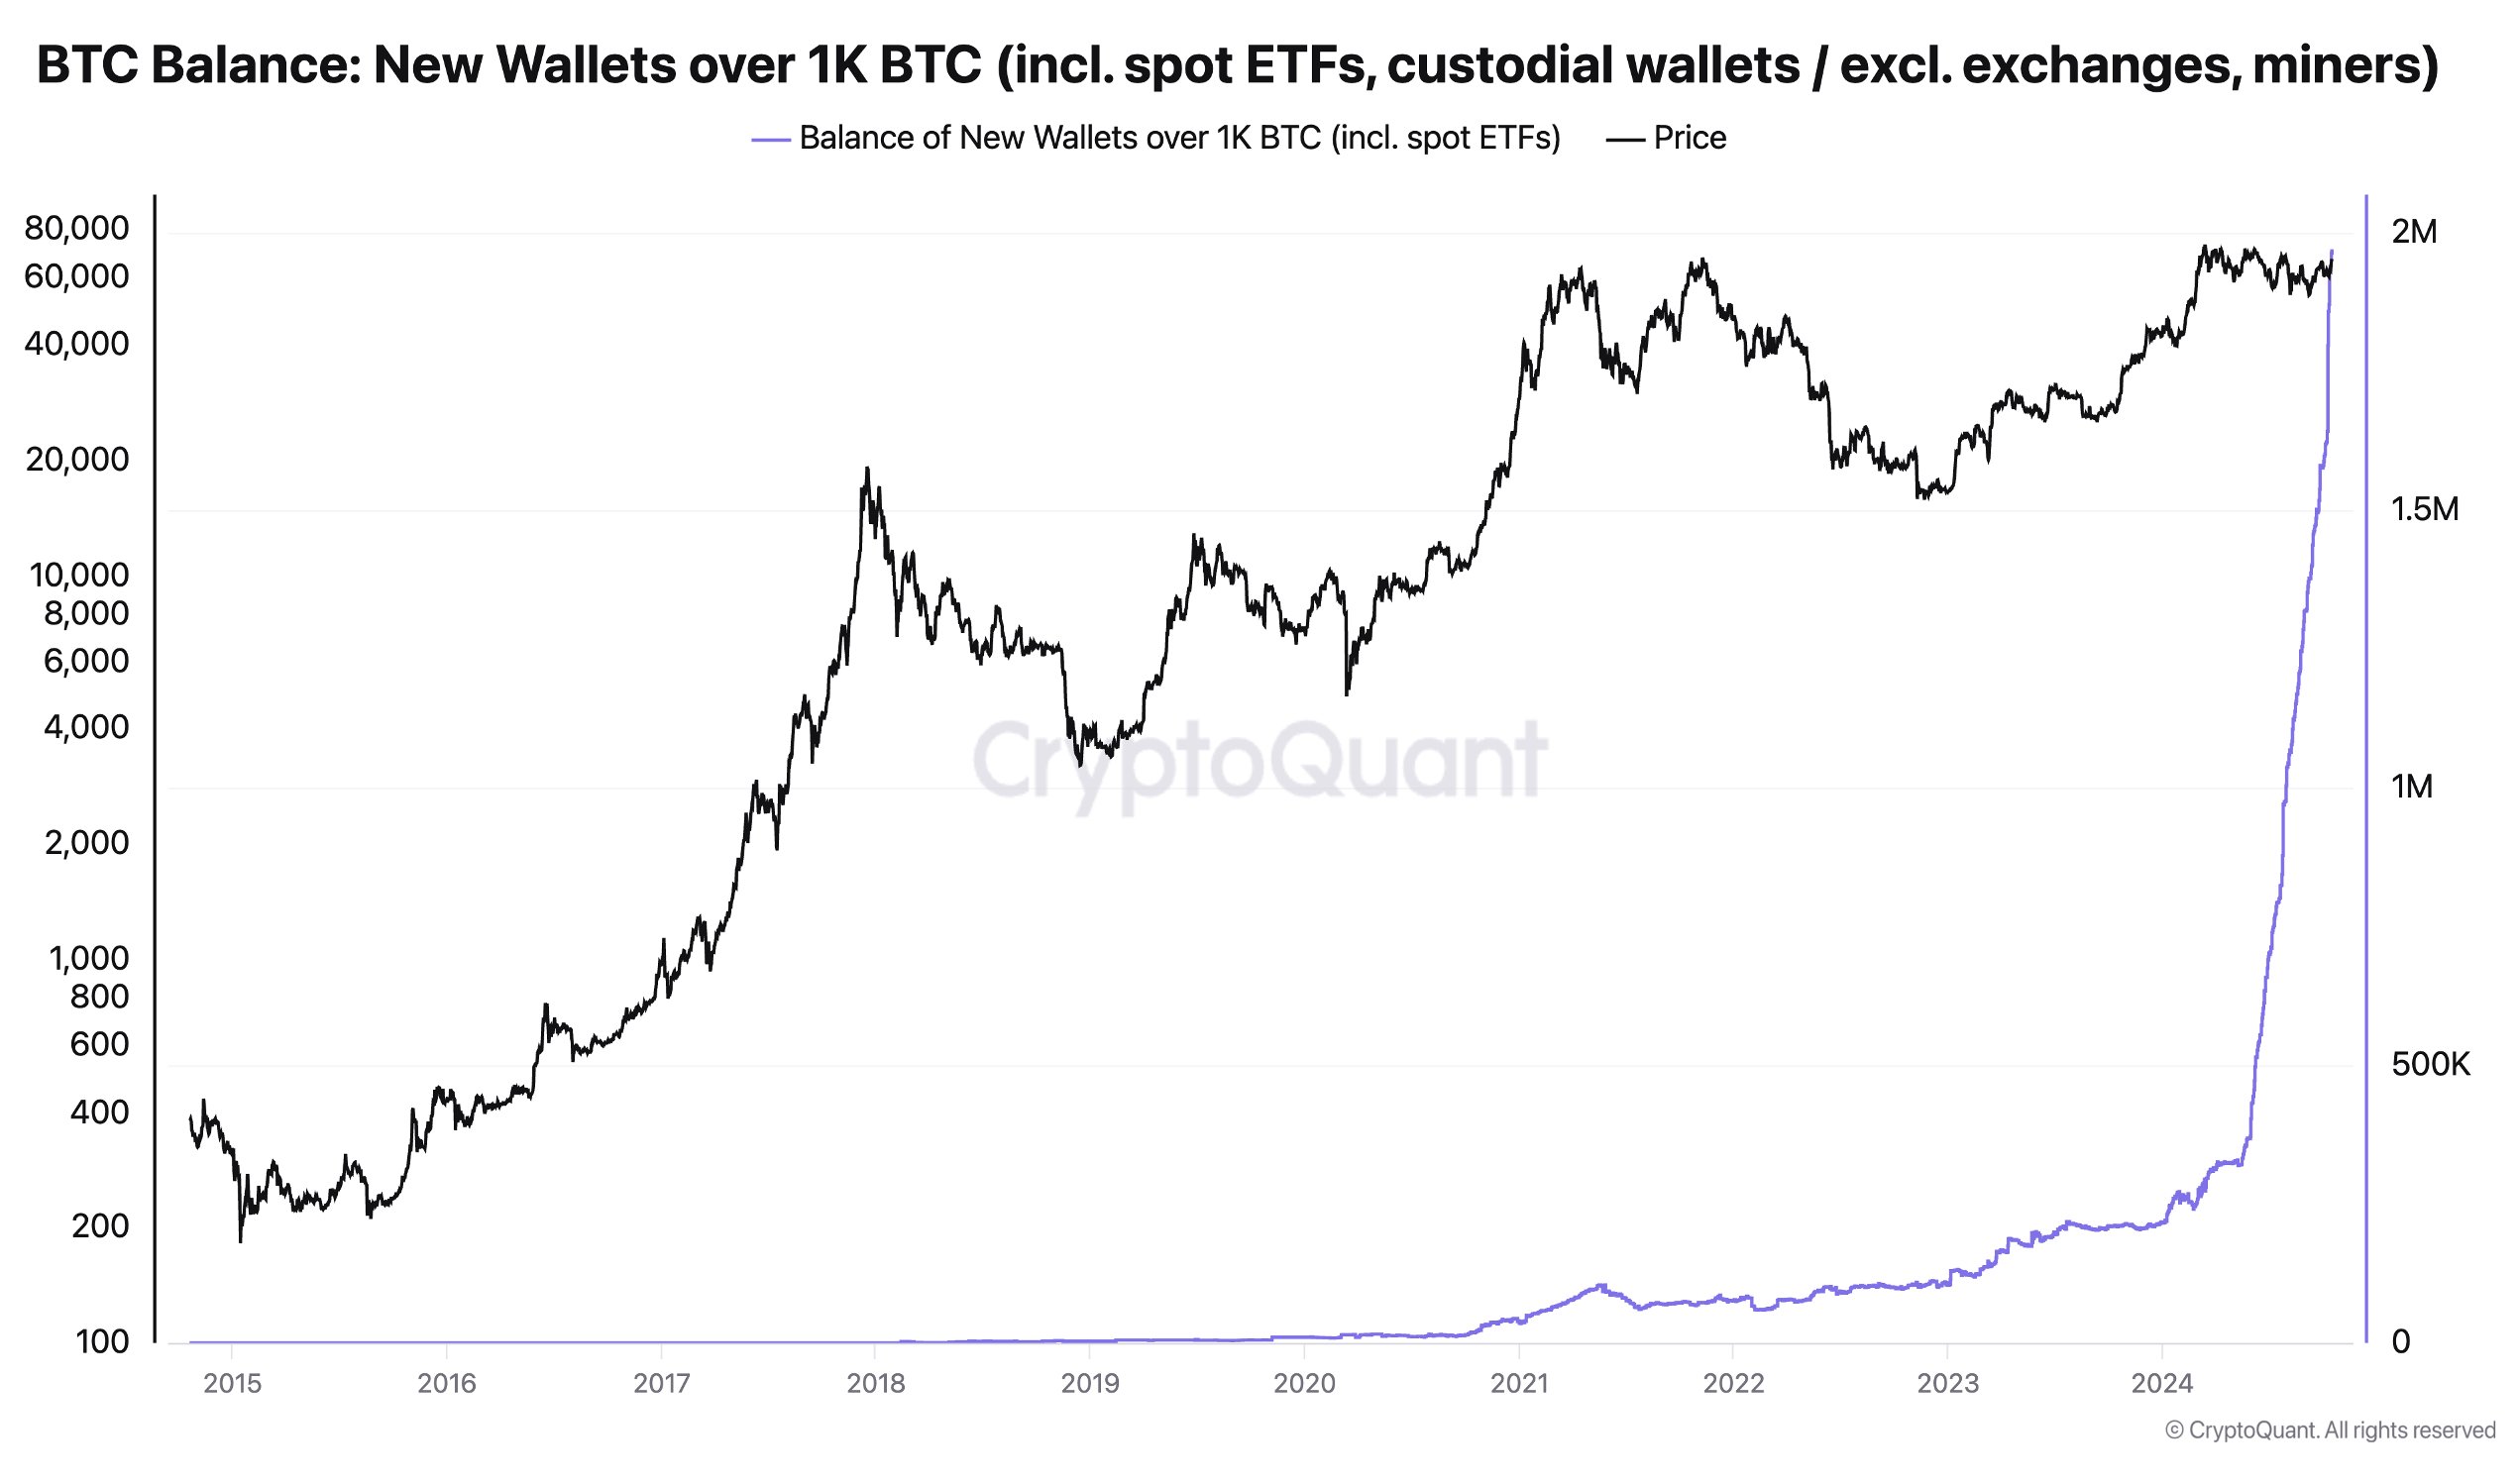
Recent data from CryptoQuant reveals an exponential increase in the balances of new Bitcoin whales. Specifically, the report states that these entities now hold 1.97 million BTC tokens valued at $132 billion. These wallets contain over 1,000 Bitcoin each, with an average coin age of under 155 days. 

With the current figures, their BTC balance has surged by 813% year-to-date (YTD), making up 9.3% of Bitcoin’s total supply. Notably, the metric excludes exchange and miner wallets, indicating that investors are likely individuals using self-custodial services. 

Image

Ki Young Ju, CEO of CryptoQuant, shared these insights via a post on X. He expressed initial skepticism due to the sheer scale of the numbers. He likened the situation to institutional investors acquiring an additional 8.2% stake in a firm named “Bitcoin” within a year.

Atmosphere Becoming More Mature

Young Ju ultimately noted that Bitcoin is no longer seen as a gambling tool amid the increased accumulation, highlighting the growing maturity of the market atmosphere.

The rise of these wallets has sparked questions within the crypto community. Some users questioned if monitoring these addresses for signs of selling could indicate market tops. In response, Young Ju explained that whale accumulation is more useful for identifying market bottoms rather than tops. In parallel, he suggested that retail investor activity, which highlights overheated markets, is a better indicator for predicting peaks.

Furthermore, another commenter raised the possibility that older whales could be transferring their assets to new addresses for security purposes. Young Ju clarified that while such transfers could happen during wallet upgrades, the transaction input data from 2024 did not show significant changes to support this theory. This reinforced the belief that the surge is due to institutional entries.

Bitcoin Market Profitability 

As new whale activity rises, data from blockchain analytics firm IntoTheBlock shows that 95% of Bitcoin addresses are now in profit, suggesting strong bullish momentum. This level of profitability has historically been a precursor to price breakouts, though it could also indicate that the market is becoming overheated. 

IntoTheBlock’s data also revealed that 3% of holders are currently breaking even, while only 2% are experiencing losses as the price remains above their purchase point. The firm questioned whether the market’s current state would lead to further gains or signal a potential overextension.

Historical Patterns and Future Projections

Additionally, amid the whale activity, an analyst has been looking at historical price patterns to forecast future movements. Crypto trader and market analyst Mags recently shared an analysis suggesting that Bitcoin’s price could surpass the $200,000 mark if past trends related to the Relative Strength Index (RSI) and Bitcoin halvings repeat. 

Bitcoin’s price reached its all-time high of $69,000 after the 2020 halving but corrected significantly in 2022, dropping to around $15,000. Following the April 2024 halving, the price has steadily recovered, though it has experienced consolidation in recent months.

Mags noted that Bitcoin typically reaches its cycle peak when the RSI surpasses 90, indicating overbought conditions. During past cycles, this has coincided with price surges following halving events. Currently, Bitcoin’s RSI remains in the mid-60s, suggesting that the market has not yet reached its peak for this cycle.

SUI Price Holds $2, Rising Channel Targets $3 Resistance

Will the rising channel in SUI lead the price rally to $2.45 and set the stage for a breakout run to $3?

With the altcoin finding the attention of smart money before the crypto bull run, SUI is poised for a massive rally. Surpassing the $2 mark, a post-retest in SUI teases a 50% surge to $3. 

Will the altcoin sustain a price jump to $3 as the MACD indicator remains uncertain?

SUI Crypto Technical Analysis

With a 3.71% jump in the past 24 hours, SUI is close to achieving the $6 billion market cap milestone. Currently, the market cap stands at $5.81 billion, with a 24-hour trading volume of $928 million.

SUI price chart
SUI price chart

At press time, SUI is trading at $2.1070, with an intraday gain of 1.15%, following last night’s bullish reversal of $1.9745. This increases the possibility of a Morning Star pattern in the daily chart as SUI retests the $2 breakout. 

The 20-day EMA continues to provide dynamic support as the uptrend gains momentum. A break below the 20-day EMA will likely result in a price drop to the 78.60% Fibonacci level at $1.7492 in the daily chart.

SUI price chart
SUI price chart

On closer inspection, the SUI price action in the 4-hour chart reveals a rising channel pattern. Currently, the rising channel pattern has retested the crucial zone near the $2 psychological mark, near the support trend line. 

Is The $3 Price Target on SUI’s Radar?

The MACD indicator shows the average line ready for a bullish crossover in the 4-hour chart, supporting the possibility of a bullish reversal. 

With a double bottom reversal near the support trend line, the SUI price action is starting a new positive cycle within the channel. This increases the possibility of a new all-time high formation closer to the $2.45 mark or the overhead resistance trend line. 

However, the SUI price action must surpass the overhead trendline for an extended rally. Based on the Fibonacci level in the daily chart, the uptrend can reach $3 at the 1.618 level. 

Analyst Awaits Bitcoin Monthly Breakout Candle for Potential Multi-Month Rally

0

Analyst Aksel Kibar predicts a potential multi-month Bitcoin uptrend if key resistance levels break, citing historical breakout patterns.

Bitcoin has experienced a volatile week, moving from a sharp decline to a significant recovery. After dipping below $59,000 last Thursday, the crypto rebounded to reach a multi-month high of $68,000.

This surge was followed by a brief drop, stabilizing around $67,000. Amid the ongoing movements, some analysts now anticipate further gains while others warn of possible downturns.

Key Price Movements and Historical Patterns

Chartered Market Technician Aksel Kibar highlighted key moments in Bitcoin’s price history, identifying critical levels that could influence future trends.

His analysis focuses on several “Minor Highs,” points where Bitcoin previously encountered resistance and either consolidated or retraced. These include peaks originating from 2013 and the well-known 2017 high of $20,000.

Notably, Kibar pointed to the significance of “Breakout Candles” in Bitcoin’s monthly chart, such as the breakout near $1,000 in 2016, which triggered a rally toward $20,000 in December 2017.

He now anticipates another similar breakout, signaling a potential multi-month uptrend if Bitcoin breaches key resistance levels. This aligns with his earlier September observation that Bitcoin’s refusal to pull back from its all-time high and tight consolidation is a strong indicator of further upward movement.

Whale Activity & Market Shifts

Recent data from market intelligence platform Santiment supports the notion of a bullish trend, as whale transactions have reached a ten-week high. On Tuesday alone, the market recorded 11,697 transfers worth over $100,000, and Wednesday appeared to be on track for similarly high volumes.

This uptick in large transactions is usually a signal that institutional investors or large holders are preparing for a market trend shift, either through accumulation or repositioning of significant amounts of Bitcoin.

Additionally, Santiment reported an increase in Bitcoin’s dominance in social media discussions, accounting for over 25% of all crypto-related conversations. 

According to Santiment, the recent spike in whale transactions and increased social media dominance suggest that the rally may be temporarily paused due to profit-taking by key stakeholders and heightened retail FOMO.

Despite this, mid and long-term metrics remain bullish, indicating that any potential price correction is expected to be brief.

Diverging Analyst Views

Despite the optimism surrounding Bitcoin’s recent performance, not all analysts are aligned on future prospects. Analyst Rekt Capital pointed out that while Bitcoin successfully surpassed its August peak, it now faces significant resistance at the top of a long-term downward channel. 

Rekt Capital warned that should Bitcoin fail to close above this resistance zone, it could face a correction of up to 30%, potentially dragging the price down to $47,000. The pattern of progressively deeper corrections, starting from a 17% decline in March to the most recent 29% drop, suggests a similar pullback could occur if the resistance remains intact.

Peter Brandt: $72K is Key for Bitcoin to Validate Higher Price Targets

0

While the ongoing Bitcoin uptrend continues to endure, the leading crypto asset is at a critical decision point.

Seasoned market watchers are highlighting factors that could confirm a further upswing or signal the onset of another severe bearish market.

In a post on X, global macro investor Raoul Pal warned market participants not to get ahead of themselves by discussing extreme price targets for Bitcoin. He noted that the danger is not over until Bitcoin convincingly breaks the key psychological price level of $70,000.

Pal is cautioning against over-optimism until Bitcoin demonstrates solid upward momentum by surpassing $70,000. His warning came after Bitcoin first reclaimed $65,000, having tested the $58,000 channel earlier.

Veteran Analyst Says $72K Is Critical

While Pal targets $70K, veteran market watcher Peter Brandt argues that Bitcoin needs to cross over $72,000 before speculations for higher price targets become valid. Otherwise, the market may experience a significant correction following the one-month-long uptrend.

In an analysis yesterday, Brandt highlighted that Bitcoin is in a “window” where it must either break through or risk having the window slammed shut. The chart illustrates how Bitcoin has faced resistance each time it approached the $70,000 target over the last seven months.

Specifically, it showed that during each failed attempt since the March peak to surpass the long-term trendline, Bitcoin underwent a significant downturn. Interestingly, each retracement has been more intense than the previous one, while the rebounds have been weaker.

For instance, after hitting $73,750, Bitcoin crashed to $60,000, rebounded to $71,500, then fell again to $56,500, surged above $68,000, and subsequently plummeted to $53,400. In the most recent case, Bitcoin tanked to $49,000 after recovering from the low of $53,400.

Image

Bitcoin At Risk of 30% Collapse

Now that Bitcoin reached $68K yesterday, it has entered a problematic zone where it could either continue its upward trajectory or experience a significant decline, consistent with past trends.

Analyst Rekt Capital expressed a sentiment similar to Brandt’s in a separate analysis. He argued that the danger would be averted if Bitcoin could close this week above $68,000. Failure to do so risks a price crash of over 30% from the current level.

Interestingly, intelligence platform Santiment has cautioned that overheated calls for the $70K level for Bitcoin are in themselves a bearish signal. This is because the market’s direction tends to oppose the popular optimism in the community.

Notably, Bitcoin is preserving its recently accrued gains, reaching $68,375 as of Wednesday evening. Following a minor pullback, the leading cryptocurrency is hovering around $67,500 at press time, just 3.7% away from hitting $70,000.

BONK Targets $0.000041 as Double Bottom Fuels Breakout Rally

With meme coins crowding the top performers’ spot, will BONK hit the $0.000041 mark this October?

As the crypto market is poised for a bull run, meme coins are back in the game. Spearheading the bull market, trending meme coins like BONK showcase massive upside potential. 

Breaking above crucial resistance levels amid bullish patterns, BONK teases a bull run to $0.000041. 

BONK Breakout Rally

In the daily chart, the BONK price action reveals a trend-reversal rally resulting in a breakout event. With a bullish reversal from $0.000001567, the meme coin is back in action. 

Following last night’s 8.59% jump, an engulfing candle marks a breakout event. The meme coin surpasses a long-coming resistance strain line of a falling channel pattern. 

BONK price chart
BONK price chart

Over the past seven days, the double-bottom reversal has resulted in a 25% surge in Bonk from $0.000001917 to the current market price of $0.000002395. Furthermore, the bullish reversal from $0.000001567 forms a rising wedge pattern. 

Within the rising wedge, Bonk shows a double-bottom at $0.000001984. Despite the neckline breakout at $0.00002404 BONK struggles to surpass the overhead trend line near the 38.2% Fibonacci level at $0.000002265.  

On the technical side, the MACD and signal lines give a bullish crossover, teasing an uptrend. 

Where’s BONK Price Headed?

The bull run may likely continue with the buyers anticipating a bullish post-retest reversal near the 50% Fibonacci level at $0.0000025. Optimistically, the rising wedge breakout rally is expected to reach the peak of the falling channel at $0.00004109. 

Supporting a bullish trend, analyst ASTEKZ shared a post about a trendline breakout rally gaining momentum in BONK. Based on the price chart shared by ASTEKZ, the next price targets are $0.0000035, $0.0000048, and $0.0000070.

On the contrary, an intraday pullback of 1.07% and a higher price rejection in the meme coin warn of a negative cycle within the rising wedge. Nevertheless, the negative cycle will likely come as a potential retest of the broader falling-channel-pattern breakout.