Home Blog Page 119

Hoskinson Warns Cardano Risks Losing Its Science Coin Identity

Charles Hoskinson has warned that rejecting a major funding proposal could weaken the scientific foundation that has defined Cardano for more than a decade. 

His remarks surfaced during a community debate over decentralized governance after some Japanese delegated representatives (dReps) voted against a key research proposal submitted by Input Output Global (IOG). 

Key Points

  • Charles Hoskinson warned that rejecting a major research funding proposal could weaken Cardano’s scientific foundation. 
  • The Cardano founder revealed that Japanese delegated representatives voted against a research proposal submitted by Input Output. 
  • The disputed proposal is titled “Cardano Vision 2026: Human Centered, Scalable, Post Quantum Secure – IO Research.”
  • Currently, over 82% of votes oppose the proposal, while only 17.68% support it ahead of the June 8, 2026 deadline.  

Japanese dReps Vote Against IOG Research Proposal 

The controversy began when Hoskinson disclosed that several Japanese delegated representatives (dReps) had voted against a proposal connected to Cardano’s scientific research initiatives. 

Consequently, he warned that failure to approve the proposal could force the closure of Cardano’s research lab and trigger the departure of its scientists.

In response, a Cardano community member, Tony, acknowledged the importance of funding research. However, he argued that decentralized governance naturally allows outcomes that may conflict with Hoskinson’s preferences. Additionally, he suggested that dRep governance remains in its early stages and that disagreements are part of the maturation process.

Hoskinson Defends Cardano Scientific Identity 

In response, Hoskinson rejected claims that the issue revolved around his personal interests. Instead, he framed the debate as a broader fight to preserve Cardano’s identity as a research-driven blockchain network.

Furthermore, he stressed that Cardano earned its reputation as the crypto industry’s “science coin” through more than a decade of development and hundreds of millions of dollars invested in peer-reviewed research and academic rigor. Therefore, he argued that the ecosystem should not abandon that commitment by rejecting IOG’s research proposal. 

IOG’s Research Proposal 

The debate emerged weeks after IOG’s research division submitted a proposal titled “Cardano Vision 2026: Human Centered, Scalable, Post Quantum Secure – IO Research.”

According to the proposal, the initiative seeks funding for research, prototypes, technical specifications, and related work focused on scalability, cryptography, post-quantum security, human-centered design, and other foundational technologies for Cardano.

At the time of writing, the proposal continues to face strong opposition. Currently, 82.2% of voters oppose the proposal, while only 17.68% support it. Voting is expected to conclude on June 8, 2026.

IO Research Proposal

Meanwhile, scientific research has remained central to the Cardano brand since the network launched. Unlike many competing blockchain projects, Cardano built its reputation around peer-reviewed research, formal verification, and academically grounded development practices. As a result, supporters often describe the network’s approach as slower but ultimately more secure and sustainable.

With several Japanese dReps voting against IOG’s research proposal, Hoskinson believes the ecosystem risks weakening the very characteristic that distinguishes Cardano from rival blockchain platforms. 

Analyst Says XRP Will Shake You Out This Week, Then the Breakout Will Begin

A well-known market expert has suggested that XRP will likely shake investors out this week before it secures the much-anticipated breakout.

This commentary came from MichaelXBT, who has maintained a bullish stance on XRP despite persistent price struggles. Notably, data from his chart indicates that XRP currently trades within a falling wedge structure, and a breakout could be imminent.

Key Points

  • XRP has collapsed 62% from its July 2025 all-time high, trading for $1.37 amid the market-wide downtrend.
  • This downward price action has led to the formation of a falling wedge structure on the weekly chart.
  • Having traded within this wedge since July 2025, XRP has now hit the apex of the structure.
  • MichaelXBT believes a breakout will occur soon, but not before the market shakes out investors with less conviction.

XRP Stuck Within Falling Wedge

For context, XRP claimed a $3.66 all-time high in mid-July 2025 after building a rebound campaign that began the previous month. However, following the all-time peak, the crypto asset suffered a pullback even before the broader market downturn began in October 2025.

By October, XRP had already dropped 22% from the ATH price, and the market-wide collapse added to this decline. Since then, XRP has recorded lower highs, unable to mount a strong enough rebound effort to break the persistent downtrend.

Data from MichaelXBT’s chart confirms that the downward push resulted in the formation of a multi-month falling wedge on the weekly chart. 

XRP 1W Chart MichaelXBT
XRP 1W Chart | MichaelXBT

For the uninitiated, a falling wedge is a bullish chart pattern where price trends downward within two narrowing, downward-sloping lines. It shows decreasing selling pressure and typically precedes a breakout to the upside when the price moves above the upper boundary.

Notably, the upper boundary, which acts as a strong resistance area, has capped XRP’s upside struggles. The asset attempted to breach it multiple times from September to October 2025, around the $3 mark, but failed each time. Another attempt in January 2026 also failed at the $2.41 price. 

“XRP Will Shake You Out, Then Breakout Will Begin”

Now, XRP has moved to the apex of the falling wedge, indicating that a breakout may be imminent. However, MichaelXBT believes the market will shake out multiple investors with less conviction first.

Notably, this pattern has played out across several cycles, where market participants, mostly retail investors, panic-sell and miss out on the imminent upside. Market analyst Chart Nerd called attention to this phenomenon in a March report, arguing that XRP’s next price action could “crumble” most retail investors.

MichaelXBT suggests that this may happen sooner than most expected, claiming that XRP could shake out investors without conviction this week. “Then the breakout will begin,” he added. According to him, this is the design of the market structure, as market makers “want the masses out.”

Chart data shows that XRP would have to push above the $1.50 price area to successfully breach the upper resistance trendline of the falling wedge. Matt Hughes, another well-known market commentator, highlighted this area in a recent analysis, suggesting that XRP would only be ready for a breakout after closing above $1.51.

Kraken and Coinbase User Loses $6.7M in Crypto Theft as Funds Move Through Tornado Cash

A crypto user has lost around $6.7 million in digital assets after attackers drained funds from accounts linked to both Kraken and Coinbase.

The incident, highlighted by Wu Blockchain, showed large withdrawals of ETH, BTC, and cbBTC from the victim’s exchange accounts.

Key Points

  • A Kraken and Coinbase user lost $6.7M after hackers drained ETH, BTC, and cbBTC from exchange accounts.
  • On-chain analyst Specter tracked the stolen assets to wallets linked to fast-moving laundering transactions.
  • Attackers allegedly moved about $5.3M through Tornado Cash shortly after the theft.
  • The incident adds to growing concerns over phishing, malware, and targeted attacks on crypto holders.

Millions Drained From Kraken and Coinbase Accounts

According to Specter, the victim’s Kraken account saw withdrawals totaling 1,554 ETH worth about $3.3 million, alongside 10.5 BTC. At the same time, attackers withdrew 34.1 cbBTC worth roughly $2.6 million from Coinbase.

The stolen funds were traced to the following wallet addresses:

  • Ethereum address: 0xd…79982A
  • Bitcoin address: bc1…6nqv3

Initial reports suggested the theft may have resulted from a physical attack targeting the account holder. However, Specter later updated the assessment, stating the incident likely did not involve physical coercion.

Image

$5.3 Million Allegedly Laundered Through Tornado Cash

Blockchain analysis showed that the attackers quickly moved a significant portion of the stolen assets through Tornado Cash, a crypto mixer frequently used to obscure transaction trails on Ethereum.

Specter claimed that approximately $5.3 million had already been deposited into Tornado Cash. In other words, the attacker moved to launder the funds shortly after the theft.

Meanwhile, the analyst did not provide additional details on how the attackers may have gained access to the victim’s exchange accounts. However, the incident adds to concerns over account security and targeted crypto thefts involving centralized exchanges.

Security Concerns Continue to Rise

The case highlights ongoing risks for high-value crypto holders as attackers exploit compromised credentials, phishing, malware, and social engineering to gain access to exchange accounts.

Notably, Kraken and Coinbase offer security measures such as two-factor authentication, withdrawal protection tools, and account whitelisting features. Yet, sophisticated attacks continue to affect users across the industry.

Here are Multiple Occasions Where Bitcoin Was Declared Dead Due to Black Swan Events

Crypto market commentator Mikkybull recently highlighted several moments in Bitcoin history when investors believed the asset had finally failed. 

Over the years, wars, exchange failures, government bans, hacks, and sudden market crashes have pushed Bitcoin into deep declines, prompting the “BTC is dead” sentiment. However, each major setback eventually led to another recovery.

Key Points

  • Bitcoin has undergone multiple black swan events, including the Mt. Gox hack, the China crackdown, and the Terra collapse.
  • Each time these events led to sharp declines in Bitcoin’s price, the “BTC is dead” sentiment emerged.
  • Bitcoin has recovered considerably from each of these declines, often posting new highs.
  • Currently, BTC continues to suffer a sustained downturn, but analysts insist a recovery is imminent.

The First Bitcoin Cycle Endured the Mt. Gox Hack

Mikkybull shared a timeline covering seven Bitcoin cycles between 2009 and 2026. Data shows that despite repeated panic across the market, Bitcoin continued to rebound after each black swan event and later reached new highs.

Bitcoin’s first major cycle began in October 2009 and lasted until June 2011. During this period, BTC rose from $0.0008 in October 2009 to $31.91 in June 2011, recording a gain of 3,989x. The cycle included Bitcoin’s first known market price and the moment BTC reached parity with the US dollar in February 2011.

The rally later suffered a major blow after the Mt. Gox hack. Specifically, around June 19, 2011, hackers gained access to auditor credentials connected to Mt. Gox, which handled about 70% of Bitcoin trading at the time. 

The attackers flooded the exchange with fake sell orders, crashed Bitcoin’s price from around $17 to $0.01, and stole roughly 2,000 BTC. 

Notably, earlier database leaks and smaller theft incidents had already weakened trust in the platform. The incident eventually pushed Bitcoin down by 93% to around $2 and led many people to believe the asset would not survive.

The First Bitcoin Halving Cycle Faced China’s Crackdown

Bitcoin entered another major cycle in November 2011 after dropping to around $2. From there, BTC climbed to $1,127 in November 2013, marking a gain of 56,250%. The market gained strength after Bitcoin completed its first halving in November 2012. 

Bitcoin Black Swan Events Mikkybull
Bitcoin Black Swan Events | Mikkybull

Demand also increased during the Cyprus banking crisis as some investors turned to Bitcoin as an alternative to the traditional banking system.

However, the rally later ran into another major setback when China tightened restrictions on Bitcoin. In December 2013, the People’s Bank of China and other regulators banned financial institutions and payment companies from handling Bitcoin transactions due to concerns about risks and legal status. 

BTC China, then the country’s biggest exchange, stopped accepting yuan deposits. The move triggered an 87% Bitcoin crash and renewed claims that Bitcoin was finished.

2017 ICO Mania

Bitcoin’s next major cycle started in August 2015, when the price traded around $185. BTC later climbed to $19,665 in December 2017, resulting in a 10,530% gain. The market recovered from the aftermath of the Mt. Gox collapse, and Bitcoin’s second halving in July 2016 added momentum to the rally. 

Meanwhile, the broader crypto market entered the ICO boom, with hundreds of projects raising billions of dollars despite offering little real-world use.

The bubble eventually burst as regulators increased pressure on the industry. Scams, hacks, and capital outflows also added to the decline. In 2018, companies like Facebook, Google, and Twitter banned crypto-related advertising, while China and South Korea introduced stricter rules for digital assets. 

Bitcoin fell from nearly $19,783 in December 2017 to $3,200 by late 2018. Across the crypto market, losses exceeded $700 billion. This made the collapse even steeper than the dot-com crash in relative terms.

Bitcoin then started another recovery phase from its December 2018 low of around $3,200. The asset later reached a record high of $69,044 in November 2021, giving investors a 2,058% gain. 

Bitcoin’s third halving in May 2020 and growing institutional interest from MicroStrategy (now Strategy), Tesla, and El Salvador supported the rally. Despite this, Bitcoin later dropped 77% to $15,479 during the next bear market.

The Terra and FTX Implosions

Bitcoin’s next cycle began in November 2022 with BTC trading around $15,479. The cryptocurrency later climbed to $126,198 in October 2025, producing a gain of 715%. 

The recovery came after the severe market damage caused by the Terra collapse in May 2022, which triggered the failure of firms such as Three Arrows Capital, Celsius, and Voyager. Conditions worsened in November 2022 following the FTX collapse. 

Bitcoin later regained strength after spot Bitcoin ETFs received approval in January 2024, while the fourth Bitcoin halving also supported the rally. 

The Oct 10 Crash and US-Iran Conflict

However, another major shock hit the market in October 2025 during what analysts called the biggest liquidation event in crypto history. Specifically, on Oct. 10, 2025, Bitcoin dropped to $101,500 from above $122,000. 

Reports linked the sell-off to President Donald Trump’s announcement of 100% tariffs on Chinese imports and new software export controls. 

The news triggered a broad risk-off reaction across markets, pushed the S&P 500 down by more than 2%, wiped out 1.6 million traders within 24 hours, and caused roughly $19.16 billion in liquidations, most of them long positions. Bitcoin later recovered toward the $112,000 level.

Another major shock arrived in February 2026 as tensions rose between the United States, Israel, and Iran. On Feb. 28, US-Israel strikes targeted Iranian nuclear and military sites as well as senior leadership figures, including Ayatollah Ali Khamenei. 

The escalation led to panic selling across global markets. Bitcoin fell from $67,000 to a low of $63,000. The crisis also caused roughly $1.07 billion in crypto outflows. Despite the fear in the market, Bitcoin has now recovered to the current price of $77,382.

Ethereum Price Analysis: Several Factors Point to a Bearish Breakdown

0

Analysts have turned bearish on Ethereum amid a breakdown in its technical structure, with other market dynamics adding further pressure.

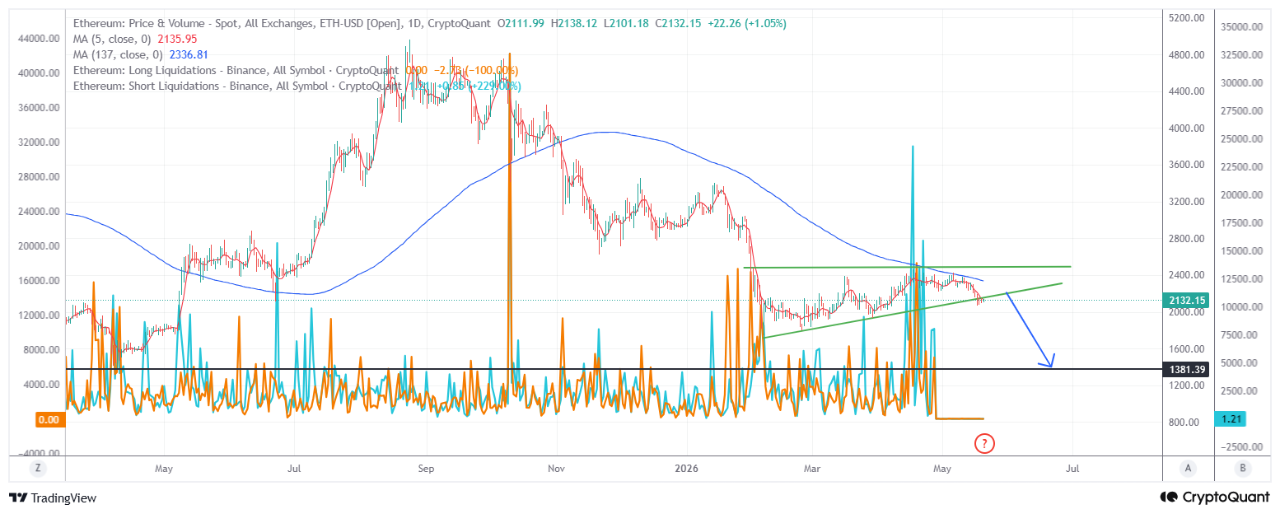
CryptoQuant’s verified author Pelin Ay is one analyst fronting this narrative. In her recent market outlook, she noted that Ethereum (ETH) has confirmed a bearish breakdown and could potentially trend lower.

Key Points

  • Ethereum (ETH) has confirmed a bearish breakdown and could potentially trend lower.
  • The asset slipped below a key multi-month ascending triangle pattern.
  • Ether also remains below key moving averages, further pressuring prices.
  • Several long liquidation spikes have occurred recently without a following price rebound.

Ethereum Breaks Down from Triangle

The commentary noted that Ethereum’s recent price action paints a weaker picture after the asset slipped below a key ascending triangle pattern. Ether has consolidated within this structure since early February, building momentum for the next directional move.

However, recent pullbacks have seen ETH breach the lower support, dropping to $2,077 on Monday before a brief recovery. The breakdown has now shifted momentum towards bears, and unless a recovery occurs imminently, it will continue to put pressure on the asset’s price.

Ethereum Triangle Breakdown/Pelin Ay

MAs Further Mounts Pressure

Ethereum is currently hovering near $2,124, almost unchanged in the past 24 hours. It remains below key moving averages, further pressuring prices.

For context, Ether trades well below the 200D MA at $2,576 and the 137D MA at $2,337. These moving averages have also begun to curve downward, which often reflects fading momentum across the broader market.

At the same time, the short-term average remains below the long-term trend line. That setup suggests buyers are still struggling to regain control, with upward price moves ending up as relief rallies due to insufficient drive.

Unless Ethereum reclaims the broken triangle and key moving averages, the outlook remains heavily bearish. The analyst predicts a drop to the next key support at $1,350, representing a 36% decline from the current price.

Binance Liquidation Data Confirms Bearish Outlook

Another important signal comes from the liquidation activity on Binance, as visible on the chart. The analyst highlighted that this was important because a significant portion of Ether’s derivative volume comes from the leading crypto exchange.

The metric shows that several long liquidation spikes have occurred recently, as Ethereum has failed to sustain an upward move. However, despite those aggressive derivative liquidations, Ether has not responded with a substantial price rally. Instead, prices have trended lower, further flushing out bulls and signaling a downward reset.

The reaction often points to underlying weakness, as selling pressure continues to outweigh recovery attempts. Additionally, it suggests that institutional and large-scale market participants are unwinding their positions.

A parallel analysis from Ali Martinez confirms this. He noted that about 60 whales holding at least 10,000 ETH have emptied or significantly reduced their balance over the past two months, highlighting institutional repositioning.

With the Ether whale count dropping and massive exchange inflows recently recorded, the asset is seeing strong selling pressure at the moment.

21Shares Hyperliquid ETF Volume Surges 8x to $14M Within Days of Going Live

0

Bloomberg ETF analyst Eric Balchunas has highlighted the strong early performance of the 21Shares Hyperliquid ETF (THYP). 

According to Balchunas, the ETF’s daily turnover has already surged to tens of millions of dollars, nearly eight times its first-day trading volume.

Key Points

  • The 21Shares Hyperliquid ETF’s daily trading volume surged to approximately $14.08 million just days after launch.
  • The ETF’s turnover has skyrocketed 682% from its opening-day volume of roughly $1.8 million.
  • Since launch, THYP’s share price has rallied 20.39%, climbing from about $23.49 to over $28.28.
  • Goldman Sachs recently expanded its exposure to the Hyperliquid ecosystem by purchasing 654,630 shares of Hyperliquid Strategies Inc. 

21Shares Hyperliquid ETF Sees Strong Early Debut 

In an X post today, Balchunas highlighted THYP’s growing trading activity as a strong sign of organic investor interest. He noted that the ETF’s daily volume has expanded significantly since its debut.

The accompanying screenshot supports his claim. THYP launched on May 12, posting a first-day trading volume of $1.8 million. Although the ETF trailed other crypto-related launches, such as Bitwise’s Solana Staking ETF (BSOL), which generated $56 million in day-one volume, many market participants still viewed THYP’s debut as a solid start.

Since launch, THYP’s daily volume has climbed steadily to around $14.08 million, marking a 682% increase from its opening-day volume. Rising trading activity is important because it signals sustained investor participation and improved liquidity rather than a short-lived speculative surge.

THYP Share Price Climbs

Meanwhile, THYP’s share price has also recorded strong gains since launch. Over the past week, the ETF has risen 20.39%, climbing from a unit price of $23.49 to above $28.28. 

Image

For context, the 21Shares Hyperliquid ETF offers investors exposure to the Hyperliquid ecosystem, a rapidly growing platform in crypto derivatives markets. Notably, 21Shares confirmed that each THYP share physically backs HYPE tokens.

To strengthen its position in the emerging Hyperliquid ETF market, 21Shares set THYP’s management fee at 0.30%, slightly below Bitwise’s 0.34%. 

Goldman Sachs Gains Exposure to Hyperliquid Ecosystem 

Hyperliquid has continued to attract attention for its dominance in on-chain perpetual futures trading and its ability to capture a significant share of sector-wide fees. At press time, HYPE ranks as the 10th biggest cryptocurrency, valued at $12.95 billion. 

The ecosystem recently received a major boost after Goldman Sachs reduced its exposure to XRP and Solana while acquiring a stake in Hyperliquid Strategies Inc., a Nasdaq-listed digital asset treasury company focused on the Hyperliquid ecosystem.

Specifically, Goldman Sachs’ 13F filing shows it acquired 654,630 shares of Hyperliquid Strategies, valued at approximately $3.3 million at the time of purchase.

XRP Will Only Be Ready for a Breakout After Closing Above This Crucial Resistance 

XRP would only be ready for a breakout once it starts seeing weekly and monthly closes above a crucial resistance mark.

This is according to a recent analysis from well-known market commentator Matt Hughes (“The Great Mattsby”). Hughes confirmed that XRP does have a breakout-ready setup, but remains stuck under the $1.51 resistance. He believes a close above this mark would set the stage for the breakout.

Key Points

  • XRP has faced declines alongside the broader crypto market, down more than 25% this year to trade at $1.37.
  • Chart data shows XRP has consistently faced a roadblock at Fib. 0.5 aligning with the $1.51 price.
  • Hughes believes XRP could begin its breakout push once prices breach the $1.51 resistance mark.
  • A separate analysis suggests this breakout could push the XRP price to a new all-time high of $15.

XRP Facing Resistance at Fib. 0.5

Notably, Matt Hughes agrees that XRP’s current setup looks breakout-ready, but he insists that until it breaches the Fibonacci 0.5 retracement, this breakout may not begin.

For context, this level, which aligns with the $1.51 XRP price, has consistently acted as a roadblock to XRP’s upward push on numerous occasions over the past four months, especially after the market-wide collapse earlier this year.

Notably, after XRP dropped to the $1.1 floor price on Feb. 6, it staged a recovery push alongside the rest of the market. This push allowed it to recover some of the losses of the market crash, but after breaching $1.51 to reach $1.66 a week later, XRP failed to sustain the momentum and eventually collapsed below $1.51.

The asset made another attempt to hold above this area in March following the escalation of the U.S.-Iran conflict. However, after the price hit $1.60 on March 17, XRP collapsed again, falling below the $1.51 area. 

XRP 1M Chart Matt Hughes
XRP 1M Chart | Matt Hughes

Meanwhile, this month, XRP attempted to overcome the resistance level but has again collapsed after reaching $1.54 on May 14. With XRP currently changing hands at $1.37, Hughes believes that, while its setup looks promising, it must start recording weekly and monthly closes above $1.51 before a breakout can occur.

XRP Price Targets Beyond $1.51

Notably, Hughes’ analysis came as a response to a recent market exposition from Celal Küçüker, another prominent market expert. 

Specifically, Küçüker suggested in his analysis that XRP “looks massive for a breakout,” calling attention to a descending trendline on the 1-week chart that has capped the asset’s upside momentum since it dropped from the $3.6 all-time high in July 2025. 

XRP 1W Chart Celal Kucuker
XRP 1W Chart | Celal Kucuker

Since then, XRP has continued to record lower highs, leading to the formation of the trendline, which has acted as a resistance area. With XRP now close to the apex of the trendline, Küçüker believes the token is on the verge of a breakout. While Hughes agrees with this, he believes XRP must first close above $1.51.

Once the asset engineers this breakout, Hughes’ chart points to another Fibonacci resistance area around $2.71, which aligns with the 0.618 retracement. This is the last Fib retracement resistance before the $3.6 all-time high. As for Küçüker, he believes the breakout could push XRP to $15, challenging Ethereum’s position as the second-largest crypto asset.

Bitcoin Rallied 10x in 18 Months the Last Time the BTC SLRV Ratio Dropped This Low: Analyst

Bitcoin long-term holders are accumulating the coin at record levels, pushing the SLRV ratio to levels that preceded major price moves.

Crypto firm Rand Group shared this development in a recent X post, citing data from Glassnode. The on-chain analysis shows that the share of realized BTC value in short-term holders’ wallets has continued to decline as supply rotates toward diamond hands.

Key Points

  • The share of realized BTC value in short-term holders’ wallets has continued to decline as supply rotates toward diamond hands.
  • Bitcoin’s long-term holders (LTHs) now control the largest share of realized value ever recorded.
  • The SLRV ratio chart shows a steady rise in long-term holder dominance since peaking at 1 in 2024.
  • Bitcoin rallied 10x in 18 months, spurred by the heightening LTH accumulation.

Bitcoin LTHs Control Highest Supply Share in History

According to recent Glassnode data, Bitcoin’s long-term holders (LTHs) now control the largest share of realized value ever recorded. This means that a large chunk of the asset’s circulating supply is now domiciled in wallets that have held for at least 155 days.

Notably, a recent Bitwise report confirmed this. Specifically, addresses in this category now control an unprecedented 14.85 million BTC, representing 74.3% of the coin’s circulating supply.

An accompanying Short-to-Long-Term Realized Value (SLRV) ratio chart shows that older wallets continue to absorb supply while short-term holder market participation remains relatively weak.

Bitcoin SLRV/Glassnode

The chart highlights a steady rise in long-term holder dominance since the ratio peaked at 1 in 2024. As more Bitcoin moves into dormant wallets, the SLRV ratio drops, currently trading near 0.1.

What It Means for Bitcoin Supply

Growing LTH’s market share implies that the amount of actively circulating supply gradually shrinks. Historically, this type of environment has reduced aggressive sell pressure and strengthened broader market structure over time.

The latest SLRV reading is especially notable as it aligns with the push of long-term holders’ realized value to a new all-time high. That suggests a large portion of the Bitcoin supply now sits with participants who have shown stronger conviction in holding even in the face of market uncertainties.

At the same time, short-term activity remains comparatively muted. This usually reflects a market where speculative momentum has cooled significantly, leaving patient holders in control of supply dynamics.

Interestingly, the current structure resembles previous cycle transition periods. In earlier phases, Bitcoin often spent months moving sideways while long-term market whales quietly accumulated the coin in preparation for the next bull market.

Previous Ratio Dip Sent Bitcoin Flying 

Rand Group highlighted that the last time the Bitcoin SLRV ratio reached current lows, the market reacted bullishly. The chart shows this happened in late 2022 when Bitcoin dipped to $15,000 amid the bear market.

During that period, long-term holders steadily accumulated BTC, pushing the metric to the 0.1 level. Eventually, momentum returned, and Bitcoin entered one of its strongest rallies in history.

The analyst claimed that Bitcoin rallied 10x in 18 months, spurred by the heightening LTH accumulation. However, market data shows that the premier asset managed an over 8x rally from $15,000 to the October 2025 all-time high of $126,220.

Nonetheless, this still represents a massive price move for BTC. For context, if history repeats and the coin rallies 8x from the current price of $77,350, that will take its price to $618,800 per coin.

At the moment, Bitcoin is stuck below the immediate resistance at $81,000 while finding support at the current level. Breaking this resistance paves the way for a rally to higher prices.

Ripple’s $150M LMAX Bet Begins Delivering as XRP Gains Institutional Collateral Role

A strategic investment Ripple made earlier this year is beginning to show results, with potential benefits for XRP.

Notably, LMAX Group has officially launched Kiosk, a new institutional platform that allows firms to use digital assets such as XRP, Bitcoin, and RLUSD as collateral across multiple trading markets.

The development has drawn attention within the XRP community. Commentator Eri highlighted the launch on X, describing it as a major step toward institutional adoption of XRP.

Notably, Kiosk provides institutions with a single platform to store, manage, and deploy digital assets as collateral across multiple markets. It supports trading in forex, precious metals, crypto, CFDs, and perpetual futures.

Key Points

  • Ripple’s $150M investment in LMAX begins paying off with Kiosk enabling XRP as institutional collateral.
  • Kiosk platform lets institutions manage multi-asset collateral across forex, crypto, metals, and derivatives.
  • RLUSD is a settlement and collateral asset within LMAX’s institutional trading system.
  • The XRP community views Kiosk as a step toward deeper institutional adoption and real-world utility.

XRP and RLUSD Move Deeper Into Institutional Finance

The launch follows Ripple’s January 2026 partnership with LMAX Group. At the time, Ripple invested $150 million to help expand infrastructure for its stablecoin, RLUSD.

At the time, both companies stated that RLUSD would play a key role as a collateral and settlement asset within LMAX’s system. The new Kiosk platform now puts that plan into action by enabling institutions to use digital assets directly in trading and collateral operations without additional blockchain setup.

LMAX says clients can store digital assets in LMAX Custody and instantly use them as collateral across its trading platform. Kiosk also combines treasury tools, API access controls, WalletConnect support, and security management in a single dashboard.

The aim is to simplify institutional trading, reduce operational complexity, and improve access to liquidity.

CEO Says Collateral Efficiency Is the Future

In his comments, LMAX CEO David Mercer said the future of finance will depend on faster and more efficient collateral systems that connect traditional finance with digital assets.

He explained that Kiosk provides institutions with secure custody, easy connectivity, and instant access to collateral, making it easier for firms to use digital assets in their core trading operations while remaining compliant.

Mercer also said the platform will help clients access institutional-grade liquidity and create new revenue opportunities as demand for digital asset products continues to grow.

Ripple and LMAX Expanding a Unified Trading Ecosystem

Meanwhile, the broader partnership between Ripple and LMAX has focused on building a unified marketplace spanning forex and crypto trading.

LMAX previously reported $8.2 trillion in institutional trading volume last year, highlighting the large-scale financial network Ripple is connecting with.

Through this partnership, RLUSD will be a regulated stablecoin for institutions, supporting settlement, collateral management, and trading across multiple markets.

The system also allows institutions to combine collateral across multiple asset classes. Instead of managing separate margin accounts for crypto, forex, and derivatives, firms can use RLUSD and digital assets such as XRP within a single unified setup.

XRP supporters see the Kiosk launch as another step toward XRP gaining real institutional utility beyond speculative trading.

Expert Says XRP Efficiency in Payments Lies in Velocity, Not Locked Liquidity

Popular community figure Eri recently argued that XRP does not require massive locked liquidity for cross-border settlements. 

Her commentary highlights XRP’s efficiency in payment corridors, particularly in systems where fiat currencies are converted into XRP, transferred internationally within seconds, and then exchanged back into local currencies almost instantly.

Key Points

  • Popular community commentator Eri argues that XRP does not require massive locked liquidity to support cross-border settlements. 
  • She claims XRP’s reuse effect reduces the need for large idle or locked liquidity pools. 
  • A Bitso study suggests that 10 billion XRP, reused 100 times daily, can facilitate $10 trillion in bridged transactions. 
  • Critics argue that, despite XRP’s speed advantages, insufficient liquidity depth could still lead to slippage and bottlenecks during peak demand. 

XRP Doesn’t Need Massive Token Lock-Up for Cross-Border Settlements 

According to Eri, XRP can process large transaction volumes without relying on a massive locked float because the asset is optimized for rapid reuse in global settlements.

Her argument centers on XRP’s role as a bridge currency for cross-border payments. In a typical payment corridor, institutions can convert fiat currency into XRP, transfer the asset internationally within seconds, and immediately exchange it into another fiat currency.

To support her position, Eri referenced Bitso’s use of XRP for settlement operations. In this process, the exchange first converts U.S. dollars into XRP, then converts the XRP into Mexican pesos. She noted that the entire cycle can be completed within seconds, allowing the same XRP to be theoretically reused hundreds of times daily. 

10B XRP Can Facilitate $10T in Bridged Transaction Volume: Bitso 

To further illustrate the concept, Eri referenced a Bitso case study estimating that a liquid float of 10 billion XRP, reused roughly 100 times per day, could theoretically facilitate up to $10 trillion in daily bridged transaction volume. The estimate assumes an XRP price of approximately $10 per token. 

Image

Potential Limitations 

However, Eri also acknowledged that real-world bridging capacity depends heavily on where liquidity is concentrated. Notably, factors such as corridor depth, exchange liquidity, RippleNet-managed wallets, OTC desks, and market-maker inventories all play critical roles in determining actual transaction throughput.

As a result, she argued that many XRP analysts focus on expanding productive liquidity and strengthening major payment corridors rather than simply monitoring XRP’s circulating supply.

XRP Community Expresses Mixed Reactions

Eri’s comments have sparked intense debate within the XRP community. Supporters argue that XRP’s rapid settlement speed makes the asset highly capital-efficient and reduces the need for large amounts of locked liquidity compared with traditional payment systems.

However, critics contend that velocity alone cannot guarantee seamless global payments. Computer engineer CharuSan argued that without sufficiently deep liquidity pools, XRP could face bottlenecks and slippage during periods of heavy institutional demand.

He warned that even if XRP traded between $10 and $20, the network could still struggle to absorb massive transaction flows efficiently if market depth remains insufficient.

The debate highlights a broader issue for Ripple’s ecosystem. While XRP’s speed offers a significant competitive advantage, many analysts believe deep liquidity remains essential for maintaining stable, large-scale payment operations.