Home Blog Page 1195

Market Veteran Predicts Ethereum Slump in Q4 2024, Citing Similar Trends in 2016 And 2019

0

Market veteran Benjamin Cowen highlights Ethereum cyclical breakdown patterns in 2016 and 2019, predicting a repetition in Q4 2024.

He recently shared Ethereum’s ETH/USD monthly candles showing similar behavior, with a breakdown against Bitcoin (ETH/BTC) happening a third time, in similar circumstances as 2016 and 2019.

Ultimately, the question remains: will ETH/USD fall further to align with history?

Historical ETH/BTC Breakdowns

According to Cowen’s chart, in Q4 2016, Ethereum experienced its first major ETH/BTC breakdown, followed by a drop in ETH/USD the following months.

This move coincided with Ethereum breaking through a green regression curve, which notably acted as a strong support. Following this decline in Q4 and a break below the regression curve, Ethereum resumed upward momentum in the following months.

Similarly, Q4 2019 saw Ethereum undergo another ETH/BTC breakdown. After a brief recovery in October 2019, represented by a green candle, the cryptocurrency faced two red months in November and December, indicating further downside.

This pattern mirrors Ethereum’s movement below the regression curve, after which a recovery was seen in the following months, particularly the first quarter of 2020.

Potential Breakdown in Q4 2024 

Looking ahead, the analysis suggests Ethereum has already experienced the historical ETH/BTC breakdown. Ethereum is currently tracking closely to the logarithmic regression band, and a slump could occur if ETH/USD drops further. Similar to 2016 and 2019, a decline could follow before Ethereum rebounds in the subsequent months.

Ethereum’s monthly trends for 2024 have already displayed volatility. The year began with five consecutive green months from January through May. However, since June, the price has seen a series of red months, with October 2024 also shaping up to be a red month. This behavior echoes the patterns observed in previous breakdown periods.

Whale Movements Add to Bearish Sentiment

Adding to the bearish pressure, recent on-chain reports have seen large amounts of Ethereum being transferred to exchanges. A whale who participated in Ethereum’s ICO has been actively moving ETH, recently transferring 5,000 ETH (valued at $12.22 million) to Kraken.

This sale is part of a larger trend, with the whale having sold 45,000 ETH over the past two weeks at an average price of $2,516. To date, the whale has sold 60,000 ETH for $149.68 million.

Additionally, the Ethereum Foundation transferred 2,500 ETH ($6.06 million) to the Bitstamp exchange in two transactions. This activity has sparked speculation that further sales may occur, particularly as Ethereum continues to face downward pressure in Q4 2024.

BNB Price Eyes $600 After 6.26% Weekly Gain: Is $747 a New ATH on the Horizon?

With a bullish reversal, the Binance coin (BNB) price is heading for a critical breakout event. Will this lead to a new all-time high?

BNB price has increased by 2.17% in the past 24 hours, registering a 6.26% gain in the last seven days. This is a remarkable feat, as it comes at a time when the altcoin market witnessed a minor pullback. 

Currently, the Binance coin is trading at $583, with a market cap of $85.213 billion. With a reversal rally gaining momentum, BNB is gradually approaching the $600 mark. 

Will a bullish trend in the BNB price lead to a new all-time high in 2024? Let’s find out. 

BNB Coin’s 4-hour Rounding Bottom 

The 4-hour chart shows the BNB price action, revealing a support trendline fallout. This happened during the broader market correction due to the geopolitical tensions in East Asia. 

BNB price chart
BNB price chart

However, the Binance coin price quickly found support at the $537 level to start a recovery rally. The trend reversal in the BNB price forms a rounding bottom formation, with a neckline near the $610 supply zone or the previous swing high. 

However, based on the trend-based Fibonacci levels, the BNB price is facing opposition near the 38.20% level at $587. However, the growing influence has led to a bullish crossover between the 50 and 100 EMA. 

BNB price chart
BNB price chart

Furthermore, the 4-hour RSI line maintains a sideways trend above the 50%  half-line, reflecting an overall bullish sentiment. 

Will Binance Price Hit $750?

As the recovery rally aims to approach the rounding bottom’s neckline, a potential bullish breakout will likely target the $639-$667 in the short term. On a larger scale, the 161.80% Fibonacci level at $747 is an optimistic target by the end of 2024. 

Hence, the underlying potential shows the possibility of BNB forming a new all-time high in 2024. However, the broader market sentiment will play a crucial role in determining the price fluctuations towards the target.

Aptos Eyes $13.71 After 112% Surge: Will the $10 Breakout Confirm?

Amid the potential for a $10 breakout, bullish run anticipations for Aptos (APT) are surging. Will this breakout lead to a rise to $18?

With a minor recovery in the altcoin market, Aptos is on the verge of a bullish breakout. Standing at a crossroads near the crucial resistance, slightly below the $10 psychological mark, the future price of Aptos depends on the current short-term price trend. 

Will the recovery rally in Aptos give a breakout rally to extend the recovery run in this October season? Let’s find out in the APT price analysis below. 

Aptos Price Analysis

The daily chart shows a rounding bottom reversal, which indicates a trend reversal rally. Aptos has increased by 2.53% in the past 24 hours and is currently trading at $9.24.

Aptos Price Chart
Aptos Price Chart

Aptos has a market cap of $4.64 billion and is on the verge of a breakout rally. The neckline of the rounding bottom pattern stands at $9.49, coinciding with the 50% Fibonacci level. 

Calculating from the 52-week low of $4.34, the AI token has increased by 112% within the past two months. As the recovery rally gains momentum, the increased influence has resulted in multiple bullish crossovers. 

Where’s Aptos Price Headed? 

With the 20-day and 200-day EMAs giving a bullish crossover, the 50- and 100-day EMA crossover gives a more prominent buy signal. Meanwhile, the rising trend in the 50-day EMA teases a golden crossover with the 200-day EMA. Hence, the overall sentiment of the exponential moving averages is bullish and gives a buy signal for Aptos. 

However, the RSI indicator takes a sluggish route near the overbought boundary line as Aptos reaches the rounding bottom’s neckline. This warns of a minor pullback due to the short-term divergence. Hence, a retest of the 20-day EMA is possible. 

Nevertheless, as the recovery rally continues, a bullish breakout of the 50% Fibonacci level will kick-start the next recovery run. The next price targets for Aptos are $13.71 and $18.00. On the flip side, the crucial supports are at $7.76 and $6.76.

Shiba Inu Team Says SHIB Can Surge 1,000% in 2 Days

0

Lucie, Shiba Inu’s marketing lead, has asserted that the Shiba Inu ecosystem could surge 1,000% in two or three days.

In a tweet on Wednesday, Lucie noted that the Shiba Inu ecosystem has the undeniable capability to grow extensively within a short period, teasing a 1,000% uptick in assets affiliated with brand.

The assertions came while she assured the Shiba Inu community that the recent price downturn would be short-lived. Lucie argued that temporary price consolidation of this nature should not scare holders, especially proponents of a “well-established ecosystem” like that of Shiba Inu.

Notably, Lucie’s post explaining the “irrelevant “choppy SHIB price came amidst a wider market correction. The recent sideways run has seen the 13th largest crypto asset by market cap depreciate 17% from the $0.00002133 high seen on September 28.

While she did not specifically mean the next two or three days, her statement aimed to demonstrate the fact that despite the ongoing price struggles, when the bull run fully kicks in, Shiba Inu ecosystem tokens could record massive spikes within a short period. SHIB previously recorded such a spike from Feb. 28 to March 5.

Price Outcome is Assets in the Shiba Inu Ecosystem

Putting Lucie’s assertions of a 1,000% uptick in the Shiba Inu ecosystem into perspective, let us consider the prices of Shiba Inu (SHIB), Doge Killer (LEASH), and Bone ShibaSwap (BONE) if they surge 10x.

At press time, SHIB changes hands at $0.00001758. A 1,000% surge will see the token hit $0.000193. It bears mentioning that the price mark is miles above SHIB’s all-time high of $0.00008845, attained in October 2021.

Furthermore, a 1,000% surge in BONE’s $0.4053 will push its price to $4.458. This means the asset will reach a market cap of $930 million and rank 72 among the top cryptocurrencies by market cap.

LEASH, which currently trades for $258, will trade at $2,844 if it records a similar 1,000% surge. Notably, its market cap could rally to $297 million should this occur, potentially placing it among the top 180 crypto assets by market cap.

1,00% Surge Possible?

Although lofty, some analyses back a possible 1,000% SHIB surge. Multiple speculators have tipped the meme coin to hit $0.00017 in the past.

Popular market pundit Emily Universe stated that SHIB had the potential to surge ten times its current price. She mentioned other tokens alongside the memecoin but didn’t provide specific reasons for her assertion. Technical analyst JD also speculated that Shiba Inu will surge 1,000% when the altcoin season begins. 

Meanwhile, positive sentiments around the Shiba Inu ecosystem continue to surge significantly. Factors like an increased burn rate, a liquid staking protocol integration, and an uptick in on-chain activities have fueled investor confidence that the ecosystem’s assets will appreciate exponentially.

Will NEIRO Break $0.0020 as a 70% Rally Teases Channel Breakout?

Could the ongoing bull run in NEIRO continue to $0.0020 as a rising channel breakout teases the next bullish launch?

The “First NEIRO on Ethereum” meme coin has surged nearly 70% in the past seven days, now approaching a billion-dollar market cap. NEIRO’s current market cap stands at $718 million, with the token trading at $0.001708.

Will this recovery rally in NEIRO result in a breakout rally for an extension above $0.0020? 

NEIRO Price Analysis

The bullish recovery has surged the market price by 2.80% in the past 24 hours. In the 4-hour chart, the NEIRO price trend reveals a rising channel pattern as the bullish momentum increases. 

The bull cycle within the rising channel accounts for the 83% surge from $0.0009368 to $0.001708 in the past few weeks. Now, the meme coin is challenging an overhead resistance. 

NEIRO price chart
NEIRO price chart

There is some consolidation near this resistance, with several long-wick candles indicating higher price rejection. Moreover, the price has surpassed the 1.618 Fibonacci retracement level at $0.001560, based on the previous bearish cycle.

Smart Trader Shifts To First NEIRO on Ethereum

As the bullish trend in the “First Nero on Ethereum” gains momentum, a smart trader who previously earned $145 million from Shiba Inu has made a notable shift. This trader swapped out of a losing position in Nero Ethereum for the rising First NEIRO on Ethereum.

Yesterday, the entity sold 17.5 million Nero Ethereum for $1.22 million, incurring a loss of $1.49 million or 55% after almost a month of holding. However, after the sale, the smart trader quickly switched to the First Nero on Ethereum, investing $1.45 million to get 841.6 million tokens.

Will NEIRO Cross $0.0020?

Presently, First Neiro On Ethereum is struggling to break through the 2.618 Fibonacci level at $0.00199. If the price manages to breach this overhead resistance, potential targets for the token could be $0.0024 and $0.0027.

However, the 4-hour RSI shows signs of a bearish decline as the price stalls near the trend line. The MACD indicator also suggests a potential bearish crossover, with the MACD and signal lines converging.

These technical indicators signal a possible pullback. Should a bullish breakout fail, NEIRO may find support at $0.001560 and $0.001289.

BitBoy Explains Strategy to Make $1 Million in Crypto “Fast”

Crypto personality Ben Armstrong, widely known as BitBoy in the crypto community, has revealed his strategy for turning a modest sum into a $1 million fortune.

Armstrong shared this insight in a new video on Tuesday, emphasizing that the path to wealth speeds up dramatically after hitting six figures. He broke down the process using Bitcoin’s historical performance and the power of compound interest to illustrate how investors can scale their portfolios exponentially.

Making the First $100K is the Hardest

Armstrong starts by addressing the challenges of making the first $100,000 in crypto, calling it the hardest step. “Making your first $100K in crypto is hard,” he admits. However, he follows up by suggesting that once investors hit this milestone, reaching $1 million is significantly easier due to the nature of scaling.

Quoting Benjamin Franklin’s adage that “money makes money,” Armstrong explains that the wealth accumulated from the initial investment multiplies faster over time.

He backs up this claim by comparing Bitcoin’s historical annual return of 100.68% to the S&P 500’s average of just under 11%. This data illustrates how Bitcoin investors could double their investment every year simply by holding onto their assets.

$1K Turns to $1M Faster After First Crossing $100K

Armstrong pointed out that if an investor had started with $1,000 in Bitcoin, they could have grown their investment to $128,000 in seven years. The key insight is that after reaching that point, the next three years could bring the portfolio over $1 million with no additional investment.

Accordingly, BitBoy highlighted the significance of dollar-cost averaging, noting how consistent small investments can accelerate wealth building. However, he warned that the projected result is not straightforward, as it also depends on when one enters the market.

For instance, investors who entered the Bitcoin market in Q4 of 2021 would just be breaking even today, three years later, as the market went bearish after the initial top. Nonetheless, BitBoy noted that by simply holding, an investor could go from $100K to a million dollars much faster than it took to make the first $100K.

“The larger the amount, the faster it compounds, like a snowball rolling downhill—it just gets bigger faster,” he said.

Investors Need Discipline to Accumulate Wealth

Furthermore, BitBoy emphasized that the second reason net worth tends to skyrocket after reaching $100K is experience. He pointed out that an experienced investor has a better grasp of how to react to market fluctuations.

Armstrong illustrated this by discussing a scenario where an investor bought Ethereum in early 2021 for $1,700, only to see it rise to $4,000 by May. When the May crash hit, and the price dipped below $2,000, some investors likely reacted emotionally and panic-sold.

Shortly after, the price rebounded to $2,300, prompting these investors to FOMO-buy back in. As a result, their initial investment of one ETH is now worth only 0.86 ETH.

He used this example to underscore the importance of patience and long-term thinking amid market volatility. Essentially, he stressed that being invested in the market for the long haul is often more beneficial than trying to time the market perfectly.

Ultimately, he said, “The friction of wealth accumulation is all in the beginning,” urging crypto investors to focus on scaling their portfolios.

Analyst Says Bitcoin Following Perfect Script, Set for An Explosive Uptick Above $150,000

0

Analyst Bob Loukas has asserted that Bitcoin is following a perfect price pattern that could trigger an explosive price surge above $150,000.

Bitcoin’s price has had a choppy start to Uptober, a month widely speculated to drive the premier crypto asset to new highs. For context, the last two October saw Bitcoin respectively surge 28.52% and 5.56%. Meanwhile, the asset is down 1.41% so far from its September closing price.

Notably, the unprecedented price performance has been catalyzed by surging geopolitical tensions, global economic concerns, and the upcoming US November election.  However, analyst Bob Loukas likened Bitcoin’s price performance to a perfect script, implying that the firstborn crypto is undisputedly on track for a price explosion.

Bitcoin Perfectly Following Script

Per Loukas, Bitcoin will close the second year of its four-year cycle in November, ushering it into the penultimate year. The analyst stated that the third year in the Bitcoin cycle has historically been super-bullish and expects an upsurge above $150,000.

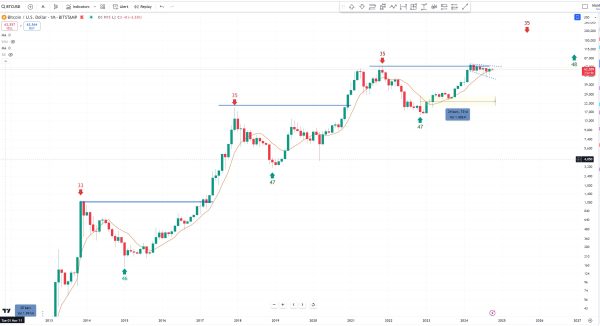
Furthermore, Loukas noted that Bitcoin has formed an 8-month base, which is perfectly set for an upsurge. It has been consolidating in a falling wedge since its all-time high of $73,949 in March, with the analyst asserting that it would break out to record prices in the third year.

A chart accompanying Loukas’ analysis shows that Bitcoin would grow over 59% from its current $62,213 price to trade at this cycle’s top between $150,000 and $200,000. Notably, Bitcoin would have to break above the baseline and out of the falling wedge pattern to confirm the analyst’s assertions.

Bitcoin Prediction per Bob Loukas

Meanwhile, other analysts have predicted a similar Bitcoin price upsurge. Veteran trader Peter Brandt and Morgan Creek’s CEO Mark Yusok asserted that the premier crypto asset will hit $150,000 by 2025.

Favorable Macroeconomics Catalyzing Prediction

Moreover, Loukas stated that his perfect Bitcoin script is backed by growing positive sentiments and reducing interest rates. The analyst asserted these macroeconomic conditions are catalysts for the impending surge.

For context, Bitcoin surged to $66,000 days after the Federal Reserve slashed interest rates by 50 basis points (bps) on September 18. Although the latest US employment data dimmed the light on a rate cut in November, Fed Chair Jerome Powell earlier implied there may be two more interest rate reductions this year.

Furthermore, an appreciable interest in Bitcoin was recently noticed as optimism grew on an impeding price uptick. Per Santiment, the term ‘btc’ trended in search engines as investors sought trading strategies to leverage on an underlying price appreciation.

Also, bullish sentiments around Bitcoin grew extensively as factors, including institutional traction and whale buy-ins, spurred the optimism. These scenarios support Loucas’ assertion of an explosive Bitcoin surge to $150,000.

Here’s XRP Price and Market Cap if Shiba Inu is Able to Rise 10,000%

0

XRP might clinch a two-digit figure if the broader market witnesses a rally that eventually pushes Shiba Inu price up by 10,000%.

Though residing in different market segments, the price movements of XRP and Shiba Inu often rhyme in tandem with the direction of the broader cryptocurrency market. Notably, this is largely due to the correlation that exists within the crypto market, as it trails Bitcoin’s (BTC) price movements.

XRP and Shiba Inu Often Trail the Broader Market

While both Shiba Inu and XRP have largely moved in similar directions throughout this year, a trend observed across the top 20 crypto assets, the rate of their price movements has varied significantly. 

Notably, SHIB often observes steeper declines and greater upsurge due to its higher volatility being a meme coin, as opposed to the relative stability with XRP, an asset in the payments segment. Data from Sentiment confirms this, with SHIB currently seeing a 4-week volatility of 0.14, while XRP’s volatility sits at 0.054.

XRP and Shiba Inu Volatilities Santiment
XRP and Shiba Inu Volatilities | Santiment

As Shiba Inu and XRP continue to move in the same direction for most of the year, bullish market projections around one of them could theoretically translate to similar price movements for the other, though at varying degrees.

Although Shiba Inu has struggled in recent weeks, its price has stabilized around the $0.000017 region. Shortly after the approval of Ethereum ETFs in July, while SHIB traded for $0.000016, market analyst Ava Monaro presented the meme coin as one of multiple assets that could experience 10,000% or 100x gains.

Possible XRP Price if Shiba Inu Gains 10,000%

Being an integral part of the crypto market, before Shiba Inu can record a rally as substantial as 10,000%, the broader market must have already slipped into a bull phase. XRP could equally leverage this bull run to record its unique gains. 

In such a scenario, XRP is likely to witness much lower gains due to its limited volatility. However, supposing XRP observes only 40% of SHIB’s proposed 10,000% increase, the altcoin would surge by an impressive 4,000%. 

With XRP currently changing hands for $0.5304, a 4,000% rally would push its price to $21.7, a two-digit figure and a new all-time high. With a circulating supply of 56 billion tokens, a price of $21.7 would push XRP’s market cap to a whopping $1.215 trillion, higher than Bitcoin’s current valuation.

Interestingly, multiple analysts have also projected a possible rise in XRP price to the $20 region. In May, Javon Marks argued that XRP’s bullish breakout could push prices toward $15 to $20. Earlier this month, another market commentator ModernInvest said it would be odd if XRP failed to hit $20 this bull run. 

Wallet Linked to Ripple Offloads 100,000,000 XRP to Anonymous Address

0

A substantial 100 million XRP transfer between unknown wallets linked to Ripple has sparked community speculation about potential market moves.

This large transfer, valued at approximately $53.057 million at the time of the move, was executed between two unknown wallets “rP4X2hTa7A” and “rhWt2bhRq3.” 

The ongoing activity of these wallets is drawing increased scrutiny, particularly as both wallets have previously been involved in high-volume transfers.

Background of the Transaction

Blockchain data reveals that both wallets involved in the recent transaction have shown previous activity. Meanwhile, the sending wallet “rP4X2hTa7A” has a history of receiving significant sums from Ripple and has continuously moved large amounts of XRP in recent weeks.

On September 23, this wallet received a notable 200 million XRP directly from Ripple and has since dispersed these funds across various unidentified wallets. On several occasions, these transfers have involved the same recipient, suggesting a coordinated movement of funds.

Likewise, the receiving wallet has been active over the past month, receiving multiple transactions from the same sending address. For example, this address took in 17.446 million XRP just the same day as the latest 100 million XRP transfer. It has also handled smaller amounts, ranging from 550,000 XRP to 20 million XRP tokens. 

Previous Activity and Concerns

Further analysis of the transfer history reveals that the sending wallet has been involved in consistent XRP movements throughout September. Data from Bithomp confirms that on September 19, this wallet transferred another 100,000 XRP to an external address.

These regular, high-value transactions have sparked concerns among the XRP community, with some speculating that the recipient could be preparing to sell the tokens in the near future. Notably, at press time, the recipient wallet of the latest 100 million XRP transactions continues to maintain its balance. 

Market Reactions

As this high-volume transfer unfolded, the price of XRP registered a slight increase of 0.57% over the past 24 hours, bringing its value to $0.5295. Despite this short-term gain, the token has seen an overall decline of 11.55% over the past week.

Analyst Says Cardano Entering Depression Stage, Recommends Accumulation

0

Popular crypto chartist Ali Martinez suggests that Cardano investors are currently in the depression phase of the market cycle but hints at a potential rally. 

Martinez made the assertion in a recent X post while analyzing Cardano’s price movement. The post features a chart showing the emotional phases of a market cycle, overlaid on another reflecting Cardano’s price actions and investors’ emotional response to these price movements. 

Cardano’s Current Emotional Stage 

According to the chart, the emotional phases include euphoria, complacency, anxiety, denial, panic, anger, depression, and disbelief. Notably, Martinez confirmed that Cardano investors are in the depression phase of the market cycle. 

This stage is marked by extreme pessimism, with many investors giving up on the asset’s chances of recovery. At this stage, investors blame themselves for committing huge funds to Cardano, which has declined massively over the years. 

Despite this belief, Martinez noted that the depression stage often represents a buying opportunity. He advised against selling ADA at this point, suggesting investors should continue holding and accumulating the coin. 

According to the analyst, accumulating ADA during such pessimism could pay off when the market shifts to disbelief, marked by a “sucker’s rally.” 

Overall, Martinez is stating the importance of taking advantage of market downturns and accumulating ADA when other investors are scared of investing. He believes this decision might pay off when the market phase shifts to disbelief, leading to a significant rally. 

Cardano Investors Remain Confident Despite ADA Witnessing Significant Losses  

Cardano has experienced its fair share of the market’s unending downturns. The coin, which started the year in the top 10 ranking, is now out of this position. It is currently the 11th-biggest crypto, with a market cap of $12.09 billion. 

Data from CryptoRank shows that ADA’s price has plunged 41.9% since the beginning of this year and 41.1% in the past six months. ADA has lost about 11.3% of its value this month alone, as it currently trades at $0.3459 per token. Also, Cardano is down 88.82% from its all-time high (ATH) of $3.10, registered in September 2021. 

ADA’s massive price plunge over the years has left many investors in huge losses. According to IntoTheBlock’s In/Out of the Money metric, 75% of Cardano addresses are in losses at the current price. Conversely, 20% of Cardano investors are seeing profit, while the remaining 5% are at break even. 

Despite Martinez’s analysis, IntoTheBlock’s data suggests that most Cardano investors have shown long-term commitment. Notably, 72% of Cardano addresses have held the coin for over a year, while 25% have held onto their ADA between 1 and 12 months. The remaining 3% addresses have been holding the coin for less than a month.