Home Blog Page 1210

Dogecoin Now Targeting $0.17 After Retesting at $0.11786

Maintaining an overall bullish uptrend, will this pullback lead to a higher high for Dogecoin as price action hints at $0.17?

Despite the crypto market’s setback this week, the bullish influence over the past few weeks has set the meme coin and altcoins on a bullish stand. The biggest meme coin in the crypto segment, Dogecoin, has a market cap of $17.30 billion and is currently trading at $0.1184. 

Over the past seven days, the meme coin has increased by 9.01%. By Sunday, the weekly gain stood at 16.95%. With a surge in volatility over the past few days, the meme coin is now trading at $0.11836. Will this volatility lead to an uptrend continuation to $0.17? 

Dogecoin Faals Under 200-day EMA

On the daily chart, Dogecoin exhibits a falling wedge breakout rally, gaining momentum and reclaiming the critical $0.10 psychological mark. The bullish trend peaked at $0.13 before retracing to retest the 100-day EMA.

Dogecoin Price Chart

Currently, the meme coin is trading between the 100-day and 200-day EMAs, with bullish momentum indicated by the 50-day EMA. Following an intraday gain of 3.62% after an 8.14% drop on Monday, Dogecoin shows signs of a post-retest reversal from the $0.11786 horizontal level.

Additionally, with a piercing candle formation, Dogecoin is gradually building bullish momentum and continuing its higher-low trend formation. Based on the price action analysis in the daily chart, upcoming resistance levels are projected at $0.14026, $0.17394, and $0.22008.

Due to increased supply on Monday, the MACD and signal lines are nearing a bearish crossover. However, the intraday recovery suggests that a continuation of the anticipated bullish trend may prolong the positive trend in the MACD and signal lines.

Short-term Bullishness For Long-term Gains?

In the 4-hour chart, the pullback on Monday breaks below the 61.80% Fibonacci level at $0.11807. Furthermore, it breached the 50-day EMA while taking support from the 100-day EMA. 

Dogecoin Price Chart

The dynamic moving averages on the 4-hour chart are maintaining a positive trend, indicating short-term bullishness. Additionally, a rounding-bottom reversal could be in play with a decline to $0.1387 or the 100% Fibonacci level.

The bullish trend struggled to sustain itself above the 78.60% Fibonacci level at $0.12717, resulting in a drop near the 50% EMA at $0.1168. Based on the Fibonacci retracement levels on the 4-hour chart, a continuation of the uptrend with a rounding-bottom breakout rally will likely target the $0.17226 level or the 1.618% Fibonacci extension.

Conversely, critical support levels stand at 50% and 38.20%, respectively, and Fibonacci levels at $0.1168 and $0.10528.

Eigenlayer (EIGEN) Pumps Hard Amid Binance Listing: Is $10 Within Reach?

Will the bullish trend in Eigenlayer (EIGEN) continue to $10 as the listing gains surpass $4 in a single day?

With Binance’s announcement to list Eigenlayer, the crypto market is regaining momentum, and interest in EIGEN is surging. Following the Binance listing, other major exchanges, including KuCoin and Bitget, have added EIGEN to their offerings.

Additionally, leading U.S. exchange Coinbase has announced the transition of the EIGEN-PERP pre-launch market into a standard perpetual futures market. This transition commenced early today, October 1.

EIGEN Hits $4 

With a surge in demand for Eigenlayer, the market cap skyrocketed to $767 million, and the EIGEN token reached a market price of $4.30, accompanied by a massive 145% spike in 24-hour volume.

Since its listing on exchanges, Eigen has increased by 15.94% and is currently trading at $4.31. The technical chart on Binance shows that the uptrend in EIGEN takes a sideways approach and consolidates above the $4 mark. 

EIGEN Price Chart
EIGEN Price Chart

The consolidation reflects a slowdown due to bullish exhaustion following the initial listing rally. However, the sideways trend, rather than a pullback, indicates that buyers are holding onto their recent purchases. Furthermore, a potential double-bottom reversal is emerging within the consolidation range.

The trading volume for Eigenlayer has seen a slight dip amid this consolidation, suggesting that the initial listing gains may be slowing.

Will Eigen Layer Hit $10?

EigenLayer is middleware built on the Ethereum network. It helps commoditize decentralized trust. The growing adoption and listing of Eigenlayer on major exchanges could likely fuel further uptrend.

Based on the 5-minute timeframe, the trend-based Fibonacci levels, the uptrend can target the 50% Fibonacci level at $6 and the 61.80% Fibonacci level at the $6.50 mark. 

If the uptrend is sustained, the altcoin could potentially reach the $10 psychological mark, driven by strong demand and improving sentiments in the crypto market. However, future targets remain uncertain due to the lack of historical price action, and the advent of bearish momentum in the market could also worsen the outlook.

Santiment Warns Bitcoin Top Likely in, but FUD Could Spark Renewed Bull Run Quickly

0

Market intelligence platform Santiment has recently reiterated its observations on the crowd’s sentiment towards Bitcoin, warning of an unexpected market turn. 

According to its analysis, the market is overly bullish, and this optimism points to a potential market top, a trend often followed by corrections in the cryptocurrency market.

Monday’s market retrace has already triggered some panic selling, which forced Bitcoin from $65,634 to close at $63,329.

Amid this pullback, Santiment suggests that if fear of missing out (FOMO) shifts to fear, uncertainty, and doubt (FUD), the market’s bullish trend could quickly resume, bringing more volatility into the scene.

Crowd Sentiment Signals Potential Correction

For context, Santiment’s data from Friday shows that Bitcoin traders have been increasingly confident following a significant 22% price surge over the past three weeks.

Their sentiment ratio, which tracks the balance between bullish and bearish posts about Bitcoin, revealed a noticeable rise in optimism. Specifically, the platform highlighted that there were 1.8 bullish posts for every bearish post on Bitcoin, indicating that traders have grown more confident in the market.

However, Santiment warns that markets tend to move in the opposite direction of crowd expectations. This suggests that this bullish outlook may precede a potential market shift.

This growing confidence is reflected in Santiment’s sentiment ratio chart, which shows how quickly positive sentiment took hold after Bitcoin’s price spike. The chart indicates that traders’ optimism has reached its highest level of the year, but history suggests that overly bullish sentiment often precedes corrections. 

Bitcoin Holders’ Behavior Suggests Market Still Bullish

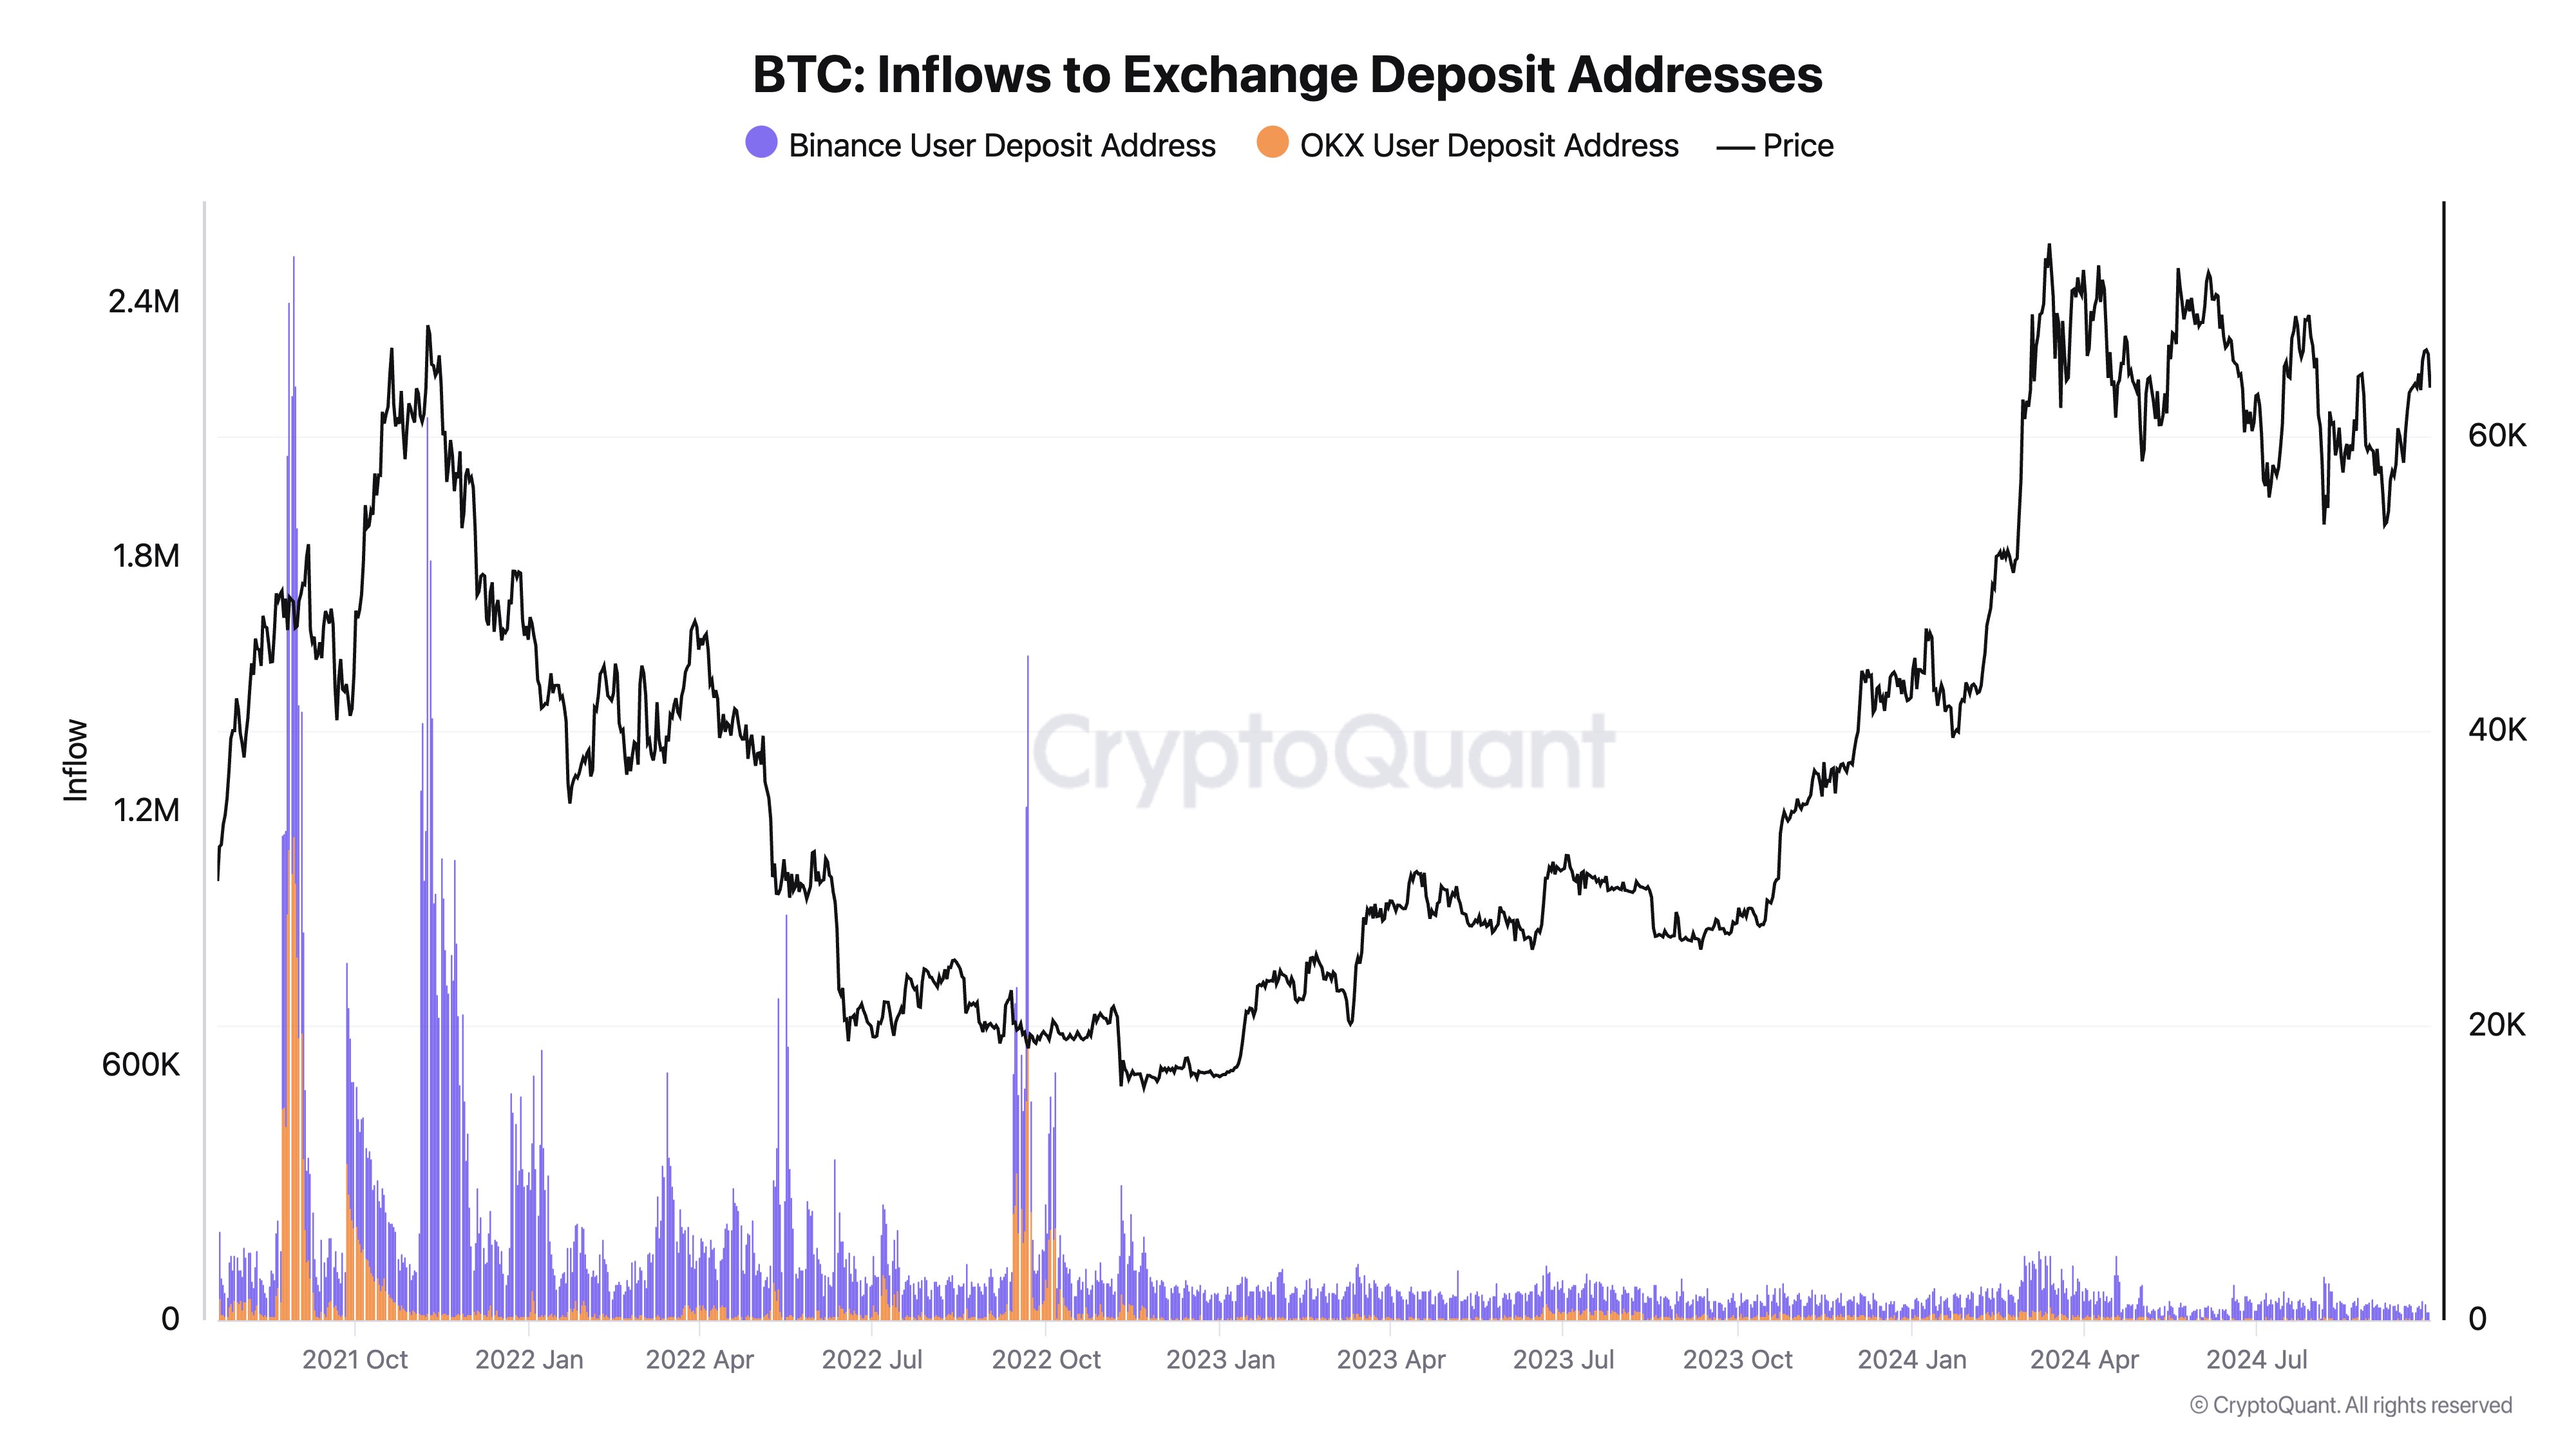
Adding to Santiment’s observations, recent exchange inflow data indicates stability in Bitcoin holdings. In an X post, Ki Young Ju, CEO of CryptoQuant, emphasized that Bitcoin inflows into exchange wallets are normal compared to previous bear market periods.

Image

Inflows on major exchanges like Binance and OKX have significantly reduced since the peaks observed in late 2021 and early 2022. Back then, heightened inflows were tied to increased selling pressure, which led to Bitcoin’s price decline below $20,000.

The current inflow stability, however, presents a more positive outlook. As Bitcoin’s price recovers in Q4 2023 and 2024, inflows into exchanges remain relatively calm, suggesting that holders are less inclined to sell in panic. 

Essentially, Young Ju seeks to suggest that the market remains bull rather than bearish.

Complementing the stability in exchange inflows, CryptoQuant’s growth rate difference chart further underscores the ongoing bull market. 

This chart, which compares Bitcoin’s market capitalization with its realized cap, shows that the market cap is outpacing the realized cap, a key signal of bullish momentum. The chart’s analysis mirrors Bitcoin’s past bull and bear cycles, where sharp market cap increases often marked the beginning of bull cycles.

Japanese Metaplanet Now Holds 506.7 Bitcoin After Latest $6.9M Acquisition

0

Metaplanet has acquired 506.7 BTC, valued at $32 million, in less than five months after adopting Bitcoin as its primary treasury reserve.

Japanese-based investment firm Metaplanet announced on Tuesday that it has increased its Bitcoin stash. Per a filing, the company acquired 1 billion yen ($6.95 million) worth of Bitcoin, amounting to 107.91 BTC.

Metaplanet noted that it acquired the tokens at an average price of 9.2 million yen ($64,168) per BTC. Notably, Metaplanet acquired the BTC amidst growing enthusiasm among market spectators of a notable surge in Uptober.

With the Tuesday addition, Metaplanet holds 506.7 BTC, valued at $32 million. The investment firm acquired the stash at an average price of 9.37 million ($64,931) yen per bitcoin.

Metaplanet Ramps up Bitcoin Acquisition

The October 1 purchase added to Metaplanet’s recent streak of Bitcoin acquisitions. The firm has now acquired Bitcoin every month since it announced that it has adopted the premier asset as its primary treasury reserve.

On September 10, Metaplanet announced it had acquired 38.46 BTC at an average price of 7.79 million yen per bitcoin. The firm also acquired 104.93 BTC and 114.37 BTC in July and August, respectively.

Dubbed the Asian MicroStrategy, Metaplanet followed in the footsteps of the Michael Saylor-founded firm by storing its treasury in the largest cryptocurrency by market cap. As MicroStrategy does, Metaplanet also raises funds to acquire additional Bitcoin.

In August, Metaplanet secured 1 billion yen at an annual percentage yield (APR) of 0.1% to acquire Bitcoin. Interestingly, the investment firm received the 6-month loan from UK-based MMXX Ventures Limited.

Meanwhile, an emerging trend has been seen among Japanese firms regarding Bitcoin acquisitions. On September 30, another Japan-based company, Remixpoint, acquired 64.4 BTC ($4.2 million). An earlier report showed that Remixpoint also bought 2,260.5 SOL, 12,269.9 AVAX, and 130.1 ETH, all worth $10.25 million.

Notably, this trend among Japanese firms came amidst the depreciation of the yen currency. Amidst the yen’s underperformance since the start of the year, these firms have turned to Bitcoin, popularly known to hedge against inflation and currency devaluation.

Metaplanet’s Stock Surge 4%

Following the announcement today, Metaplanet’s stock 3350.T surged over 4% to 1,049 yen. However, the 3350.T stock relinquished some of the gains, trading at 1,008 yen at the time of writing.

Notably, Metaplanet’s stock has been on an impressive run since adopting Bitcoin as its primary reserve. The stock is up 430% year-to-year and over 445% since mimicking MicroStrategy’s playbook in May.

Here Are New Timelines for Shiba Inu to Reach $0.0001 or $0.001 As SHIB Rises 45% to $0.00001855

0

Following Shiba Inu’s 45% surge to $0.00001855, multiple entities, including Changelly and ChatGPT, have set new timelines for SHIB’s potential rally to $0.0001 and $0.001. 

Shiba Inu (SHIB) was among the best performers in the recent market recovery. The leading dog-themed token recorded a monthly surge of 40%, pushing its price to $0.00001855. 

Interestingly, several Shiba Inu enthusiasts believe the recent price uptick is just the beginning of what’s to come in the future. Consequently, they expect Shiba Inu to surge to loftier targets like $0.0001 or $0.001. 

With Shiba Inu priced at $0.00001855, hitting the $0.0001 and $0.001 targets demands a surge of 384.02% and 4,740%, respectively. 

Potential Gains If Shiba Inu Hits $0.0001 or $0.001 Targets 

The significance of these targets to investors cannot be overemphasized. Achieving these milestones would result in substantial gains for Shiba Inu holders. 

To put it into perspective, if Shiba Inu hits the $0.0001 target, a portfolio of 1 billion SHIB tokens, currently worth $20,600 today, would be valued at $100,000. Similarly, these 1 billion tokens would be worth $1 million if SHIB clinches the $0.001 target.   

Previous Timeline for Shiba Inu to Hit $0.0001 and $0.001 

Before now, top entities had already provided timelines regarding when Shiba Inu could clinch these targets. For instance, the experts at crypto trading company Changelly projected that Shiba Inu could hit the $0.0001 price territory by December 2027, about three years from now. They also speculated that the $0.001 target could become a reality by January 2040, less than six years from today. 

Furthermore, prominent AI chatbots, including OpenAI’s ChatGPT, also provided timelines for SHIB’s potential surge to the $0.0001 and $0.001 levels. As of June, ChatGPT forecasted that Shiba Inu could clinch the $0.0001 target by 2027, with a climb to $0.001 anticipated three years later. 

Updated Timelines 

These projections have been modified following Shiba Inu’s 45% surge, with Changelly and ChatGPT setting new timelines. 

Changelly’s Updated Timeline 

Despite the surge, Changelly experts extended the timeline regarding when the $0.0001 prediction could become a reality. According to the analysts, the $0.0001 target could materialize by October 2028, with the token expected to reach a maximum price of $0.000103 by then. 

Changelly 2028 prediction

Additionally, the exchange expects Shiba Inu to eliminate another zero from its price and ultimately clinch the $0.001 target by January 2040. By then, the experts project that Shiba Inu would trade at a minimum price of $0.00136, an average price of $0.00143, and a maximum price of $0.00162. 

Changelly 2040 prediction

ChatGPT Updated Timeline 

Meanwhile, ChatGPT provided a detailed explanation of the potential timeline for Shiba Inu to surge to the $0.0001 and $0.001 targets. Notably, the AI bot referenced Shiba Inu’s recent 50% rally to issue the projection. 

Since Shiba Inu spiked 45% in one month to $0.00001855, ChatGPT projected that SHIB could reach the $0.0001 target in the next three to four months, assuming this growth rate remains fairly stable. Similarly, it expects the $0.001 target to become a reality in the next 32 months (around 2.5 – 3 years). 

Potential Catalysts That Could Propel Shiba Inu Surge to $0.0001 or $0.001 

Meanwhile, ChatGPT did not highlight any catalyst that could propel Shiba Inu’s surge to the ambitious targets of $0.0001 and $0.001. Conversely, Changelly mentioned a few factors that could drive SHIB’s price to the level. 

Changelly identified Shiba Inu’s Layer-2 blockchain Shibarium as an important factor that could help enhance investors’ appeal for SHIB, potentially pushing the token to loftier targets. 

According to Changelly, the L2 blockchain provides users with Ethereum-compatible transactions with reduced fees. A portion of these fees is used to burn SHIB, which helps reduce Shiba Inu’s circulating supply and boost the value of the remaining tokens. 

The trading platform also acknowledged Shiba Inu’s vibrant community as another factor that could pave the way for a massive rally. 

Furthermore, Shiba Inu’s ecosystem team’s dedication to providing users with substantial utility could also positively impact SHIB’s future price. The team has been making progress in bolstering cryptocurrency utility.

So far, the team has introduced games, a metaverse project, non-fungible tokens, a decentralized exchange, and liquid staking to the Shiba Inu ecosystem. These projects could help drive Shiba Inu’s adoption, potentially pushing SHIB’s price to unprecedented levels like $0.0001 and $0.001.  

New Milestone: Ripple Becomes First Blockchain Business Licensed by Dubai’s DFSA 

0

Ripple secures an in-principle license from the Dubai Financial Service Authority (DFSA), making it the first blockchain-based company to be licensed by the regulator. 

Through this license, Ripple aims to expand its payments service from the Dubai International Financial Centre (DIFC) into other parts of the United Arab Emirates (UAE) while enhancing its operations in the Middle East. 

It is worth noting that the approval officially makes Ripple the first blockchain-based business to be licensed by the DFSA.  

Features of the License 

According to the announcement, the approval will allow Ripple to launch enterprise-grade digital asset infrastructure to a broader customer base in the UAE. Specifically, the company will introduce its cross-border payment services, including Ripple Payments Direct (RPD), from the DIFC to other parts of the UAE. 

Notably, the expansion corresponds with Ripple’s commitment to provide businesses with faster, cost-effective, and more efficient cross-border payment solutions. The San Francisco-based company plans to achieve this goal by integrating regulatory compliance with ongoing investments in relevant areas, like custody and liquidity. 

Reacting to the development, Ripple CEO Brad Garlinghouse commended the UAE’s forward-thinking regulatory approach, which has guided businesses looking to invest and expand in the country. 

Ripple Expands Its Footprint in UAE 

Ripple is not a stranger in the UAE. The company first launched its regional headquarters in Dubai in 2020. Ripple has continued to expand its footprint in the region, specifically within the DIFC. 

Last year, Ripple got the DFSA to approve XRP for use within the DIFC, allowing licensed firms to incorporate the token into their businesses.

In August, Ripple partnered with the Innovation Hub of DIFC to foster blockchain adoption in the UAE, thanks to the company’s 1 billion XRP Fund Program. Through this partnership, Ripple connects emerging developers in the region with DIFC’s vast network. 

Furthermore, Ripple recently renewed its ties with NYU Abu Dhabi to support blockchain research and other student initiatives. 

Ripple Holds 55 Licenses 

Meanwhile, following the DFSA in-principle approval, Ripple claims it now holds over 55 regulatory licenses globally. 

The company acquired the licenses from New York, Singapore, and Ireland, among others. 

Experts See Recent Bitcoin Dip as Buying Opportunity Ahead of $73,750 Retest

0

The price of Bitcoin has recently experienced consolidation and gradual correction after consecutive days of uptrend, causing concern among short-term holders.

However, analysts remain optimistic, forecasting potential new all-time highs. For instance, according to analyst Michaël van de Poppe, Bitcoin’s price action this month has aligned with expectations. He noted that Bitcoin drove liquidity in the crypto market with its recent two-month high at $66K and is now correcting these gains.

The chart marks a significant area where Bitcoin “took liquidity” above recent highs.

Bitcoin 6H Chart
Bitcoin 6H Chart

This move typically signals a price spike that triggers stop-losses from short traders before a reversal occurs. Bitcoin’s price is currently hovering around $63,908, with key support levels identified below this price.

Buying Opportunity Before Bitcoin Retests $73,750

The area between $60,748 and $61,166 is highlighted as crucial for maintaining bullish momentum. Should Bitcoin’s price drop below these support zones, it could threaten the structure of the current uptrend.

However, as the analyst disclosed, this correction offers a potential buying opportunity. Michaël hinted at a potential to accumulate more as the $60K retest could lead to another rally to test the previous all-time high at $73,750.

The analyst also identified another support zone between $56,000 and $57,000, which could act as a fallback should Bitcoin fail to hold above the $61,000 level.

History and Future Outlook

In addition to current price dynamics, market watchers like Mags note historical trends suggesting Bitcoin bull runs typically start in October. These trends align with previous Bitcoin halving events, which tend to reduce supply and drive up demand, creating bullish momentum. 

September has traditionally been a challenging month for Bitcoin, but this year’s gains have defied historical patterns, fueling optimism for the months ahead.

Market data shows Bitcoin gained over 10% in September 2024, a stark contrast to previous years where losses were common. This has raised expectations for October, especially as past Septembers with positive closes have often led to significant rallies.

Investment Bank Report Identifies Ripple as a Major Competitor to SWIFT

0

A report from global investment bank Houlihan Lokey mentions innovations in cross-border payments, revealing Ripple as a growing challenger to SWIFT.

A recent report from investment banking firm Houlihan Lokey discusses the improvements transforming the cross-border payments sector. The report, released in April as a Market Update, was recently spotlighted by XRP community figure WrathofKahneman (WOK).

One of the observations pointed out by WOK is that Ripple, a blockchain-based payment solution, is emerging as a serious competitor to SWIFT, the dominant player in cross-border payments for decades. 

The report stressed that the cross-border sector sees about $190 trillion flowing globally in transactions annually. Notably, this makes the market a lucrative space where even incremental improvements in efficiency or cost reduction can have massive impacts.

Fragmented Payments Sector Presents Ripple with Opportunities

Per the report, the international payments market, while large, faces fragmentation. Traditional banking systems rely heavily on intermediaries, adding both cost and complexity to cross-border transactions. 

These inefficiencies make the market ripe for disruption, particularly through new technologies that can simplify the process and reduce expenses. Ripple, leveraging blockchain technology, has positioned itself as a challenger to the legacy SWIFT network. 

Notably, the system Ripple uses helps to provide faster settlement times, lower fees, and enhanced security compared to traditional banking systems.

Ripple and Blockchain Gaining Momentum

According to the report, Ripple and other blockchain solutions are beginning to make inroads into the cross-border payments market, competing with card networks and SWIFT’s established dominance.

Meanwhile, Ripple’s partnerships with various fintech companies further solidify its position. The report also highlights Airwallex, Nium, and Wise as other firms that are driving growth in this space. Two of these companies are Ripple partners.

For instance, Ripple’s partnership with Airwallex, confirmed in 2017, focuses on enabling efficient cross-border payments across its extensive network of business clients. Nium also teamed up with Ripple in 2020 to enhance its remittance services using RippleNet.

SWIFT Still Dominant but Facing Stiff Competition

Although SWIFT remains the leader, the report confirms its competition on multiple fronts. Besides Ripple and blockchain solutions, other fintech companies are providing alternative services that cater to the needs of businesses and individuals. 

The report notes that firms such as Payoneer, TransferMate, and Thunes are also making strides, targeting the same clients who are tired of high fees and delayed settlement times typical of traditional systems.

The global cross-border business-to-business (B2B) payments market, expected to grow from $39.3 billion in 2023 to $56.1 billion by 2030, provides room for competition. Ripple’s positioning will likely become even more prominent amid the growing demand for more efficient, lower-cost solutions.

Furthermore, in the remittance space, Ripple’s partnerships with companies like Tranglo are already proving transformative. Tranglo joined forces with Ripple years back, but only fully integrated the ODL service from Ripple across all its routes in 2022.

Ripple Issues New Warning About Its Stablecoin: Here are Details

0

Leading blockchain payments company Ripple issues a new public service announcement (PSA), notifying the general public that its stablecoin, Ripple USD (RLUSD), is still in private beta. 

Ripple noted that although network participants have seen some interesting on-chain activity related to RLUSD, the stablecoin is not yet available for public use. The company warned users to be wary of scammers, emphasizing that any claims of RLUSD distribution are likely scams.

Furthermore, Ripple encouraged crypto enthusiasts to watch for official updates and be wary of potential scams.  

Growing Speculation Amid Surge in RLUSD Minting 

Ripple’s latest message about RLUSD comes amid growing speculations regarding the stablecoin. The private beta testing, which began on August 9, has seen Ripple mint some RLUSD tokens on XRP Ledger (XRPL) and Ethereum networks in its early stage. 

Interestingly, most recently, XRP enthusiasts witnessed over 1.7 million RLUSD minted in five days. These tokens were issued on XRPL and Ethereum across 14 transactions. 

Amid the surge in RLUSD minting, several community members speculated that Ripple may have minted 80-100% of the stablecoin’s supply. 

The speculation gained steam after famous community figure and XRPL dUNL validator Vet tweeted that Ripple minted 99% of RLUSD’s supply in 24 hours. Vet’s comment triggered speculation that the company could be preparing for the mainnet launch of the stablecoin.  

Scam Targeting XRP Holders Amid Anticipation for RLUSD Launch 

As speculation regarding the stablecoin’s launch surge, scam-related activities have also increased. Vet warned XRP community members that scammers have been commenting under the RLUSD tracker, which provides updates on all RLUSD mints, to exploit unwary investors. 

The validator shared a sample of this malicious message, announcing the fraudulent launch of “XRP Rewards Event.” Vet advised users against clicking links under the tracker’s comment section to avoid falling victim.

Besides this incident, other bad actors have claimed that RLUSD distribution has commenced, hoping to scam people of their funds. 

However, Ripple has dispelled these malicious claims, emphasizing that RLUSD is not yet available for public use. 

RLUSD Clawback Feature Could Hinder Its Launch on XRP Ledger This Year

Meanwhile, Vet speculated that RLUSD could launch only on Ethereum this year without going live on XRPL. He asserted that if RLUSD makes its mainnet debut on XRPL, the stablecoin’s clawback feature could prevent usage within the automated market maker (AMM). 

According to Vet, the XRP Ledger currently prevents the use of tokens with clawback features on the network’s AMM. Nonetheless, the XRP community figure suggested that two amendments, XLS-73 AMMClawback and XLS-77, are currently in development to address the issues.

More RLUSD Minted, with 2.3M Tokens Minted in One Week  

In the meantime, network participants have witnessed the minting of more RLUSD tokens hours after Ripple issued its public service announcement. Over the past 10 hours, Ripple has minted 600,000 RLUSD tokens, according to data from Ripple Stablecoin Tracker. 

The latest mint exercise occurred across five transactions on the Ethereum blockchain. Notably, in one week, Ripple has successfully minted 2,311,030 (2.31 million) RLUSD on Ethereum and XRPL. 

Here’s Bitcoin Performance in October Since 2013

0

October is the second-best month for Bitcoin since 2013, posting an average return of 21%.

Bitcoin posted an unusual 7.29% increase in September. Per data from Coinglass, historically, September has been the most underwhelming month for Bitcoin, with the premier crypto asset posting a net loss in eight of the last twelve years. On average, Bitcoin had a deficit of 3.77%.

However, the firstborn cryptocurrency saw substantial gains this September, boosting the confidence of crypto enthusiasts ahead of October.

Bitcoin’s Performance in Uptober

October has historically been Bitcoin’s second-best month in terms of price uptick, with only November outperforming it. Since 2013, Bitcoin has posted a monthly gain nine times in October, with an average growth of 21%.

Bitcoin Monthly Performance
Bitcoin Monthly Performance | Coinglass

As a result, market commentators have become increasingly optimistic that October will not be different this year. Notably, some interesting facts about Uptober, as the crypto community fondly calls it, get investors excited.

According to Lookonchain, up to five crypto bull runs started in October. The analysis shows that the market surge in 2013 started in the tenth month, with Bitcoin pumping 60.79% before a 449% uptick in November.

October Bull Run
October Bull Run

In 2017, the month of October facilitated another bullish upsurge. After a choppy September, October led Bitcoin’s rebound from around $4,000 with a monthly gain of 47.81%. Bitcoin continued the price uptick, peaking at $16,919.

The same happened in 2020, when Bitcoin surged 27.7% in October from $10,800. This bullish momentum continued until the premier crypto asset surged almost 600% to $60,000 in April 2021.

Notably, Bitcoin surged 39.9% and 28.52% in 2021 and 2023, sparking a market rebound in those years. Bitcoin hit new all-time highs in November 2023 after the rebound, while the 2023 October performance pushed the asset to the March 2024 ATH of $73,700.

New All-Time High?

If the 21% average Bitcoin returns are considered, Bitcoin could see a new high in October. A surge of that magnitude would push the premier asset from its current price of $64,000 to $77,440.

Meanwhile, analyst BitcoinHype pointed to an impending “up season only” Q4 performance. The market commentator revealed that in the years Bitcoin posted returns in September, it went on to record huge returns throughout the remaining months of the year. This trend occurred in 2015, 2016, and 2023.