Home Blog Page 1213

Will XRP Bull Run Reach $0.91 Amid Triangle Breakout?

With a breakout rally and rising speculation, XRP has topped $0.66 and is eyeing a potential breakout run to $0.91.

As the SEC approaches its deadline to appeal the recent ruling regarding Ripple, bullish sentiment is on the rise. The market price of XRP has climbed back to $0.65 today, accompanied by an 11% increase in trading volume.

Will this recovery rally continue to push above $0.70, or is a downturn imminent amid market pullbacks?

XRP Breakout Run

In the daily chart, XRP’s price action indicates a significant boost in the bullish cycle, surpassing the overhead resistance trend line. This marks a long-awaited triangle pattern breakout, unleashing strong upward momentum.

XRP’s price has surged by 9.94% over the past three days. With three consecutive bullish candles, the triangle breakout rally in XRP peaked at $0.6650, marking the highest price since March 2024.

XRP Price Chart

XRP Price ChartCurrently, the recovery run in XRP’s breakout rally is challenging the 78.60% Fibonacci level near $0.6521. Additionally, it has exceeded a crucial resistance level of $0.6280, which prevented a higher closing price since July 2024.

The key daily EMAs (50, 100, and 200) remain in bullish alignment, reflecting an uptick in demand and increasing bullish momentum. Furthermore, the triangle breakout rally suggests a rounding bottom reversal, with a neckline at the $0.72 mark.

XRP Price Ahead

Based on the Fibonacci levels, the XRP price hangs at the crossroads at the 78.60% level. A bullish breakout will put $0.72 and $0.91 as the next potential targets at the 100% and 1.618 Fibonacci levels. 

On the other hand, crucial support for XRP stands at the $0.6280 neckline and the $0.60 psychological mark. These levels may not be able to stand the incoming supply if the SEC decides to appeal, crushing the market optimism.

Supporting the appeal speculations, a former SEC lawyer told Fox Business reporter Eleanor Terrett that the agency would probably appeal the XRP ruling as they consider the ruling “illegal.”

XRP Breaks Six Month High as Whales Accumulate Over 470 Million Tokens

0

XRP has surged to a six-month peak as whale accumulation spikes, with analysts predicting bullish trends and long-term potential.

Starting on September 27, XRP experienced a notable upward trend that marked a shift from its earlier lackluster price momentum. Initially fluctuating between $0.57 and $0.61 for most of September, the cryptocurrency surged towards the end of the month, ultimately trading above $0.66 on Sunday evening.

This marks the first time XRP has reached this price level since March. Recent data indicate that this sudden price increase follows heightened whale accumulation.

Whales Load 470M XRP

A recent chart shared by Ali Martinez highlights that XRP holdings by large investors—specifically those holding between 100 million and 1 billion tokens—remained relatively stable throughout early to mid-September.

However, toward the end of the month, a significant increase in whale holdings emerged as these high-net-worth investors strategically accumulated XRP. Specifically, these whales have amassed over 470 million XRP over the last ten days. This surge in whale activity coincides with the upward price movement of XRP.


Image

As this accumulation trend persists, some market analysts foresee further growth potential for XRP in the near future.

Significant Long-Term Potential

Market observers closely monitor XRP’s recent price action, with analysts offering bullish projections. For example, Quincy Jones, a developer associated with the XDC Foundation, has highlighted XRP’s unique role as a tool for liquidity between assets such as bonds, stocks, and currencies.

He emphasized that XRP’s value is closely linked to the volume of equity and debt instruments supported by its network. According to Jones, as financial products issued on its blockchain grow, the token could reach extraordinary price levels, ranging from $100 to even higher, depending on transaction volumes.

Further Bullish Outlook

Another prominent analyst, Cryptobilbuwoo, supports a positive long-term outlook, comparing XRP’s current market behavior with its pattern in 2017. According to his analysis, XRP’s movement against Bitcoin mirrors trends that led to its significant rally seven years ago.

He anticipates that if these patterns continue, XRP could see a substantial increase, targeting a price of approximately $6.15. His assessment suggests that historical patterns might provide a basis for potential future price gains.

Here’s What Happens If Bitcoin Closes September in Green

0

Bitcoin set for significant gains as September ends in the green, with historical trends suggesting a favorable October.

As September concludes with Bitcoin (BTC) showing gains, analysts are referencing historical trends that indicate potential price increases in Q4 of 2024. Historically, Bitcoin has often experienced a rally following a positive September, with notable gains recorded in October, November, and December.

Historical Performance of Bitcoin in September

September has traditionally been viewed as a challenging month for Bitcoin, with many years reflecting price declines. However, in this year, 2024, Bitcoin (BTC) has gained over 10% during this September.

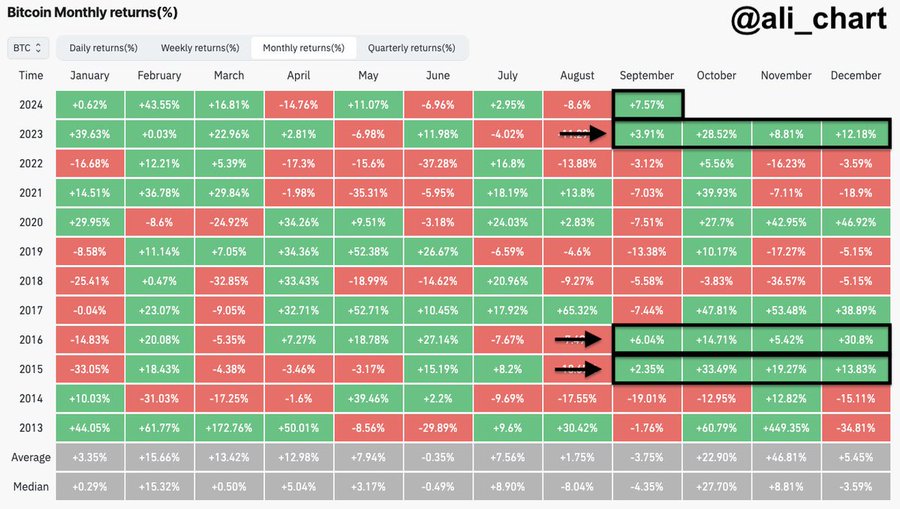
Market analyst Ali Martinez highlighted that past performance shows that a green monthly candlestick in September has historically led to significant gains in the following months. Notably, in 2015 and 2016, Bitcoin experienced October gains of 33.49% and 14.71%, respectively, after seeing a bullish September.

In September 2023, Bitcoin closed with a 3.91% gain, which preceded a 28.52% rally in October, indicating the potential for a bull run. This year’s positive close in September marks a significant departure from the historical trend of losses typically seen during this month.

Market Sentiment and Potential Price Predictions

Current market data shows Bitcoin trading just under the $66,000 mark, amid a minor dip of 0.2% in the last 24 hours. Analysts forecast that if Bitcoin continues to follow historical patterns, October could see substantial gains.

Should BTC replicate its 2015 performance, an increase of 33.49% would raise its price to approximately $84,365. A more conservative increase similar to 2016 would place Bitcoin around $72,495, just below its recent all-time high price.

Additionally, recent Federal rate cuts have contributed to favorable trading conditions, further supporting Bitcoin’s potential upward trajectory. These economic factors may influence investor activity and market dynamics in the coming weeks.

Michael Saylor Says He Would Take 0.5 Bitcoin: Details

0

Pro-Bitcoin MicroStrategy founder Michael Saylor reiterates his admiration of the Bitcoin, the premier crypto asset, noting he would take 0.5 BTC to dinner with himself.

In response to an X poll by Altcoin Daily, the staunch Bitcoin evangelist noted that he would prefer to receive half of 1 bitcoin than spend dinner with himself. Saylor insinuated he would rather receive a reward in Bitcoin than meet with any active promoter of the premier asset.


Saylor has often asserted the difference holding a portion of Bitcoin could make in an investor’s financials. He once noted that owning just 0.1 bitcoin can be life-changing, comparing the asset to Manhattan in cyberspace.

The Bitcoin Evangelist

Saylor has often stressed how Bitcoin will transform the global monetary system. On several occasions, he has noted that holding fiat currency or investing in most other traditional investment vehicles would result in asset loss.

The Bitcoin evangelist noted that inflation and other government policies were devaluating one’s wealth. In an interview earlier in the year, Salylor stated that the dollar had lost 90% of its financial value over the last 20 years, and the only option out of this menace is to invest in Bitcoin.

Notably, Saylor’s tweets have reflected his commitment to spreading the Bitcoin gospel, as he has often argued for Bitcoin’s superiority over other assets. Per a previous tweet thread, he has made several claims about Bitcoin.

He has also emphasized the financial implication of buying into Bitcoin, with MicroStrategy as a case study. On September 22, Saylor showed that MicroStrategy’s stock, MSTR, has been the top performer in the S&P 500 in the past four years, posting a growth of 1,071%.

Saylor stated that MSTR’s bullish performance is due to its adoption of Bitcoin as a primary treasury reserve. He further asserted that any entity could replicate such success by acquiring Bitcoin.

Saylor’s Bitcoin Predictions

The pro-Bitcoin founder’s ambitious price predictions back his theory that owning 0.1 BTC could be life changing. Per an earlier report, Saylor stated that Bitcoin would hit $13 million by 2045.

The Bitcoin staunch believer stated that increased adoption of the asset would drive the price uptick, noting that he sees the premier asset accounting for 7% of the global market’s capital. Putting the speculation into perspective, Bitcoin’s market cap would surge to $257.26 trillion, up 20,251% from the current valuation.

With the $13 million valuation, the 0.5 BTC that Saylor noted he would take will be worth $6.5 million. This aligns with his assertions that any amount of sats an investor holds could transform his financial life extensively.

Shiba Inu: Elliott Wave Analyst Expects Complex Structure to Push Shib to $0.0002

0

Analyst Michael has issued a forecast for Shiba Inu (SHIB), predicting it to erase another leading zero based on a complex Elliott Wave structure.

In a recent post on X, the market commentator confirmed that he believes the current price movement indicates the start of a bullish wave that could take SHIB to new highs.

Shiba Inu Elliott Wave Analysis Points to a Breakout

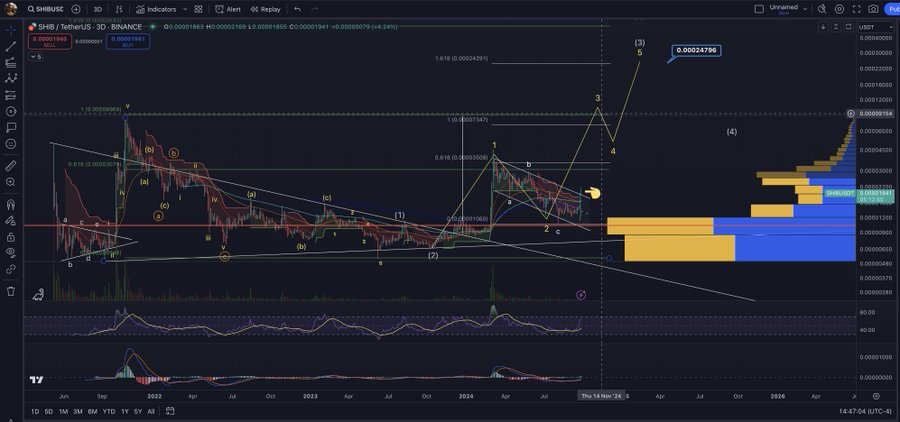
The accompanying chart identified Shiba Inu’s price as being in the middle of a five-wave impulse structure. The initial Wave 1 was completed when Shiba Inu surged to a peak of $0.000016117 on Aug. 24.

After this peak, SHIB collapsed, leading to the corrective Wave 2. This Wave 2 resulted in a retracement of the previous gains, with Shiba Inu completing it amid a collapse to $0.00001246 on Sept. 4.

Shiba Inu 3D Chart Michael
Shiba Inu 3D Chart | Michael

According to data from Michael’s chart, SHIB has now entered the most powerful upward wave, Wave 3. In Elliott Wave Theory, Wave 3 is the lengthiest and most powerful wave in the sequence. Projections suggest that this wave could push Shiba Inu’s price toward $0.0002479 and beyond.

SHIB’s Bullish Market Position

Besides the Elliott Wave structure, Michael also calls attention to support and resistance levels. On the upside, SHIB eyes an important level near $0.00003747, which marks a previous high aligning with the Fibonacci 0.618 region.

Breaking above this level would confirm the Elliott Wave projection and potentially pave the way for a target of $0.0002 in the medium term. Meanwhile, on the downside, IntoTheBlock data confirms robust support between $0.000014 and $0.000018, where 120,930 addresses hold over 550 trillion SHIB.

Shiba Inu GIOM IntoTheBlock
Shiba Inu GIOM | IntoTheBlock

The chart from Michael also calls attention to a falling wedge pattern, which has recently broken out to the upside. This breakout suggests that Shiba Inu could be starting its next upward move after a prolonged period of consolidation.

In addition, the MACD and RSI indicators confirm the bullish outlook. The RSI is positioned in the middle range. This indicates that there’s still room for price growth before reaching overbought territory, aligning with the Wave 3 potential.

Moreover, the MACD appears to be crossing into bullish territory, with bullish bars consistently forming over the past few days. At the reporting time, Shiba Inu changes hands at $0.00001866, down 3.52% this morning. From this level, SHIB would need to appreciate 1,228% to reach the $0.0002479 target.

Here’s When FTX Creditors With Claims of Under $50K Could Receive Compensation

0

A recent filing in the FTX bankruptcy case indicates that a court hearing to confirm the reorganization plan will be held on October 7. 

Prominent blockchain reporter Colin Wu confirmed the development today, detailing how creditors of the bankrupt exchange may receive compensation if the court approves the plan. 

Payment Schedule 

If approved, Colin Wu noted that creditors with less than $50,000 claims could start receiving payments by the end of 2024. This timeline aligns with reports indicating that the bankrupt exchange could commence repaying $16 billion to creditors in the fourth quarter. 

While creditors with less than $50,000 claims could be repaid before the end of 2024, Colin Wu noted that those with larger claims may not get their payments until 2025, specifically in the first or second quarter. 

FTX Reorganization Plan 

In May, FTX debtors’ estate, led by legal counsels from Sullivan and Cromwell, proposed a reorganization plan under which 98% of the exchange’s creditors will receive a minimum of 118% of their claims in cash. 

The plan noted at the time that payment would commence within 60 calendar days of the court’s approval. Therefore, if the court approves the reorganization plan by October 7, repayment could commence anytime before December 7.   

Creditors to Receive Less Than Their Crypto Value 

Although the original reorganization plan indicates that 98% of FTX creditors could receive 118% of their claims in cash, Sunil Kavuri, a representative of one of the exchange’s creditors groups, stated that customers could receive around 25% of their crypto holdings. 

According to Kavuri, FTX debtors estimated bankruptcy claims using the value of cryptos at the time. When FTX officially filed for bankruptcy, Bitcoin (BTC) was trading at around $16,000. However, the price of the premier asset has surged to $64,501. 

With creditors expected to be paid in cash, anyone who lost 0.5 BTC in the bankruptcy will receive around $8,000 in cash when repayment commences, instead of the $32,250 they would have received if claims were paid in kind. 

New Document Shows FTX to Allocate $230M to Shareholders 

In a surprising move, a new document suggests that debtors of defunct crypto exchange FTX agreed to allocate up to $230 million from government forfeiture proceeds to preferred shareholders. 

Notably, this agreement was executed on August 28 between FTX debtors and some holders of preferred equity interest. However, it became public on September 27 through a court filing. 

According to the agreement, FTX debtors are required to allocate 18% of all government forfeiture proceeds, totaling $230 million, to a special fund dedicated to shareholders. 

It bears mentioning that this provision contradicts what is obtainable during bankruptcy proceedings. Bankrupt firms traditionally reimburse creditors before catering to shareholders’ needs. 

Experts Predict XRP Price by Christmas, Say Big Things Happening to XRP Soon

0

The XRP token is stirring significant interest again in the crypto community, as it is finally capitalizing on the ongoing bull momentum in the crypto market.

While the broader market is cooling off from last week’s consecutive rallies, XRP commenced its own bull run late Friday and has seen impressive price movements since then.

Over the weekend, XRP’s price skyrocketed to $0.6622 from the Friday close of $0.5889, a growth of over 12.44%. Notably, XRP last saw the $0.66 price point in March, marking a six-month high.

Although XRP has experienced a slight pullback due to the broader market correction, it has defended most of its gains, trading at $0.6518 at press time. Despite its impressive weekend performance, market analysts believe XRP may not have even started its upward trajectory.

“Big Things” Happening to XRP Soon

In a post on X, Anup Dhungana, a notable trader and Bitcoin pundit, argued that “big things” are on the horizon for XRP. He expressed this sentiment on Sunday evening when XRP first broke back into the $0.65 range.

The chart accompanying his tweet highlighted his anticipation for XRP to approach the long-lost $3 price range in the midterm.

Image
XRP chart by Anup Dhungana

XRP To $3 by Christmas

Similarly, in a separate commentary, widely followed analyst Myles G Investments argued that XRP could reach $3 by Christmas, which is just three months away.

Notably, at the current value of $0.6518, XRP would need a powerful surge to drive its value up by 360% to attain $3. This price threshold was last seen about seven years ago, but these analysts believe it is now within reach, given the ongoing momentum in XRP.

When asked whether he expects $3 to be XRP’s peak for this cycle, Myles indicated that he thinks $3 would be a bottom price. This suggests he anticipates higher valuations for XRP well into 2025. 

In a statement earlier this year, Myles revealed that he would be profiting from his long-term XRP position within the price range of $3 to $7.

At the time, he narrated how his millionaire father sold his house for $800,000 to invest in XRP, showcasing confidence in its potential. With over 50 years of investment experience, Myles noted that his father believes the bold move could be the biggest “home run” of his career. 

Is Ripple Stablecoin Launch Coming Soon as 1,700,000 RLUSD Minted Since Sept 28

0

Ripple’s RLUSD stablecoin is undergoing extensive testing as part of the company’s look to extend its reach into the stablecoin market completely.

Initially announced in April, RLUSD began beta testing in August but is currently accessible only to the company’s enterprise partners. The increased minting activity suggests that Ripple is inching closer to an official launch.

Notably, according to the RLUSD tracker, since September 28, a total of 1.7 million RLUSD tokens have been minted across both the Ethereum blockchain and the XRP Ledger.

Significant Minting Surge

Notably, a major surge in RLUSD minting occurred within a 24-hour window on September 29, with 800,000 tokens created during this period. Vet, an XRPL dUNL Validator, reported that 99% of the total RLUSD supply was minted just a day before his update.

As of his report, the total RLUSD supply had reached 812,034 tokens across Ethereum and the XRP Ledger. 

Despite the heightened minting activity, RLUSD remains unavailable for public trading. Ripple has made it clear that they are awaiting regulatory approval among other things before opening the stablecoin to broader markets.

However, the company continues to conduct tests, burning small amounts of RLUSD, the least being 24 tokens, as part of its methodical private beta testing process.

Costs and Reserve Attestations

While the testing continues, discussions have arisen regarding the transaction fees associated with RLUSD on both Ethereum and the XRP Ledger. According to Vet, transaction costs are higher on Ethereum than on XRP Ledger.

Despite the increased costs, Ripple is reported to have overpaid for gas fees on both platforms during the testing process, likely as a precautionary measure.

In response to concerns about the stability and backing of RLUSD, Vet also highlighted that these are merely test runs. Ripple has committed to providing monthly reserve attestations upon the stablecoin’s official launch, which is expected to address concerns regarding its backing.

Ripple’s Shift in Strategy

Ripple’s stablecoin initiative appears to be part of a larger strategic shift. Ripple’s CTO, David Schwartz, had noted that XRP may be better suited for payments on the XRP Ledger than RLUSD.

This comment comes as Ripple expands its focus toward Ethereum and smart contract integration. Additionally, the company has been conducting stock buybacks.

Monica Long, Ripple’s President, also emphasized the different roles of RLUSD and XRP within Ripple’s ecosystem. While XRP continues to serve as a primary digital asset for payments, RLUSD is designed to facilitate rapid settlement and integration into traditional financial systems.

Analyst Predicts XRP Surge vs. BTC, Eyeing XRP Above $6

0

Analyst Cryptobilbuwoo expects XRP to spike against Bitcoin, with such a rally potentially leading to a new all-time high for the altcoin.

He compared XRP’s current trajectory to its behavior in 2017. According to him, the patterns seen now mirror those that led to a substantial surge seven years ago. If these similarities continue, the analyst believes XRP could surpass the $6 mark.

XRP’s March 2017 Pattern

Cryptobilbuwoo shared two charts that detail the movement of the XRP/BTC pair from March 2017 to September 2024. Notably, in March 2017, XRP’s price went through a period of decline before forming a low-low (LL) structure.

During this period, the market entered the pre-bull run phase, with Bitcoin recording a spike, while XRP underperformed. The analyst marked the structure formed with a green zone on the chart. This was a strong accumulation phase, where XRP consolidated largely against Bitcoin.

XRPBTC Cryptobilbuwoo
XRPBTC | Cryptobilbuwoo

However, shortly after the consolidation, XRP recorded an impressive rally against Bitcoin. This led to a breakout from the accumulation phase, pushing XRP to the new all-time high of $3.31 in January 2018.

A Repetition Could Push XRP to $6.15

Cryptobilbuwoo pointed out that a similar structure seems to be forming today. In the 2017 chart, once XRP broke through the resistance levels and began its upward move, the price quickly skyrocketed, indicating strong momentum. 

The current 2024 chart shows XRP attempting to break through similar resistance levels. Should this occur, the analyst believes XRP could experience a similar “rise of the phoenix” moment.

Notably, at the time of writing, XRP is experiencing a low-low and rebound phase, which the analyst suggests may signal a massive upward trajectory akin to what happened in 2017. 

Interestingly, data from both charts indicates that the stochastic RSI shows an oversold signal during the consolidation phase of 2017 and 2024. This suggests that buyers might regain control soon, setting the stage for another major price surge. 

Cryptobilbuwoo believes that when XRP records a spike similar to the one in 2017, the first target is around $6.15. This is approximately 88% of its previous 2017 high. 

Accordingly, the analyst suggests this price level would take XRP to a target between 0.0001 and 0.00012 BTC. Given the potential price level of Bitcoin, which the analyst estimates to be between $51,250 and $61,500, this could drive XRP toward even higher levels.

Top Economist Says XRP Has Not Yet Broken 6-Year Long Symmetrical Triangle

0

While a top economist notes that XRP is still trading within its six-year symmetrical triangle, other analysts expect a rally due to a breakout from the three-year triangle.

XRP’s underperformance over the past few years has triggered the formation of multiple symmetrical triangles on several timeframes. The largest of these triangles formed when XRP dropped from the $3.31 all-time high in January 2018, having lasted for over six years now.

Besides this six-year symmetrical triangle, XRP has formed two smaller triangles. One of these came up on the back of a collapse from the $1.96 peak in April 2021. Meanwhile, the second began forming following XRP’s slump from the $0.93 high last July. 

XRP Remains Within the 6-Year Symmetrical Triangle 

Notable economist Market Maestro recently stressed that XRP has continued to trade within the six-year triangle, with no breakout in sight yet. His chart highlights XRP’s long-term trend since its all-time high in January 2018. 

Market Maestro’s outlook advises caution, as XRP is still consolidating within this pattern. As the price consistently knocks at the $0.60 psychological level, it is close to the upper trendline but has not convincingly broken through yet. 

In the chart, multiple indicators show that despite several attempts to push higher, XRP remains within a larger consolidation zone. Based on Market Maestro’s analysis, XRP will need more momentum or external catalysts to escape the triangle pattern. 

XRP Breaches Smaller Triangle Variations

In contrast, market analyst Mikybull discussed a more immediate bullish sentiment. He focused his analysis on the three-year triangle pattern starting from April 2021 when XRP dropped from a high of $1.96. 

According to him, XRP is in the early stages of breaking out from this shorter triangle. The chart shows the beginning of an upward trajectory, with candles showing a strong push above the triangle’s upper boundary. 

Mikybull predicts that this breakout will lead to an “explosive rally.” He expects this rally to potentially push XRP to a price range between $10 and $20 in the current cycle. The volume and momentum indicators point toward rising buying pressure, suggesting that XRP is gathering the strength for a price surge.

Another analyst, XForceGlobal, presents a similar argument to Mikybull, showing XRP’s breakout from a multi-year BD trendline. He noted that XRP has breached this important level and could consolidate further, with potential retests of the trendline. 

If XRP holds above this level for a few more weeks, he foresees a sharp price increase to between $7 and $10. Like Mikybull, XForceGlobal’s analysis leans heavily on the idea that XRP is in the midst of a breakout, with the potential for sustained gains in the medium to long term.

Meanwhile, market analytical channel CryptoBusy called attention to XRP’s short term outlook. Analysts at CryptoBusy confirmed that XRP had broken above the symmetrical triangle that formed when it dropped from the $0.93 high last July. 

Image

This breakout triggered a 9% surge to $0.66 over the weekend. However, the short-term rally has cooled, with XRP now changing hands at $0.6466 at the reporting time. Despite this, the token remains above the pivotal $0.60 psychological level, pivotal for sustained uptrend.